AEMC Storage Charging Rules spark industry backlash as Tesla, Snowy Hydro, and investors warn transmission charges on batteries and pumped hydro could deter grid-scale storage, distort the National Electricity Market, and slow decarbonisation.
Key Points
AEMC Storage Charging Rules are proposals to bill grid storage for network use, shaping costs and investment.
✅ Charges apply when batteries draw power; double-charging concerns.
✅ Tesla and Snowy Hydro warn of reduced viability and delays.
✅ AEMO recommends exemptions; investors seek certainty.
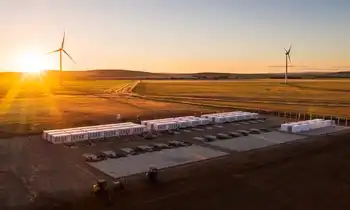
Tesla, Snowy Hydro and other big suppliers of storage capacity on Australia’s main electricity grid warn proposed rule changes amount to a tax on their operations that will deter investors and slow the decarbonisation of the industry.
The Australian Energy Market Commission (AEMC) will release its final decision this Thursday on new rules for integrating batteries, pumped hydro and other forms of storage.
The AEMC’s draft decision, released in July, angered many firms because it proposed charging storage providers for drawing power, ignoring a recommendation by the Australian Electricity Market Operator (AEMO) that they be exempt.
Battery maker Tesla, which has supplied some of the largest storage to the National Electricity Market, said in a submission that the charges would “kill the commercial viability of all grid storage projects, causing inefficient investment in alternative network”, with consumers paying higher costs.
Snowy Hydro, which is building the giant Snowy 2 pumped storage project and already operates a smaller one, said in its submission the proposed changes if implemented would jeopardise investment.
“This is a major policy change, amounting to a tax on infrastructure critical to achieving a renewable future,” Snowy Hydro said.
AEMO itself argued it was important storage providers were not “disincentivised from connecting to the transmission network, as they generally provide a net benefit to the power system by charging at periods of low demand”.
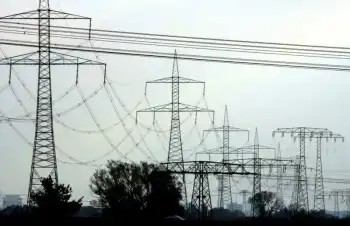
Australia’s electricity grid faces economic and engineering challenges, similar to Ontario's storage push as it adjusts to the arrival of lower cost and also lower carbon alternatives to fossil fuels.
While rule changes are necessary to account for operators that can both draw from and supply power, how they are implemented can have long-lasting effects on the technologies that get encouraged or repelled, including control of EV charging issues, independent experts say.
“It doesn’t have to be this way,” said Bruce Mountain, director of the Victoria Energy Policy Centre. “In Britain, where the UK grid transformation is underway, the regulator dealing with the same issues has said that storage devices don’t pay the system charges when they withdraw electricity from the grid,” he said.
The prospect that storage operators will have to pay transmission charges could “drastically” affect their profitability since their business models rely on the difference between the price their pay for power and how much they can sell it for. Gas generators and network monopolies would benefit from the change, Mountain said.
Sign up to receive an email with the top stories from Guardian Australia every morning
An AEMC spokesperson said the commission had consulted widely, including from those who objected to the payment for transmission access.
“The market is moving towards a future that will be increasingly reliant on energy storage to firm up the growing volume of renewable energy and deliver on the increasing need for critical system security services, with examples such as EVs supporting grid stability in California as the ageing fleet of thermal generators retire,” the spokesperson said, declining to elaborate on the final ruling before it is published.
“The regulatory framework needs to facilitate this transition as the energy sector continues to decarbonise,” the official said.
AusNet, which operates the Victorian energy transmission grid, said that while “technological neutrality is paramount for battery and hybrid unit connections to both the distribution and transmission networks,” it did not back charging storage access to networks in all cases.
“[Ausnet] supports a clear exemptions framework for energy storage providers,” a spokesperson said. “We recommend that batteries and other hybrid facilities should have transmission use of system charges waived if they provide a net benefit to network customers.”
We are not aware of anyone that supports the charging storage access to networks in all circumstances.
“Batteries and hybrid facilities that consume energy from the network should be provided no preferential treatment relative to other customers and generators.”
Jonathan Upson, a principal at Strategic Renewable Consulting, though, said the AEMC wants electricity flowing through batteries to be taxed twice to pay network charges – once when the electricity charges the battery and then again when the same electricity is sent out by the battery an hour or two later but this time with customers paying.
“The AEMC’s draft decision has the identical rationale for eliminating franking credits on all dividends, resulting in double taxing of company profits,” he said.
Christiaan Zuur, director of energy transformation at the Clean Energy Council, said that while much of AEMC’s draft proposal was constructive, “those benefits are either nullified or maybe even outweighed” by uncertainty over charges.
“Risk perception” will be important since potential newcomers won’t be sure of what charges they will pay to connect to the grid and existing operators could have their connection agreements reopened, Zuur said.
“Investors focus on the potential risk. It does factor through to the integral costs for projects,” he said.
The outcome of new charges may prompt more people to put batteries on their premises and draw power from their own solar panels, Mountain said, with rising EV adoption introducing new grid challenges, cutting their reliance on a centralised network.
“Ironically, it encourages customers to depend less and less on the grid,” he said. “It’s almost like the capture of the dominant interests playing out over time at their own expense.”
Separately, the latest edition of the Clean Energy Council Confidence Index shows leadership by state governments is helping to shore up investor appetite for investing in renewable energy amid 2021 electricity lessons even with higher 2030 emissions reduction goals from the federal government.
Overall, investor confidence increased by a point in the last six months – from 6.3 to 7.3 out of 10 – following strong commitments and policy development from state governments, particularly on the east coast, the council said.
“The results of this latest survey illustrate the economic value in policy that lowers the emissions footprint of our electricity generation, supporting regional centres and creating jobs. Investors recognise the opportunities created by limiting global temperature rise to 1.5 degrees,” said council chief executive Kane Thornton.
Among the states, NSW, Victoria and Queensland led in terms of positive investor sentiment.
Correction: this article was amended on 30 November. An earlier version stated Ausnet supported charging storage for network access. A spokesperson said it backed a waiver on charges if certain conditions are met.
Related News