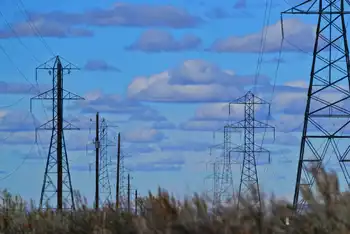
Farmers encouraged to look at energy use

By Southeast Farm Press


Protective Relay Training - Basic

Our customized live online or in‑person group training can be delivered to your staff at your location.

  • Live Online
  • 12 hours Instructor-led
  • Group Training Available
Regular Price:
$699
Coupon Price:
$599
Reserve Your Seat Today
About 40 Central Virginia farmers got insights into how to make their operations more energy efficient at a recent conference.

“Managing Energy on Virginia Farms” was held at the Cumberland County Community Center. Sponsors were Virginia Cooperative Extension; James Madison University; the Virginia Department of Mines, Minerals and Energy; the Virginia Foundation for Agriculture, Innovation & Rural Sustainability; and Virginia Tech.

Speakers addressed agricultural lighting and fan ventilation, wind and solar energy and U.S. Department of Agriculture energy programs and funding during the first half of the daylong conference.

Afternoon breakout sessions addressed specific electricity uses on poultry and dairy farms. Richard Hiatt, president and executive manager of the Rural Electricity Resource Council, told participants that in 2007 U.S. farmers spent an estimated $4 billion on electricity.

“If anything, (that annual cost) seems to be increasing or at least steady each year,” Hiatt said. The first step for farm operators who want to increase their energy efficiency and identify potential savings, he said, is to make a list of everything on the farm that uses electricity, from the lights in the poultry house and the pump in the well to the heating in the farm office and the air compressor in the shop. Next, group the uses into categories such as lighting, ventilation and material handling. Consider the amount of electricity each category consumes and the category’s hours of run time. Then review at least a year’s worth of utility bills to document present usage; note any seasonal or other demand changes.

“You’ve got to get into the bills,” Hiatt said. “You’ve got to get some sort of benchmark.”

Hiatt also talked about lighting options for animal buildings, which frequently have many light fixtures. “If you have a light on for a long time, you can do better than an incandescent bulb,” he said, adding that comparing options and cost is important before purchasing new fixtures. The same goes for ventilation systems, he said. He recommended getting fans’ performance ratings from suppliers.

Dick Peterson, president of Northeast Agriculture Technology Corp., agreed and emphasized the need to keep fans in good working order. Checking belt tension and alignment is critical, he said, and some work environments necessitate cleaning fans as often as four times a year. “If you don’t maintain that fan, the efficiencies go away fairly quickly.”

Related News

BC Hydro activates "winter payment plan"

BC Hydro Winter Payment Plan lets customers spread electricity bills over six months during cold weather, easing costs amid colder-than-average temperatures in British Columbia, with low-income conservation support, energy-saving kits, and insulation upgrades.


Key Points

Allows BC Hydro customers to spread winter electricity bills over six months, with added low-income efficiency support.

✅ Spread Dec-Mar bills across six months

✅ Eases costs during colder-than-average temperatures

✅ Includes low-income conservation and energy-saving kits


As colder temperatures set in across the province again this weekend, BC Hydro says it is activating its winter payment plan to give customers the opportunity to spread out their electricity bills as demand can reach record levels during extreme cold periods.

"Our meteorologists are predicting colder-than-average temperatures will continue over the next of couple of months and we want to provide customers with help to manage their payments," said Chris O'Riley, BC Hydro's president.

All BC Hydro customers will be able to spread payments from the billing period spanning Dec. 1, 2017 to March 31, 2018 over a six-month period.

Cold weather in the second half of December 2017 led to surging electricity demand that was higher than the previous 10-year average and has at times hit all-time highs during peak usage periods, according to BC Hydro.

Hydro operations also respond to summer conditions, as drought and low rainfall can force adjustments in power generation strategies.

People who heat their homes with electricity — about 40 per cent of British Columbians —  have the highest overall bills in the province, $197 more in December than in July, when air conditioning use can affect energy costs.

This is the second year the Crown corporation has activated a cold-weather payment plan, part of broader customer assistance programs it offers.  

BC Hydro has also increased funding for its low-income conservation programs by $2.2 million for a total of $10 million over the next three years. 

The low-income program provides energy-saving kits that include things like free energy assessments, insulation upgrades and weather stripping. 


Related News

View more

Utilities commission changes community choice exit fees; what happens now in San Diego?

CPUC Exit Fee Increase for CCAs adjusts the PCIA, affecting utilities, San Diego ratepayers, renewable energy procurement, customer equity, and cost allocation, while providing regulatory certainty for Community Choice Aggregation programs and clean energy goals.


Key Points

A CPUC-approved change raising PCIA exit fees paid by CCAs to utilities, balancing cost shifts and customer equity.

✅ PCIA rises from about 2.5c to roughly 4.25c per kWh in San Diego

✅ Aims to reduce cost shifts and protect non-CCA customers

✅ Offers regulatory certainty for CCA launches and clean energy goals


The California Public Utilities Commission approved an increase on the exit fees charged to customers who take part in Community Choice Aggregation -- government-run alternatives to traditional utilities like San Diego Gas & Electric.

After reviewing two competing exit fee proposals, all five commissioners voted Thursday in favor of an adjustment that many CCA advocates predicted could hamper the growth of the community choice movement.

But minutes after the vote was announced, one of the leading voices in favor of the city San Diego establishing its own CCA said the decision was good news because it provides some regulatory certainty.

"For us in San Diego, it's a green light to move forward with community choice," said Nicole Capretz, executive director of the Climate Action Campaign. "For us, it's let's go, let's launch and let's give families a choice. We no longer have to wait."

Under the CCA model, utilities still maintain transmission and distribution lines (poles and wires, etc.) and handle customer billing. But officials in a given local government entity make the final decisions about what kind of power sources are purchased.

Once a CCA is formed, its customers must pay an exit fee -- called a Power Charge Indifference Adjustment -- to the legacy utility serving that particular region. The fee is included in customers' monthly bills.

The fee is required to offset the costs of the investments utilities made over the years for things like natural gas power plants, renewable energy facilities and other infrastructure.

Utilities argue if the exit fee is set too low, it does not fairly compensate them for their investments; if it's too high, CCAs complain it reduces the financial incentive for their potential customers.

The Public Utilities Commission chose to adopt a proposal that some said was more favorable to utilities, leading to complaints from CCA boosters.

"We see this will really throw sand in the gears in our ability to do things that can move us toward (climate change) goals," Jim Parks, staff member of Valley Clean Energy, a CCA based in Davis, said before the vote.

Commissioner Carla Peterman, who authored the proposal that passed, said she supports CCAs but stressed the commission has a "legal obligation" to make sure increased costs are not shouldered by "customers who do not, or cannot, join a CCA. Today's proposal ensures a more level playing field between customers."

As for what the vote means for the exit fee in San Diego, Peterman's office earlier in the week estimated the charge would rise from 2.5 cents a kilowatt-hour to about 4.25 cents.

The Clear the Air Coaltion, a San Diego County group critical of CCAs, said the newly established exit fee -- which goes into effect starting next year -- is "a step in the direction."

But the group, which includes the San Diego Regional Chamber of Commerce, the San Diego County Taxpayers Association and lobbyists for Sempra Energy (the parent company of SDG&E), repeated concerns it has brought up before.

"If the city of San Diego decides to get into the energy business this decision means ratepayers in National City, Chula Vista, Carlsbad, Imperial Beach, La Mesa, El Cajon and all other neighboring communities would see higher energy bills, and San Diego taxpayers would be faced with mounting debt," coalition spokesman Tony Manolatos said in an email.

CCA supporters say community choice is critical in ensuring San Diego meets the pledge made by Mayor Kevin Faulconer to adopt the city's Climate Action Plan, mandating 100 percent of the city's electricity needs must come from renewable sources by 2035.

Now attention turns to Faulconer, who promised to make a decision on bringing a CCA proposal to the San Diego City Council only after the utilities commission made its decision.

A Faulconer spokesman said Thursday afternoon that the vote "provides the clarity we've been waiting for to move forward" but did not offer a specific time table.

"We're on schedule to reach Mayor Faulconer's goal of choosing a pathway that achieves our renewable energy goals while also protecting ratepayers, and the mayor looks forward to making his recommendation in the next few weeks," said Craig Gustafson, a Faulconer spokesman, in an email.

A feasibility study released last year predicted a CCA in San Diego has the potential to deliver cheaper rates over time than SDG&E's current service, while providing as much as 50 percent renewable energy by 2023 and 80 percent by 2027.

"The city has already figured out we are still capable of launching a program, having competitive, affordable rates and finally offering families a choice as to who their energy provider is," said Capretz, who helped draft an initial blueprint of the climate plan as a city staffer.

SDG&E has come to the city with a counterproposal that offers 100 percent renewables by 2035.

Thus far, the utility has produced a rough outline for a "tariff" program that would charge ratepayers the cost of delivering more clean sources of energy over time.

Some council members have expressed frustration more specifics have not been sketched out.

SDG&E officials said they will take the new exit fee into account as they go forward with their counterproposal to the city council.

Speaking in general about the utility commission's decision, SDG&E spokeswoman Helen Gao called it "a victory for our customers, as it minimizes the cost shifts that they have been burdened with under the existing fee formula.

"As commissioners noted in rendering their decision, reforming the (exit fee) addresses a customer-to-customer equity issue and has nothing to do with increasing profits for investor-owned utilities," Gao said in an email.


Related News

View more

Solar Becomes #3 Renewable Electricity Source In USA

U.S. Solar Generation 2017 surpassed biomass, delivering 77 million MWh versus 64 million MWh, trailing only hydro and wind; driven by PV expansion, capacity additions, and utility-scale and small-scale growth, per EIA.


Key Points

It was the year U.S. solar electricity exceeded biomass, hitting 77 million MWh and trailing only hydro and wind.

✅ Solar: 77 million MWh; Biomass: 64 million MWh (2017, EIA)

✅ PV expansion; late-year capacity additions dampen annual generation

✅ Hydro: 300 and wind: 254 million MWh; solar thermal ~3 million MWh


Electricity generation from solar resources in the United States reached 77 million megawatthours (MWh) in 2017, surpassing for the first time annual generation from biomass resources, which generated 64 million MWh in 2017. Among renewable sources, only hydro and wind generated more electricity in 2017, at 300 million MWh and 254 million MWh, respectively. Biomass generating capacity has remained relatively unchanged in recent years, while solar generating capacity has consistently grown.

Annual growth in solar generation often lags annual capacity additions because generating capacity tends to be added late in the year. For example, in 2016, 29% of total utility-scale solar generating capacity additions occurred in December, leaving few days for an installed project to contribute to total annual generation despite being counted in annual generating capacity additions. In 2017, December solar additions accounted for 21% of the annual total. Overall, solar technologies operate at lower annual capacity factors and experience more seasonal variation than biomass technologies.

Biomass electricity generation comes from multiple fuel sources, such as wood solids (68% of total biomass electricity generation in 2017), landfill gas (17%), municipal solid waste (11%), and other biogenic and nonbiogenic materials (4%).These shares of biomass generation have remained relatively constant in recent years, even as renewables' rise in 2020 across the grid.

Solar can be divided into three types: solar thermal, which converts sunlight to steam to produce power; large-scale solar photovoltaic (PV), which uses PV cells to directly produce electricity from sunlight; and small-scale solar, which are PV installations of 1 megawatt or smaller. Generation from solar thermal sources has remained relatively flat in recent years, at about 3 million MWh, even as renewables surpassed coal in 2022 nationwide. The most recent addition of solar thermal capacity was the Crescent Dunes Solar Energy plant installed in Nevada in 2015, and currently no solar thermal generators are under construction in the United States.

Solar photovoltaic systems, however, have consistently grown in recent years, as indicated by 2022 U.S. solar growth metrics across the sector. In 2014, large-scale solar PV systems generated 15 million MWh, and small-scale PV systems generated 11 million MWh. By 2017, annual electricity from those sources had increased to 50 million MWh and 24 million MWh, respectively, with projections that solar could reach 20% by 2050 in the U.S. mix. By the end of 2018, EIA expects an additional 5,067 MW of large-scale PV to come online, according to EIA’s Preliminary Monthly Electric Generator Inventory, with solar and storage momentum expected to accelerate. Information about planned small-scale PV systems (one megawatt and below) is not collected in that survey.


Related News

View more

Romania enhances safety at Cernavoda, IAEA reports

IAEA OSART Cernavoda highlights strengthened operational safety at Romania’s Cernavoda NPP, citing improved maintenance practices, simulator training, and deficiency reporting, with ongoing actions on spare parts procurement, procedure updates, and chemical control for nuclear compliance.


Key Points

An IAEA follow-up mission confirming improved operational safety at Cernavoda NPP, with remaining actions tracked.

✅ Enhanced simulator training and crew performance

✅ Improved field deficiency identification and reporting

✅ Ongoing upgrades to procedures, spares, and chemical control


The International Atomic Energy Agency (IAEA) said yesterday that the operator of Romania’s Cernavoda nuclear power plant had demonstrated "strengthened operational safety" by addressing the findings of an initial IAEA review in 2016. The Operational Safety Review Team (OSART) concluded a five-day follow-up mission on 8 March to the Cernavoda plant, which is on the Danube-Black Sea Canal, about 160 km from Bucharest.

The plant's two 706 MWe CANDU pressurised heavy water reactors, reflecting Canadian nuclear projects, came online in 1996 and 2007, respectively.

The OSART team was led by Fuming Jiang, a senior nuclear safety officer at the IAEA, which recently commended China's nuclear security in separate assessments.

"We saw improvements in key areas, such as the procurement of important spare parts, the identification and reporting of some deficiencies, and some maintenance work practices, as evidenced by relevant performance indicators," Jiang said, noting milestones at nuclear projects worldwide this year.

The team observed that several findings from the 2016 review had been fully addressed, including: enhanced operator crew performance during simulator training; better identification and reporting of deficiencies in the field; and improvement in maintenance work practices.

More time is required, it said, to fully implement some actions, including: further improvements in the procurement of important spare parts with relevance to safety; further enhancement in the revision and update of some operating procedures, drawing on lessons from Pickering NGS life extensions undertaken in Ontario; and control and labelling of some plant chemicals.

Dan Bigu, site vice president of Cernavoda NPP, said the 2016 mission had "proven to be very beneficial", adding that the current follow-up mission would "provide further catalyst support to our journey to nuclear excellence".

The team provided a draft report of the mission to the plant's management and a final report will be submitted to the Romanian government, which recently moved to terminate talks with a Chinese partner on a separate nuclear project, within three months.

OSART missions aim to improve operational safety by objectively assessing safety performance, even as the agency reports mines at Ukraine's Zaporizhzhia plant amid ongoing risks, using the IAEA's safety standards and proposing recommendations and suggestions for improvement where appropriate. The follow-up missions are standard components of the OSART programme and, as the IAEA has warned of risks from attacks on Ukraine's power grids, are typically conducted within two years of the initial mission.


Related News

View more

Two new electricity interconnectors planned for UK

Ofgem UK Electricity Interconnectors will channel subsea cables, linking Europe, enabling energy import/export, integrating offshore wind via multiple-purpose interconnectors, boosting grid stability, capacity, and investment under National Grid analysis to 2030 targets.


Key Points

Subsea links between the UK and Europe that trade power, integrate offshore wind, and reinforce grid capacity.

✅ Two new subsea interconnector bids open in 2025

✅ Pilot for multiple-purpose links to offshore wind clusters

✅ National Grid to assess optimal routes, capacity, and locations


Ofgem has opened bids to build two electricity interconnectors between the UK and continental Europe as part of the broader UK grid transformation now underway.

The energy regulator said this would “bring forward billions of pounds of investment” in the subsea cables, such as the Lake Erie Connector, which can import cheaper energy when needed and export surplus power from the UK when it is available.

Developers will be invited to submit bids to build the interconnectors next year. Ofgem will additionally run a pilot scheme for ‘multiple-purpose interconnectors’, which are used to link clusters of offshore wind farms and related innovations like an offshore vessel chargepoint to an interconnector.

This forms part of the UK Government drive to more than double capacity by 2030, and to manage rising electric-vehicle demand, as discussed in EV grid impacts, in support of its target of quadrupling offshore wind capacity by the same date.

Interconnectors provide some 7 per cent of UK electricity demand. The UK so far has seven electricity interconnectors linked to Ireland, France, Belgium, the Netherlands and Norway, while projects like the Ireland-France connection illustrate broader European grid integration.

Balfour Beatty won a £90m contract for onshore civil engineering works on the Viking Link Norway interconnector, which is due to come into operation in 2023, while London Gateway's all-electric berth highlights related port electrification.

It said that interconnector developers have in the past been allowed to propose their preferred design, connection location and sea route to the connecting country. Ofgem has now said it may decide to consider only those projects that meet its requirements based on an analysis of location and capacity needs by National Grid.

Ofgem has not specified that the new interconnectors must link to any specific place or country, but may do so later, as priorities like the Cyprus electricity highway illustrate emerging directions.


Related News

View more

Solar PV and wind power in the US continue to grow amid favourable government plans

US Renewable Power Outlook 2030 projects surging capacity, solar PV and wind growth, grid modernization, and favorable tax credits, detailing market trends, CAGR, transmission expansion, and policy drivers shaping clean energy generation and consumption.


Key Points

A forecast of US power capacity, generation, and consumption, highlighting solar, wind, tax credits, and grid modernization.

✅ Targets 48.4% renewable capacity share by 2030

✅ Strong growth in solar PV and onshore wind installations

✅ Investment and tax credits drive grid and transmission upgrades


GlobalData’s latest report, ‘United States Power Market Outlook to 2030, Update 2021 – Market Trends, Regulations, and Competitive Landscape’ discusses the power market structure of the United States and provides historical and forecast numbers for capacity, generation and consumption up to 2030. Detailed analysis of the country’s power market regulatory structure, competitive landscape and a list of major power plants are provided. The report also gives a snapshot of the power sector in the country on broad parameters of macroeconomics, supply security, generation infrastructure, transmission and distribution infrastructure, about a quarter of U.S. electricity from renewables in recent years, electricity import and export scenario, degree of competition, regulatory scenario, and future potential. An analysis of the deals in the country’s power sector is also included in the report.

Renewable power held a 19% share of the US’s total power capacity in 2020, and in that year renewables became the second-most prevalent source in the U.S. electricity mix by generation; this share is expected to increase significantly to 48.4% by 2030. Favourable policies introduced by the US Government will continue to drive the country’s renewable sector, particularly solar photovoltaics (PV) and wind power, with wind now the most-used renewable source in the U.S. generation mix. Installed renewable capacity* increased from 16.5GW in 2000 to 239.2GW in 2020, growing at a compound annual growth rate (CAGR) of 14.3%. By 2030, the cumulative renewable capacity is expected to rise to 884.6GW, growing at a CAGR of 14% from 2020 to 2030. Despite increase in prices of renewable equipment, such as solar modules, in 2021, the US renewable sector will show strong growth during the 2021 to 2030 period as this increase in equipment prices are short term due to supply chain disruptions caused by the Covid-19 pandemic.

The expansion of renewable power capacity during the 2000 to 2020 period has been possible due to the introduction of federal schemes, such as Production Tax Credits, Investment Tax Credits and Manufacturing Tax Credits. These have massively aided renewable installations by bringing down the cost of renewable power generation and making it at par with power generated from conventional sources. Over the last few years, the cost of solar PV and wind power installations has declined sharply, and by 2023 wind, solar, and batteries made up most of the utility-scale pipeline across the US, highlighting investor confidence. Since 2010, the cost of utility-scale solar PV projects decreased by around 82% while onshore wind installations decreased by around 39%. This has supported the rapid expansion of the renewable market. However, the price of solar equipment has risen due to an increase in raw material prices and supply shortages. This may slightly delay the financing of some solar projects that are already in the pipeline.

The US will continue to add significant renewable capacity additions during the forecast period as industry outlooks point to record solar and storage installations over the coming years, to meet its target of reaching 80% clean energy by 2030. In November 2021, President Biden signed a $1tr Infrastructure Bill, within which $73bn is designated to renewables. This includes not just renewable capacity building, but also strengthening the country’s power grid and laying new high voltage transmission lines, both of which will be key to driving solar and wind power capacity additions as wind power surges in the U.S. electricity mix nationwide.

The US was one of the worst hit countries in the world due to the Covid-19 pandemic in 2020. With respect to the power sector, the electricity consumption in the country declined by 2.5% in 2020 as compared to 2019, even as renewable electricity surpassed coal in 2022 in the generation mix, highlighting continued structural change. Power plants that were under construction faced delays due to unavailability of components due to supply chain disruptions and unavailability of labour due to travel restrictions.

According to the US Energy Information Administration, 61 power projects, having a total capacity of 2.4GWm which were under construction during March and April 2020 were delayed because of the Covid-19 pandemic. Among renewable power technologies, solar PV and wind power projects were the most badly affected due to the pandemic.

In March and April 2020, 53 solar PV projects, having a total capacity of 1.3GW, and wind power projects, having a total capacity of 1.2GW, were delayed due to the Covid-19 pandemic. Moreover, several states suspended renewable energy auctions due to the pandemic.

For instance, New York State Energy Research and Development Authority (NYSERDA) had issued a new offshore wind solicitation for 1GW and up to 2.5GW in April 2020, but this was suspended due to the Covid-19 pandemic. In July 2020, the authority relaunched the tender for 2.5GW of offshore wind capacity, with a submission deadline in October 2020.

To ease the financial burden on consumers during the pandemic, more than 1,000 utilities in the country announced disconnection moratoria and implemented flexible payment plans. Duke Energy, American Electric Power, Dominion Power and Southern California Edison were among the major utilities that voluntarily suspended disconnections.


Related News

View more

Sign Up for Electricity Forum’s Newsletter

Stay informed with our FREE Newsletter — get the latest news, breakthrough technologies, and expert insights, delivered straight to your inbox.

Electricity Today T&D Magazine Subscribe for FREE

Stay informed with the latest T&D policies and technologies.
  • Timely insights from industry experts
  • Practical solutions T&D engineers
  • Free access to every issue

Live Online & In-person Group Training

Advantages To Instructor-Led Training – Instructor-Led Course, Customized Training, Multiple Locations, Economical, CEU Credits, Course Discounts.

Request For Quotation

Whether you would prefer Live Online or In-Person instruction, our electrical training courses can be tailored to meet your company's specific requirements and delivered to your employees in one location or at various locations.