China Solar Grid Parity signals unsubsidized industrial and commercial PV, rooftop solar, and feed-in tariff guarantees competing with grid electricity and coal power prices, driven by cost declines, policy reform, and technology advances.
Key Points
Point where PV in China meets or beats grid electricity, enabling unsubsidized industrial and commercial solar.
✅ City-level analysis shows cheaper PV than grid in 344 cities.
✅ 22% can beat coal power prices without subsidies.
✅ Soft-cost, permitting, and finance reforms speed uptake.
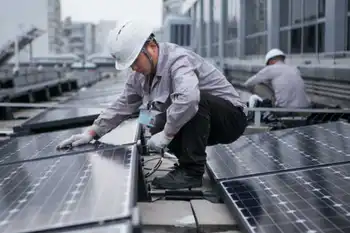
Solar power has become cheaper than grid electricity across China, a development that could boost the prospects of industrial and commercial solar, according to a new study.
Projects in every city analysed by the researchers could be built today without subsidy, at lower prices than those supplied by the grid, and around a fifth could also compete with the nation’s coal electricity prices.
They say grid parity – the “tipping point” at which solar generation costs the same as electricity from the grid – represents a key stage in the expansion of renewable energy sources.
While previous studies of nations such as Germany, where solar-plus-storage costs are already undercutting conventional power, and the US have concluded that solar could achieve grid parity by 2020 in most developed countries, some have suggested China would have to wait decades.
However, the new paper published in Nature Energy concludes a combination of technological advances, cost declines and government support has helped make grid parity a reality in Chinese today.
Despite these results, grid parity may not drive a surge in the uptake of solar, a leading analyst tells Carbon Brief.
Competitive pricing
China’s solar industry has rapidly expanded from a small, rural program in the 1990s to the largest in the world, with record 2016 solar growth underscoring the trend. It is both the biggest generator of solar power and the biggest installer of solar panels.
The installed capacity of solar panels in China in 2018 amounted to more than a third of the global total, with the country accounting for half the world’s solar additions that year.
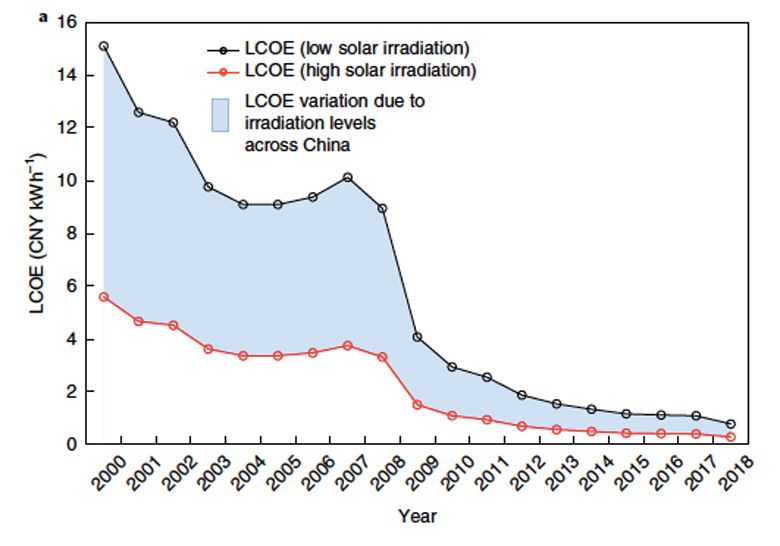
Since 2000, the Chinese government has unveiled over 100 policies supporting the PV industry, and technological progress has helped make solar power less expensive. This has led to the cost of electricity from solar power dropping, as demonstrated in the chart below.
In their paper, Prof Jinyue Yan of Sweden’s Royal Institute of Technology and his colleagues explain that this “stunning” performance has been accelerated by government subsidies, but has also seen China overinvesting in what some describe as a clean energy's dirty secret of “redundant construction and overcapacity”. The authors write:
“Recently, the Chinese government has been trying to lead the PV industry onto a more sustainable and efficient development track by tightening incentive policies with China’s 531 New Policy.”
The researchers say the subsidy cuts under this policy in 2018 were a signal that the government wanted to make the industry less dependent on state support and shift its focus from scale to quality.
This, they say, has “brought the industry to a crossroads”, with discussions taking place in China about when solar electricity generation could achieve grid parity.
In their analysis, Yan and his team examined the prospects for building industrial and commercial solar projects without state support in 344 cities across China, attempting to gauge where or whether grid parity could be achieved.
The team estimated the total lifetime price of solar energy systems in all of these cities, taking into account net costs and profits, including project investments, electricity output and trading prices.
Besides establishing that installations in every city tested could supply cheaper electricity than the grid, they also compared solar to the price of coal-generated power. They found that 22% of the cities could build solar systems capable of producing electricity at cheaper prices than coal.
Embracing solar
Declining costs of solar technology, particularly crystalline silicon modules, mean the trend in China is also playing out around the world, with offshore wind cost declines reinforcing the shift. In May, the International Renewable Energy Agency (IRENA) said that by the beginning of next year, grid parity could become the global norm for the solar industry, and shifting price dynamics in Northern Europe illustrate the market impact.
Kingsmill Bond, an energy strategist at Carbon Tracker, says this is the first in-depth study he has seen looking at city-level solar costs in China, and is encouraged by this indication of solar becoming ever-more competitive, as seen in Germany's recent solar boost during the energy crisis. He tells Carbon Brief:
“The conclusion that industrial and commercial solar is cheaper than grid electricity means that the workshop of the world can embrace solar. Without subsidy and its distorting impacts, and driven by commercial gain.”
On the other hand, Jenny Chase, head of solar analysis at BloombergNEF, says the findings revealed by Yan and his team are “fairly old news” as the competitive price of rooftop solar in China has been known about for at least a year.
She notes that this does not mean there has been a huge accompanying rollout of industrial and commercial solar, and says this is partly because of the long-term thinking required for investment to be seen as worthwhile.

The lifetime of a PV system tends to be around two decades, whereas the average lifespan of a Chinese company is only around eight years, according to Chase. Furthermore, there is an even simpler explanation, as she explains to Carbon Brief:
“There’s also the fact that companies just can’t be bothered a lot of the time – there are roofs all over Europe where solar could probably save money, but people are not jumping to do it.”
According to Chase, a “much more exciting” development came earlier this year, when the Chinese government developed a policy for “subsidy-free solar”.
This involved guaranteeing the current coal-fired power price to solar plants for 20 years, creating what is essentially a low feed-in tariff and leading to what she describes as “a lot of nice, low-risk projects”.
As for the beneficial effects of grid parity, based on how things have played out in countries where it has already been achieved, Chase says it does not necessarily mean a significant uptake of solar power will follow:
“Grid parity solar is never as popular as subsidised solar, and ironically you don’t generally have a rush to build grid parity solar because you may as well wait until next year and get cheaper solar.”
Policy proposals
In their paper, Yan and his team lay out policy changes they think would help provide an economic incentive, in combination with grid parity, to encourage the uptake of solar power systems.
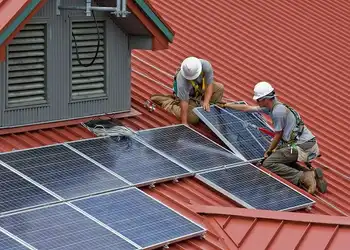
Technology costs may have fallen for smaller solar projects of the type being deployed on the rooftops of businesses, but they note that the so-called “soft costs” – including installation and maintenance – tend to be “very impactful”.
Specifically, they say aspects such as financing, land acquisition and grid accommodation, which make up over half the total cost, could be cut down:
“Labour costs are not significant [in China] because of the relatively low wages of direct labour and related installation overhead. Customer acquisition has largely been achieved in China by the mature market, with customers’ familiarity with PV systems, and with the perception that PV systems are a reliable technology. However, policymakers should consider strengthening the targeted policies on the following soft costs.”
Among the measures they suggest are new financing schemes, an effort to “streamline” the complicated procedures and taxes involved, and more geographically targeted government policies, alongside innovations like peer-to-peer energy sharing that can improve utilization.
As their analysis showed the price of solar electricity had fallen further in some cities than others, the researchers recommend targeting future subsidies at the cities that are performing less well – keeping costs to a minimum while still providing support when it is most needed.
Related News