NERC COVID-19 Grid Security Alert urges utilities to update business continuity plans, assess supply chain risk, and harden cybersecurity against spearphishing, social engineering, and remote-work vulnerabilities to protect the U.S. power grid and critical infrastructure.
Key Points
A notice urging U.S. utilities to fortify pandemic continuity, secure supply chains, and enhance cybersecurity.
✅ Mandates updates to business continuity and pandemic readiness plans
✅ Flags supply chain risks for PPE, electronics, chemicals, and logistics
✅ Warns of spearphishing, social engineering, VPN and remote-work threats
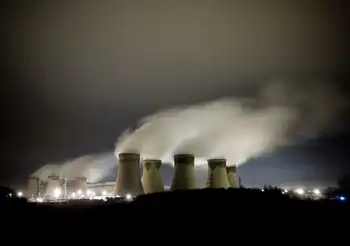
The top U.S. grid security monitor urged power utilities to prepare for the new coronavirus in a rare alert yesterday, adding to a chorus of warnings from federal and private organizations.
The North American Electric Reliability Corp. called for power providers to update business continuity plans in case of a pandemic outbreak and weigh the need to prioritize construction or maintenance projects, including updates on major projects like BC Hydro's Site C, while the COVID-19 virus continues to spread.
NERC is requiring electric utilities to answer questions on their readiness for a possible pandemic, including potential staffing strategies such as on-site sequestering, by March 20, an unusual step that underscores the severity of the threat to U.S. power systems.
The Electricity Information Sharing and Analysis Center, NERC's hub for getting the word out on dangers and vulnerabilities for the grid, also sent out an "all-points bulletin" on Feb. 5 addressing the coronavirus outbreak. That nonpublic document covered "potential supply chain issues stemming from a manufacturing slowdown in Asia," NERC spokeswoman Kimberly Mielcarek said.
Among offering basic hygiene and awareness recommendations, NERC's latest alert also encourages utilities to take stock of resources with supply chains affected by the virus. Because "China and nearby southeast Asian nations" have been impacted, NERC said, the supply chain hits will likely include "electronics, personal protective equipment and sanitation supplies, chemicals, and raw materials." The nonprofit grid overseer also warned of global transportation disruptions.
NERC also recommended utilities be on the lookout for cyberattacks taking advantage of the panic and using "coronavirus-themed opportunistic social engineering attacks" to hack into power companies' networks. Social engineering attacks are when hackers use social interactions to manipulate targets into giving up sensitive information.
"Spearphishing, watering hole, and other disinformation tactics are commonly used to exploit public interest in significant events," the alert said.
Electric utility representatives said they're working on or have already completed some of the steps outlined in NERC's alert, though nuclear plant workers have cited a lack of precautions in some cases.
"At this point, many of our members are activating and/or reviewing their business continuity and preparedness plans to ensure that operations and infrastructure are properly supported," said Tobias Sellier, director of media relations for the American Public Power Association, which represents around 1,400 electric utilities.
The power providers are also collaborating with other utilities such as "water, wastewater and gas," Sellier said.
Stephen Bell, senior director of media and public relations at the National Rural Electric Cooperative Association, said his group's members "have already taken a number of steps recommended by NERC" while continuing to maintain operations.
"Co-ops continue working with local, state and federal stakeholders to remain vigilant and prepared. These preparations include more frequent communications to key stakeholders, updating business continuity plans and monitoring new information from public health officials," said Bell.
Last week the Electricity Subsector Coordinating Council (ESCC), a panel of government and industry officials charged with responding to power-sector emergencies, scheduled a conference call discussing how to protect the grid from disruption if the virus infects system operators. Ohio-based utility American Electric Power Co. said it is limiting public visits, has created a high-level response team and is working to ensure operations can continue, while reinforcing downed power line safety, if the virus keeps spreading (Energywire, March 6).
Scott Aaronson, vice president for security and preparedness of the Edison Electric Institute, which represents major investor-owned utilities, said that the electric sector practices "contingency planning" to deal with unusual situations such as the coronavirus. That means that while the type of emergency may be new, dealing with an emergency situation is not, he said. Aaronson added that many of NERC's recommendations are based on what companies are already doing.
"We have heightened awareness given the circumstances, and we have messaging to employees all the way up and down the chain — from CEOs to frontline workers — that: given this time of heightened awareness and potential vulnerability, we have to practice hygiene both of the personal and cyber variety," said Aaronson.
Aaronson said that the ESCC had another call this week with the departments of Energy and Homeland Security and the Centers for Disease Control and Prevention to stay on top of the issue.
Hacking concerns
In a cybersecurity event yesterday, Lisa Monaco, co-chair of the Aspen Cybersecurity Group and former homeland security adviser during the Obama administration, warned that the coronavirus should be considered a national security threat.
"Frankly, [pandemic] is the thing that kept me up at night amongst many, many things that kept me up at night for four years in the White House," Monaco said.
Monaco went on to say the virus will strain organizations' IT infrastructure as more employees work remotely and households face higher electricity bills, and lead to "potentially more vulnerabilities for bad actors when it comes to cybersecurity."
On Friday, the DHS's Cybersecurity and Infrastructure Security Agency released advice on steps that can be taken to lessen the virus's impact on supply chains and cybersecurity, as well as tips for defending against scams exploiting coronavirus fears.
Cybersecurity firms also have been reporting a dramatic increase in spear-phishing attacks, with hackers reportedly using the coronavirus topic as a lure to trick victims into clicking a malicious link. Whether it's hackers aiming at industries susceptible to shipping disruptions, attacking countries like Italy hit particularly hard by the virus or even masquerading as the World Health Organization, cybercriminals are taking full advantage of the crisis, experts say.
Greg Young, vice president of cybersecurity at Trend Micro, said businesses should continue to expect an increase in targeted phishing attacks.
"With a large majority of businesses switching to a work-from-home model and less emphasis on in-person meetings, we also anticipate that malicious actors will start to impersonate digital tools such as 'free' remote conferencing services and other cloud computing software," said Young.
Working from home can be especially risky, as often home networks are less secure than corporate offices, Young said — meaning a hacker aiming to get into an enterprise network could find an "easier attack path" from a home office.
The Department of Energy is asking employees to make sure they can work remotely when needed, even as some agencies set limits with EPA telework policy, including updating security questions and asking those with government-furnished laptops to be sure they have a VPN, or virtual private network, account. In a post added this week to the agency's website, Chief Information Officer Rocky Campione said the department over the next two weeks will be initiating steps to ensure there is adequate network capacity to carry out DOE's work.
"Ensuring the continued operations of the department's many varied missions requires diligence," Campione said.
Related News