
CSA Z462 Arc Flash Training – Electrical Safety Compliance Course
Our customized live online or in‑person group training can be delivered to your staff at your location.

- Live Online
- 6 hours Instructor-led
- Group Training Available
Regular Price:
$249
Coupon Price:
$199
NEW YORK
—
Electric Vehicle Charging Costs and Times explain kWh usage, electricity rates, Level 2 vs DC fast charging, per-mile expense, and tax credits, with examples by region and battery size to estimate home and public charging.
What's Behind the News
They measure EV charging price and duration based on kWh rates, charger level, efficiency, and location.
Costs vary by kWh price, region, and charger type.
Efficiency (mi/kWh) sets per-mile cost and range.
Tax credits and utility rates impact total ownership.
More and more car manufacturing companies dip their toes in the world of electric vehicles every year, making it a good time to buy an EV for many shoppers, and the U.S. government is also offering incentives to turn the tides on car purchasing. Electric vehicles bought between 2010 and 2022 may be eligible for a tax credit of up to $7,500.
And according to the Consumer Reports analysis on long-term ownership, the cost of charging an electric vehicle is almost always cheaper than fueling a gas-powered car – sometimes by hundreds of dollars.
But that depends on the type of car and where in the country you live, in a market many expect to be mainstream within a decade across the U.S. Here's everything you need to know.
How much does it cost to charge an electric car?
An electric vehicle’s fuel efficiency can be measured in kilowatt-hours per 100 miles, and common charging-efficiency myths have been fact-checked to correct math errors.
For example, if electricity costs 10.7 cents per kilowatt-hour, charging a 200-mile range 54-kWh battery would cost about $6. Charging a vehicle that consumes 27 kWh to travel 100 miles would cost three cents a mile.
The national average cost of electricity is 10 cents per kWh and 11.7 cents per kWh for residential use. Idaho National Laboratory’s Advanced Vehicle Testing compares the energy cost per mile for electric-powered and gasoline-fueled vehicles.
For example, at 10 cents per kWh, an electric vehicle with an efficiency of 3 miles per kWh would cost about 3.3 cents per mile. The gasoline equivalent cost for this electricity cost would be just under $2.60 per gallon.
Prices vary by location as well. For example, Consumer Report found that West Coast electric vehicles tend to be less expensive to operate than gas-powered or hybrid cars, and are often better for the planet depending on local energy mix, but gas prices are often lower than electricity in New England.
Public charging networks in California cost about 30 cents per kWh for Level 2 and 40 cents per kWh for DCFC. Here’s an example of the cost breakdown using a Nissan LEAF with a 150-mile range and 40-kWh battery:
Level 2, empty to full charge: $12
DCFC, empty to full charge: $16
Many cars also offer complimentary charging for the first few years of ownership or provide credits to use for free charging. You can check the full estimated cost using the Department of Energy’s Vehicle Cost Calculator as the grid prepares for an American EV boom in the years ahead.
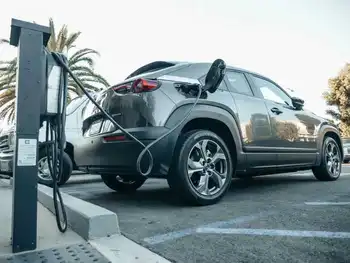
How long does it take to charge an electric car?
This depends on the type of charger you're using. Charging with a Level 1 charger takes much longer to reach full battery than a level 2 charger or a DCFC, or Direct Current Fast Charger. Here's how much time you can expect to spend charging your electric vehicle:
Related News
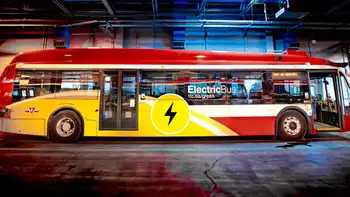
What cities can learn from the biggest battery-powered electric bus fleet in North America
Canadian Electric Bus Fleet leads North America as Toronto's TTC deploys 59 battery-electric, zero-emission buses,…
View more

The Single Biggest Threat To The Electric Vehicle Boom
EV Boom Aftershock highlights electric vehicles straining grid capacity as policy accelerates adoption, requiring charging…
View more
Is it finally time to buy an electric car?
Electric Vehicles deliver longer range, faster charging, and broader price options, with incentives and lease…
View more

Biden's Climate Bet Rests on Enacting a Clean Electricity Standard
Clean Electricity Standard drives Biden's infrastructure, grid decarbonization, and utility mandates, leveraging EPA regulation, renewables,…
View more

Olympus to Use 100% Renewable Electricity
Olympus Renewable Energy Initiative reduces CO2 emissions by sourcing 100% clean electricity at major Japan…
View more
Tesla prepares to bring its electric cars to South America
Tesla Chile Market Entry signals EV expansion into South America, with a Santiago country manager,…
View more
Sign Up for Electricity Forum’s Newsletter
Stay informed with our FREE Newsletter — get the latest news, breakthrough technologies, and expert insights, delivered straight to your inbox.
Electricity Today T&D Magazine Subscribe for FREE

Stay informed with the latest T&D policies and technologies.
- Timely insights from industry experts
- Practical solutions T&D engineers
- Free access to every issue
