Ontario Electricity Policy debates rates, subsidies, renewables, nuclear baseload, and Quebec hydro imports, highlighting grid transmission limits, community consultation, conservation, and the province's energy mix after cancelled wind projects and rising costs to taxpayers.
Key Points
Ontario Electricity Policy guides rates, generation, grid planning, subsidies and imports for reliable, low-cost power.
✅ Focuses on rates, subsidies, and consumer affordability
✅ Balances nuclear baseload, renewables, and Quebec hydro imports
✅ Emphasizes grid transmission, consultation, and conservation
When Kathleen Wynne’s Liberals went down to defeat at the hands of Doug Ford and the Progressive Conservatives, Ontario electricity had a lot to do with it. That was in 2018. Now, two years later, Ford’s government has electricity issues of its own, including a new stance on wind power that continues to draw scrutiny.
Electricity is politically fraught in Ontario. It’s among the most expensive in Canada. And it has been mismanaged at least as far back as nuclear energy cost overruns starting in the 1980s.
From the start Wynne’s government was tainted by the gas plant scandal of her predecessor Dalton McGuinty and then she created her own with the botched roll-out of her green energy plan. And that helped Ford get elected promising to lower electricity prices. But, rates haven’t gone down under Ford while the cost to the government coffers for subsidizing them have soared - now costing $5.6 billion a year.
Meanwhile, Ford’s government has spent at least $230 million to tear up green energy contracts signed by the former Liberal government, including two wind-farm projects that were already mid-construction.
Lessons learned?
In the final part of a three-part series, the six candidates vying to become the next leader of the Ontario Liberals discuss the province's electricity system, including the lessons learned from the prior Liberal government's botched attempts to fix it that led to widespread local opposition to a string of wind power projects, and whether they'd agree to import more hydroelectricity from Quebec.
“We had the right idea but didn’t stick the landing,” said Steven Del Duca, a member of the former Wynne government who lost his Vaughan-area seat in 2018, referring to its green-energy plan. “We need to make sure that we work more collaboratively with local communities to gain the buy-in needed to be successful in this regard.”
“Consultation and listening is key,” agreed Mitzie Hunter, who was education minister under Kathleen Wynne and in 2018 retained her seat in the legislature representing Scarborough-Guildwood. “We must seek input from community members about investments locally,” she said. “Inviting experts in to advise on major policy is also important to make evidence-based decisions."
Michael Coteau, MPP for Don Valley East and the third leadership candidate who was a member of the former government, called for “a new relationship of respect and collaboration with municipalities.”
He said there is an “important balance to be achieved between pursuing province wide objectives for green-energy initiatives and recognizing and reflecting unique local conditions and circumstances.”
Kate Graham, who has worked in municipal public service and has not held a provincial public office, said that experts and local communities are best placed to shape decisions in the sector.
In the final part of a three-part series, Ontario's Liberal leadership contenders discuss electricity, lessons learned from the bungled rollout of previous Liberal green policy, and whether to lean more on Quebec's hydroelectricity.
“What's gotten Ontario in trouble in the past is when Queen's Park politicians are the ones micromanaging the electricity file,” she said.
“Community consultation is vitally important to the long-term success of infrastructure projects,” said Alvin Tedjo, a former policy adviser to Liberal ministers Brad Duguid and Glen Murray.
“Community voices must be heard and listened to when large-scale energy programs are going to be implemented,” agreed Brenda Hollingsworth, a personal injury lawyer making her first foray into politics.
Of the six candidates, only Coteau went beyond reflection to suggest a path forward, saying he would review the distribution of responsibilities between the province and municipalities, with the aim of empowering cities and towns.
Turn back to Quebec?
Ford’s government has also turned away from a deal signed in 2016 to import hydroelectricity from Quebec.
Graham and Hunter both said they would consider increasing such imports. Hunter noted that the deal, which would displace domestic natural gas production, will lower the cost of electricity paid by Ontario ratepayers by a net total of $38 million from 2017 to 2023, according to the province’s fiscal watchdog.
“I am open to working with our neighbouring province,” Hunter said. “This is especially important as we seek to bring electricity to remote northern, on-reserve Indigenous communities.”
Tedjo said he has no issues with importing clean energy as long as it’s at a fair price.
Hollingsworth and Coteau both said they would withhold judgment until they could see the province’s capacity status in 2022.
“In evaluating the case for increasing importation of water power from Quebec, we must realistically assess the limitations of the existing transmission system and the cost and time required to scale up transmission infrastructure, among other factors,” Coteau said.
Del Duca also took a wait-and-see approach. “This will depend on our energy needs and energy mix,” he said. “I want to see our energy needs go down; we need more efficiency and better conservation to make that happen.”
What's the right energy mix?
Nuclear energy currently accounts for about a third of Ontario’s energy-producing capacity, even as Canada explores zero-emissions electricity by 2035 pathways. But it actually supplies about 60 percent of Ontario’s electricity. That is because nuclear reactors are always on, producing so-called baseload power.
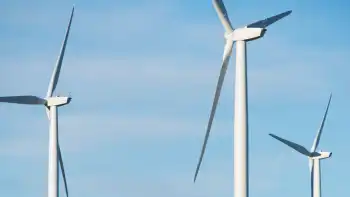
Hydroelectricity provides another 25 percent of supply, while oil and natural gas contribute 6 per cent and wind adds 7 percent. Both solar and biofuels account for less than one percent of Ontario’s energy supply. However, a much larger amount of solar is not counted in this tally, as it is used at or near the sites where it is generated, and never enters the transmission system.
Asked for their views on how large a role various sources of power should play in Ontario’s electricity mix in the future, the candidates largely backed the idea of renewable energy, but offered little specifics.
Graham repeated her statement that experts and communities should drive that conversation. Tedjo said all non-polluting technologies should play a role in Ontario’s energy mix, as provinces like Alberta demonstrate parallel growth in green energy and fossil fuels. Coteau said we need a mix of renewable-energy sources, without offering specifics.
“We also need to pursue carbon capture and sequestration, working in particular with our farming communities,” he added.
Related News