U.S. Power Grid D+ Rating underscores aging infrastructure, rising outages, cyber threats, EMP and solar flare risks, strained transmission lines, vulnerable transformers, and slow permitting, amplifying reliability concerns and resilience needs across national energy systems.
Key Points
ASCE's D+ grade flags aging infrastructure, rising outages, and cyber, EMP, and weather risks needing investment.
✅ Major outages rising; weather remains top disruption driver.
✅ Aging transformers, transmission lines, limited maintenance.
✅ Cybersecurity gaps via smart grid, EV charging, SCADA.
The U.S. power grid just received its “grade card” from the American Society of Civil Engineers (ASCE) and it barely passed.
The overall rating of our antiquated electrical system was a D+. Major power outages in the United States, including widespread blackouts, have grown from 76 in 2007 to 307 in 2011, according to the latest available statistics. The major outage figures do not take into account all of the smaller outages which routinely occur due to seasonal storms.
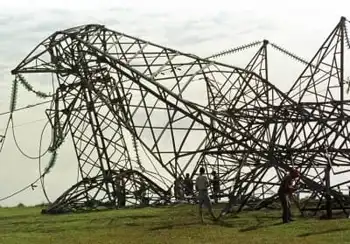
The American Society of Civil Engineers power grid grade card rating means the energy infrastructure is in “poor to fair condition and mostly below standard, with many elements approaching the end of their service life.” It further means a “large portion of the system exhibits significant deterioration” with a “strong risk of failure.”
Such a designation is not reassuring and validates those who purchased solar generators over the past several years.
#google#
The vulnerable state of the power grid gets very little play by mainstream media outlets. Concerns about a solar flare or an electromagnetic pulse (EMP) attack instantly sending us back to an 1800s existence are legitimate, but it may not take such an extreme act to render the power grid a useless tangle of wires. The majority of the United States’ infrastructure and public systems evaluated by the ASCE earned a “D” rating. A “C” ranking (public parks, rail and bridges) was the highest grade earned. It would take a total of $3.6 trillion in investments by 2020 to fix everything, the report card stated. To put that number in perspective, the federal government’s budget for all of 2012 was slightly more, $3.7 trillion.
“America relies on an aging electrical grid and pipeline distribution systems, some of which originated in the 1880s,” the report read. “Investment in power transmission has increased since 2005, but ongoing permitting issues, weather events, including summer blackouts that strain local systems, and limited maintenance have contributed to an increasing number of failures and power interruptions. While demand for electricity has remained level, the availability of energy in the form of electricity, natural gas, and oil will become a greater challenge after 2020 as the population increases. Although about 17,000 miles of additional high-voltage transmission lines and significant oil and gas pipelines are planned over the next five years, permitting and siting issues threaten their completion. The electric grid in the United States consists of a system of interconnected power generation, transmission facilities, and distribution facilities.”
Harness the power of the sun when the power goes out…
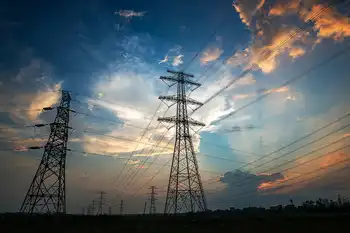
There are approximately 400,000 miles of electrical transmission lines throughout the United States, and thousands of power generating plants dot the landscape. The ASCE report card also stated that new gas-fired and renewable generation issues increase the need to add new transmission lines. Antiquated power grid equipment has reportedly prompted even more “intermittent” power outages in recent years.
The American Society of Civil Engineers accurately notes that the power grid is more vulnerable to cyber attacks than ever before, including Russian intrusions documented in recent years, and it cites the aging electrical system as the primary culprit. Although the decades-old transformers and other equipment necessary to keep power flowing around America are a major factor in the enhanced vulnerability of the power grid, moving towards a “smart grid” system is not the answer. As previously reported by Off The Grid News, smart grid systems and even electric car charging stations make the power grid more accessible to cyber hackers. During the Hack in the Box Conference in Amsterdam, HP ArcSight Product Manager Ofer Sheaf stated that electric car charging stations are in essence a computer on the street. The roadway fueling stations are linked to the power grid electrical system. If cyber hackers garner access to the power grid via the charging stations, they could stop the flow of power to a specific area or alter energy distribution levels and overload the system.
While a relatively small number of electric car charging stations exist in America now, that soon will change. Ongoing efforts by both federal and state governments to reduce our reliance on fossil fuels have resulted in grants and privately funded vehicle charging station projects. New York Governor Andrew Cuomo in April announced plans to build 360 such electrical stations in his state. A total of 3,000 car charging stations are in the works statewide and are slated for completion over the next five years.
SHIELD ActWeather-related events were the primary cause of power outages from 2007 to 2012, according to the infrastructure report card. Power grid reliability issues are emerging as the greatest threat to the electrical system, with rising attacks on substations compounding the risks. The ASCE grade card also notes that retiring and rotating in “new energy sources” is a “complex” process. Like most items we routinely purchase in our daily lives, many of the components needed to make the power grid functional are not manufactured in the United States.
The SHIELD Act is the first real piece of federal legislation in years drafted to address power grid vulnerabilities. While the single bill will not fix all of the electrical system issues, it is a big step in the right direction – if it ever makes it out of committee. Replacing aging transformers, encasing them in a high-tech version of a Faraday cage, and stockpiling extra units so instant repairs are possible would help preserve one of the nation’s most critical and life-saving pieces of infrastructure after a weather-related incident or man-made disaster.
“Geomagnetic storm environments can develop instantaneously over large geographic footprints,” solar geomagnetic researcher John Kappenman said about the fragile state of the power grid. He was quoted in an Oak Ridge National Laboratory report. “They have the ability to essentially blanket the continent with an intense threat environment and … produce significant collateral damage to critical infrastructures. In contrast to well-conceived design standards that have been successfully applied for more conventional threats, no comprehensive design criteria have ever been considered to check the impact of the geomagnetic storm environments. The design actions that have occurred over many decades have greatly escalated the dangers posed by these storm threats for this critical infrastructure.”
The power grid has morphed in size tenfold during the past 50 years. While solar flares, cyber attacks, and an EMP are perhaps the most extensive and frightening threats to the electrical system, the infrastructure could just as easily fail in large portions due to weather-related events exacerbated by climate change across regions. The power grid is basically a ticking time bomb which will spawn civil unrest, lack of food, clean water, and a multitude of fires if it does go down.
Related News