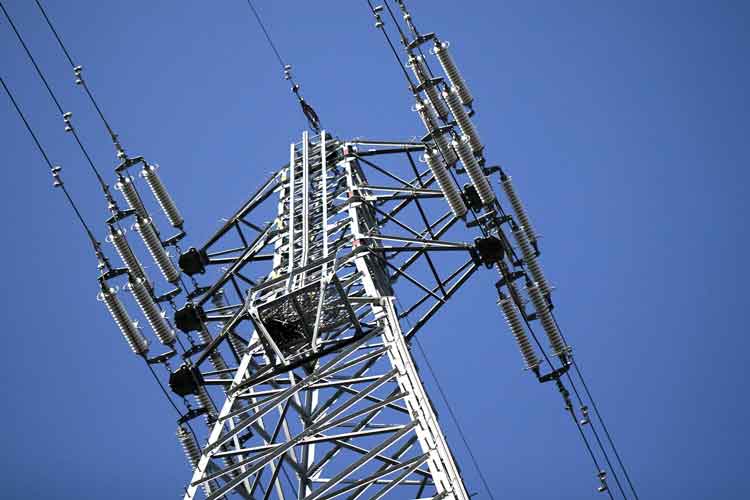
Electrifying GO train system to be studied

By Toronto Star


CSA Z463 Electrical Maintenance

Our customized live online or in‑person group training can be delivered to your staff at your location.

  • Live Online
  • 6 hours Instructor-led
  • Group Training Available
Regular Price:
$249
Coupon Price:
$199
Reserve Your Seat Today
Metrolinx will mount an unprecedented study of electrifying the entire GO train system, including the controversial Georgetown line.

Expected to cost more than $2 million, the study is the most comprehensive in GO's history, say transit officials, who are under pressure from the community concerned about diesel pollution to electrify the Georgetown line, due for a $1 billion expansion. The expansion is necessary for GO to offer two-way, all-day service to Brampton and Georgetown and to run a rail link between Union Station and Pearson airport.

This will be the first broad look at the health and community impacts, as well as the economics of electrification, Metrolinx officials said at a board meeting. Earlier studies examined electrifying the Lakeshore line only and focused on the cost of electric versus diesel.

This latest study will also consider alternative rail technologies.

But whether electric trains or clean diesel locomotives run up the expanded Georgetown corridor, it will be years before commuters in Brampton and Georgetown see all-day, two-way service, said Gary McNeil, managing director of GO, which has merged with Metrolinx.

Despite a Metrolinx report projecting 59 GO trains running up the corridor to Georgetown in 2015 when the expansion opens, McNeil said only 10 additional trains might be added to the existing 19.

About 460 trains are expected to use the lower ends of the corridor when expansion is complete, including about 140 that will provide a rail link between Union Station and Pearson, and those that branch off to Bolton, Barrie and Milton.

The study, to be finished next December, is critical for GO to make the business case for electrification in the future, which transit officials have been looking at for 30 years on the Lakeshore line, said McNeil.

Many Toronto residents living along the Georgetown line tracks say the study is a waste of time and money. A 2009 GO analysis showed it would cost about $1 billion to electrify the Lakeshore line.

But that outlay would be offset by $100 million in annual operational savings, said Keith Brooks of the Clean Train Coalition, which opposes diesel trains on the Georgetown line.

"That study clearly indicated this is the best economic case, not to mention all the environmental and health impacts," he said.

Related News

EV Sales Still Behind Gas Cars

U.S. EV and Hybrid Sales 2024 show slower adoption versus gas-powered cars, as charging infrastructure gaps, range anxiety, higher upfront costs, and affordability concerns persist despite incentives, battery tech advances, and expanding fast-charging networks.


Key Points

They represent 10-15% of U.S. car sales, lagging gas models due to costs, charging gaps, range anxiety, and access.

✅ 10-15% of U.S. auto sales; gas cars dominate

✅ Barriers: upfront cost, limited charging, range anxiety

✅ Incentives, battery tech, and networks may boost adoption


Sales of hybrid and electric vehicles (EVs) in the U.S. are continuing to trail behind traditional gas-powered vehicles in 2024, despite significant advancements in automotive technology and growing public awareness of environmental concerns. While the electric vehicle market has seen steady growth and recent sales momentum over the past few years, the gap between EVs and gasoline-powered cars remains wide.

In 2024, hybrid and electric vehicles are projected to account for roughly 10-15% of total car sales in the U.S., a figure that, though significant, still lags far behind the sales of gas-powered vehicles and follows a Q1 2024 EV market share dip in the U.S., according to recent data. Analysts point to several factors contributing to this slower adoption rate, including higher upfront costs, limited charging infrastructure, and consumer concerns over range anxiety. Additionally, while EVs and hybrids offer lower lifetime operating costs, the initial price difference remains a hurdle for many prospective buyers.

One of the key challenges for EV sales continues to be the perception of cost, even as analyses show they can be better for the planet and often your budget over time. While federal and state incentives have made EVs more affordable, especially for lower-income buyers, the price tag for many electric models remains steep, particularly for higher-end vehicles. Even with government rebates, EVs can still be priced higher than their gasoline counterparts, making them less accessible for middle-class consumers. Many potential buyers are also hesitant to make the switch, unsure if the long-term savings will outweigh the initial investment.

Another critical factor is the limited charging infrastructure in many parts of the country. Though major cities have seen significant improvements in charging stations, rural areas and smaller towns still lack the necessary infrastructure to support widespread EV use. This uneven distribution of charging stations leads to concerns about being stranded in areas without access to fast-charging options. While automakers are working on expanding charging networks, the pace of this development is slow, and EVs won't go mainstream until key problems are fixed according to industry leaders.

Range anxiety is also a continuing issue, despite improvements in battery technology. Though newer electric vehicles can go further on a single charge than ever before, the range of many EVs still doesn't meet the expectations of some drivers, particularly those who regularly take long road trips or live in rural areas. The longer charging times and the necessity of planning routes around charging stations add to the hesitation, especially when gasoline-powered vehicles provide greater convenience and flexibility.

The shift toward EVs is further hindered by the continued dominance of gas-powered cars in the market. Gasoline vehicles benefit from decades of development, an extensive fueling infrastructure, and familiarity with the technology. For many consumers, the convenience, affordability, and ease of use of gas-powered vehicles still outweigh the benefits of switching to an electric alternative. Additionally, with fluctuating fuel prices, many drivers continue to find gas-powered cars relatively cost-effective in terms of daily commuting, especially when compared to the current costs of EV ownership.

Despite these challenges, there is hope for a future shift. The federal government’s push for stricter emissions regulations and tax incentives continues to fuel growth in the electric vehicle market. As automakers ramp up production and more affordable options become available, EV sales are expected to increase in the coming years. Companies like Tesla, Ford, whose hybrids are getting a boost, and General Motors are leading the charge, while new manufacturers like Rivian and Lucid Motors are offering alternatives to traditional gasoline vehicles.

Furthermore, the development of new technologies, such as solid-state batteries and faster charging systems, could help alleviate some of the current drawbacks of electric vehicles. If these advancements reach mass-market production in the next few years, they could help make EVs a more attractive and practical option for consumers, aligning with within-a-decade adoption forecasts from some industry observers.

In conclusion, while hybrid and electric vehicles are growing in popularity, gas-powered vehicles continue to dominate the U.S. car market in 2024. Challenges such as high upfront costs, limited charging infrastructure, and concerns about range persist, making it difficult for many consumers to make the switch to electric even as they ask if it's time to buy an EV in 2024. However, with continued investment in technology and infrastructure, the gap between EVs and gas-powered vehicles could narrow in the years to come.


Related News

View more

"It's freakishly cold": Deep freeze slams American energy sector

Texas Deep Freeze Energy Crisis strains grids as polar vortex triggers rolling blackouts, record natural gas and electricity prices, refinery shutdowns, WTI gains, and scarcity pricing across Texas, Oklahoma, SPP, and Mexico.


Key Points

A polar vortex slamming Texas energy: outages, record power prices, gas spikes, and reduced oil output.

✅ Record gas trades near $500/mmBtu; power hits $6,000/MWh

✅ WTI tops $60 as Texas shuts in ~1 million bpd

✅ Rolling blackouts across SPP; ERCOT scarcity pricing


A deep freeze is roiling electricity markets in more than a dozen U.S. states, leading to record-setting prices for electricity and natural gas, knocking oil production off line and shutting down some of North America’s largest refineries.

“It’s freakishly cold,” said Eric Fell, a senior natural gas analyst with Wood Mackenzie in Houston, where record cold temperatures and snow have blanketed the city, caused rolling power outages, shut down refineries and sent both natural gas and electricity prices soaring.

'It’s freakishly cold': Deep freeze slams North American energy sector

The polar vortex has led to freezing temperatures in every county in Texas, the largest energy-producing state in the U.S., and caused massive disruptions across the North American energy complex, triggering Texas power outages as far south as Mexico.

As the plunge in temperatures forced oil companies to shut in an estimated one million barrels of oil production in Texas on Monday, the West Texas Intermediate benchmark price rose above the US$60 per barrel threshold for the first time in a year to settle up 1 per cent, or US65 cents, at US$60.12 per barrel.

President Joe Biden declared an emergency on Monday, unlocking federal assistance to Texas.

People carry groceries from a local gas station on Monday in Austin, Texas. Winter storm Uri has brought historic cold weather to Texas, causing traffic delays and power outages. 

Frozen wind farms are just a small piece of Texas’s power grid woes right now.

Fell said regional natural gas and electricity prices in Oklahoma and Texas broke U.S. records over the weekend.

On Friday, Oklahoma gas transmission prices averaged US$350 per million British thermal units and Fell said one trade went as high as US$600 per mmBtu. In parts of the Texas panhandle and elsewhere, prices jumped to US$200, “all of which individually would have been new records,” Fell said, noting the previous record was US$160.

On Monday, natural gas for physical delivery in the U.S. was trading for as much as US$500 per mmBtu as demand for the heating and power plant fuel soared.  Spot gas has been trading for hundreds of dollars across the central U.S. since Thursday with a surge in heating demand triggering widespread blackouts and sending electricity prices soaring. The fuel normally trades in the region for less than US$3 per mmBtu.

Similarly, electricity prices in Texas surged to US$6,000 per megawatt hour on Monday, as U.S. power companies grapple with supply-chain constraints, which Fell said is “100 times the normal price.”

“You’re seeing scarcity pricing in power and gas. The only thing that’s different this time is it’s staying there – it’s not just an hour or two hours, it’s the whole day,” he said.

The blast of Arctic cold, which has blanketed Canada and much of the U.S., has created a massive draw on natural gas supplies, used both for home heating and industrial uses like electricity generation.

Little Rock, Ark.-based Southwest Power Pool, which coordinates electricity distribution for parts of 14 states including Oklahoma Kansas, Nebraska and even as far north as North Dakota, announced rolling blackouts across its network on Monday as a result of the power outages.

“In our history as a grid operator, this is an unprecedented event and marks the first time SPP has ever had to call for controlled interruptions of service” SPP’s executive vice-president and chief operating officer Lanny Nickell said in a release, adding the move was “a last resort” to “prevent circumstances from getting worse.”

The frigid conditions have led to a surge in natural gas prices across the continent, including in Alberta where the AECO benchmark price jumped to a seven-year high of $6.36 per thousand cubic feet last week, a price not seen since 2014.

Energy systems in Texas and Oklahoma, which are major energy exporters to other U.S. states, are built to withstand severe heat – not extreme cold. The result is a disruption to the gas supply at exactly the time the U.S. energy system is demanding those molecules.

“Given how far south it’s gone into Texas, this is where you have a lot of gas production that isn’t properly winterized,” said Jeremy McCrea, an analyst with Raymond James covering the natural gas industry.


Related News

View more

Energy dashboard: how is electricity generated in Great Britain?

Great Britain electricity generation spans renewables and baseload: wind, solar, nuclear, gas, and biomass, supported by National Grid interconnectors, embedded energy estimates, and BMRS data for dynamic imports and exports across Europe.


Key Points

A diverse, weather-driven mix of renewables, gas, nuclear, and imports coordinated by National Grid.

✅ Baseload from nuclear and biomass; intermittent wind and solar

✅ Interconnectors trade zero carbon imports via subsea cables

✅ Data from BMRS and ESO covers embedded energy estimates


Great Britain has one of the most diverse ranges of electricity generation in Europe, with everything from windfarms off the coast of Scotland to a nuclear power station in Suffolk tasked with keeping the lights on. The increasing reliance on renewable energy sources, as part of the country’s green ambitions, also means there can be rapid shifts in the main source of electricity generation. On windy days, most electricity generation comes from record wind generation across onshore and offshore windfarms. When conditions are cold and still, gas-fired power stations known as peaking plants are called into action.

The electricity system in Great Britain relies on a combination of “baseload” power – from stable generators such as nuclear and biomass plants – and “intermittent” sources, such as wind and solar farms that need the right weather conditions to feed energy into the grid. National Grid also imports energy from overseas, through subsea cables known as interconnectors that link to France, Belgium, Norway and the Netherlands. They allow companies to trade excess power, such as renewable energy created by the sun, wind and water, between different countries. By 2030 it is hoped that 90% of the energy imported by interconnectors will be from zero carbon energy sources, though low-carbon electricity generation stalled in 2019 for the UK.

The technology behind Great Britain’s power generation has evolved significantly over the last century, and at times wind has been the main source of electricity. The first integrated national grid in the world was formed in 1935 linking seven regions of the UK. In the aftermath of industrialisation, coal provided the vast majority of power, before oil began to play an increasingly important part in the 1950s. In 1956, the world’s first commercial nuclear reactor, Calder Hall 1 at Windscale (later Sellafield), was opened by Queen Elizabeth II. Coal use fell significantly in the 1990s while the use of combined cycle gas turbines grew, and in 2016 wind generated more electricity than coal for the first time. Now a combination of gas, wind, nuclear and biomass provide the bulk of Great Britain’s energy, with smaller sources such as solar and hydroelectric power also used. From October 2024, coal will no longer be used to generate electricity, following coal-free power records set in recent years.

Energy generation data is fetched from the Balancing Mechanism Reporting Service public feed, provided by Elexon – which runs the wholesale energy market – and is updated every five minutes, covering periods when wind led the power mix as well.

Elexon’s data does not include embedded energy, which is unmetered and therefore invisible to Great Britain’s National Grid. Embedded energy comprises all solar energy and wind energy generated from non-metered turbines. To account for these figures we use embedded energy estimates from the National Grid electricity system operator, which are published every 30 minutes.

Import figures refer to the net flow of electricity from the interconnectors with Europe and with Northern Ireland. A positive value represents import into the GB transmission system, while a negative value represents an export.

Hydro figures combine renewable run-of-the-river hydropower and pumped storage.

Biomass figures include Elexon’s “other” category, which comprises coal-to-biomass conversions and biomass combined heat and power plants.


Related News

View more

Ireland and France will connect their electricity grids - here's how

Celtic Interconnector, a subsea electricity link between Ireland and France, connects EU grids via a high-voltage submarine cable, boosting security of supply, renewable integration, and cross-border trade with 700 MW capacity by 2026.


Key Points

A 700 MW subsea link between Ireland and France, boosting security, enabling trade, and supporting renewables.

✅ Approx. 600 km subsea cable from East Cork to Brittany

✅ 700 MW capacity; powers about 450,000 homes

✅ Financed by EIB, banks, CEF; Siemens Energy and Nexans


France and Ireland signed contracts on Friday to advance the Celtic Interconnector, a subsea electricity link to allow the exchange of electricity between the two EU countries. It will be the first interconnector between continental Europe and Ireland, as similar UK interconnector plans move forward in parallel. 

Representatives for Ireland’s electricity grid operator EirGrid and France’s grid operator RTE signed financial and technical agreements for the high-voltage submarine cable, mirroring developments like Maine’s approved transmission line in North America for cross-border power. The countries’ respective energy ministers witnessed the signing.

European commissioner for energy Kadri Simson said:

In the current energy market situation, marked by electricity price volatility, and the need to move away from imports of Russian fossil fuels, European energy infrastructure has become more important than ever.

The Celtic Interconnector is of paramount importance as it will end Ireland’s isolation from the Union’s power system, with parallels to Cyprus joining the electricity highway in the region, and ensure a reliable high-capacity link improving the security of electricity supply and supporting the development of renewables in both Ireland and France.

EirGrid and RTE signed €800 million ($827 million) worth of financing agreements with Barclays, BNP Paribas, Danske Bank, and the European Investment Bank, similar to the Lake Erie Connector investment that blends public and private capital.

In 2019, the project was awarded a Connecting Europe Facility (CEF) grant worth €530.7 million to support construction works and align with a broader push for electrification in Europe under climate strategies. The CEF program also provided €8.3 million for the Celtic Interconnector’s feasibility study and initial design and pre-consultation.

Siemens Energy will build converter stations in both countries, and Paris-based global cable company Nexans will design and install a 575-km-long cable for the project.

The cable will run between East Cork, on Ireland’s southern coast, and northwestern France’s Brittany coast and will connect into substations at Knockraha in Ireland and La Martyre in France.

The Celtic Interconnector, which is expected to be operational by 2026, will be approximately 600 km (373 miles) long and have a capacity of 700 MW, similar to cross-border initiatives such as Quebec-to-New York power exports expected in 2025, which is enough to power 450,000 households.


Related News

View more

35 arrested in India for stealing electricity

BEST vigilance raid on Wadala electricity theft uncovered a Mumbai power theft racket in Antop Hill and Sangam Nagar, with operators, illegal connections, sub-stations, meter cabins, FIRs, and Rs 72 lakh losses flagged by BEST.


Key Points

A BEST operation that nabbed operators stealing power via illegal connections in Wadala, exposing a Rs 72 lakh loss.

✅ 35 suspects booked; key operator identified as David Anthony.

✅ Illegal taps from sub-stations and meter cabins in shanties.

✅ BEST filed FIRs; Session court granted bail to accused.


In a raid conducted at Antop Hill in Wadala on Saturday, a total of 35 people were nabbed by the vigilance department for stealing electricity to the tune of Rs 72 lakh, in a case similar to a Montreal power-theft ring bust covered internationally.

It was the second such raid conducted in the past one week, where operators have been nabbed.The cash-strapped BEST is now tightening it's grasp on `operators' who steal electricity from BEST sources and provide it to their own customers on a meagre monthly rent, even as Ontario utilities warn about scams affecting customers elsewhere.

After receiving a tip-off about the theft of electricity in the Sangam Nagar area of Wadala, about 90 personnel of the BEST conducted a raid. After visiting the spots, it was found that illegal connections were made from the sub-station and other electricity boxes of the BEST in the area, underscoring how fragile networks can be amid disruptions such as major outages in London that affected thousands.

According to BEST officials, the residents from the area would come up to the accused, identified as David Anthony, and would pay a fixed amount at the end of every month for unlimited supply of power, a dynamic reminiscent of shutoff-threat scams flagged by Manitoba Hydro, though the circumstances differ. Anthony would with draw power directly from meter cabins and electricity boxes in the area. The wires he connected to these were in turn connected to households who made the arrangement with him. An official from BEST also explained that as soon they reach a location to conduct raids and vehicles of BEST officials are spotted by residents, most of the connections are cut off, which makes it difficult for them to prove the theft case However, on Saturday, BEST officials managed to conduct the raid swiftly and nab 35 people.

All who had illegal connections were named in the complaint and an FIR was registered against them, including Anthony, who himself had illegal connections in his house. They were produced in Session court and given bail, while utilities in other regions resort to hydro disconnections during arrears season. Chief Vigilance Officer of BEST, RJ Singh said, "Most of these are commercial establishments in these shanties, which steal electricity. It is very important to catch hold of the operators as they are the providers and we need to break their backbone."


Related News

View more

Potent greenhouse gas declines in the US, confirming success of control efforts

US SF6 Emissions Decline as NOAA analysis and EPA mitigation show progress, with atmospheric measurements and Greenhouse Gas Reporting verifying reductions from the electric power grid; sulfur hexafluoride's extreme global warming potential underscores inventory improvements.


Key Points

A documented drop in US sulfur hexafluoride emissions, confirmed by NOAA atmospheric data and EPA reporting reforms.

✅ NOAA towers and aircraft show 2007-2018 decline

✅ EPA reporting and utility mitigation narrowed inventory gaps

✅ Winter leaks and servicing signal further reduction options


A new NOAA analysis shows U.S. emissions of the super-potent greenhouse gas sulfur hexafluoride (SF6) have declined between 2007-2018, likely due to successful mitigation efforts by the Environmental Protection Agency (EPA) and the electric power industry, with attention to SF6 in the power industry across global markets. 

At the same time, significant disparities that existed previously between NOAA’s estimates, which are based on atmospheric measurements, and EPA’s estimates, which are based on a combination of reported emissions and industrial activity, have narrowed following the establishment of the EPA's Greenhouse Gas Reporting Program. The findings, published in the journal Atmospheric Chemistry and Physics, also suggest how additional emissions reductions might be achieved. 

SF6 is most commonly used as an electrical insulator in high-voltage equipment that transmits and distributes electricity, and its emissions have been increasing worldwide as electric power systems expand, even as regions hit milestones like California clean energy surpluses in recent years. Smaller amounts of SF6 are used in semiconductor manufacturing and in magnesium production. 

SF6 traps 25,000 times more heat than carbon dioxide over a 100-year time scale for equal amounts of emissions, and while CO2 emissions flatlined in 2019 globally, that comparison underscores the potency of SF6. That means a relatively small amount of the gas can have a significant impact on climate warming. Because of its extremely large global warming potential and long atmospheric lifetime, SF6 emissions will influence Earth’s climate for thousands of years.

In this study, researchers from NOAA’s Global Monitoring Laboratory, as record greenhouse gas concentrations drive demand for better data, working with colleagues at EPA, CIRES, and the University of Maryland, estimated U.S. SF6 emissions for the first time from atmospheric measurements collected at a network of tall towers and aircraft in NOAA’s Global Greenhouse Gas Reference Network. The researchers provided an estimate of SF6 emissions independent from the EPA’s estimate, which is based on reported SF6 emissions for some industrial facilities and on estimated SF6 emissions for others.

“We observed differences between our atmospheric estimates and the EPA’s activity-based estimates,” said study lead author Lei Hu, a Global Monitoring Laboratory researcher who was a CIRES scientist at the time of the study. “But by closely collaborating with the EPA, we were able to identify processes potentially responsible for a significant portion of this difference, highlighting ways to improve emission inventories and suggesting additional emission mitigation opportunities, such as forthcoming EPA carbon capture rules for power plants, in the future.” 

In the 1990s, the EPA launched voluntary partnerships with the electric power, where power-sector carbon emissions are falling as generation shifts, magnesium, and semiconductor industries to reduce SF6 emissions after the United States recognized that its emissions were significant. In 2011, large SF6 -emitting facilities were required to begin tracking and reporting their emissions under the EPA Greenhouse Gas Reporting Program. 

Hu and her colleagues documented a decline of about 60 percent in U.S. SF6 emissions between 2007-2018, amid global declines in coal-fired power in some years—equivalent to a reduction of between 6 and 20 million metric tons of CO2 emissions during that time period—likely due in part to the voluntary emission reduction partnerships and the EPA reporting requirement. A more modest declining trend has also been reported in the EPA’s national inventories submitted annually under the United Nations Framework Convention on Climate Change. 

Examining the differences between the NOAA and EPA independent estimates, the researchers found that the EPA’s past inventory analyses likely underestimated SF6 emissions from electrical power transmission and distribution facilities, and from a single SF6 production plant in Illinois. According to Hu, the research collaboration has likely improved the accuracy of the EPA inventories. The 2023 draft of the EPA’s U.S. Greenhouse Gas Emissions and Sinks: 1990-2021 used the results of this study to support revisions to its estimates of SF6 emissions from electrical transmission and distribution. 

The collaboration may also lead to improvements in the atmosphere-based estimates, helping NOAA identify how to expand or rework its network to better capture emitting industries or areas with significant emissions, according to Steve Montzka, senior scientist at GML and one of the paper’s authors.

Hu and her colleagues also found a seasonal variation in SF6 emissions from the atmosphere-based analysis, with higher emissions in winter than in summer. Industry representatives identified increased servicing of electrical power equipment in the southern states and leakage from aging brittle sealing materials in the equipment in northern states during winter as likely explanations for the enhanced wintertime emissions—findings that suggest opportunities for further emissions reductions.

“This is a great example of the future of greenhouse gas emission tracking, where inventory compilers and atmospheric scientists work together to better understand emissions and shed light on ways to further reduce them,” said Montzka.


Related News

View more

Sign Up for Electricity Forum’s Newsletter

Stay informed with our FREE Newsletter — get the latest news, breakthrough technologies, and expert insights, delivered straight to your inbox.

Electricity Today T&D Magazine Subscribe for FREE

Stay informed with the latest T&D policies and technologies.
  • Timely insights from industry experts
  • Practical solutions T&D engineers
  • Free access to every issue

Live Online & In-person Group Training

Advantages To Instructor-Led Training – Instructor-Led Course, Customized Training, Multiple Locations, Economical, CEU Credits, Course Discounts.

Request For Quotation

Whether you would prefer Live Online or In-Person instruction, our electrical training courses can be tailored to meet your company's specific requirements and delivered to your employees in one location or at various locations.