Quest for renewables pits green vs. green

By Chicago Tribune


NFPA 70e Training

Our customized live online or in‑person group training can be delivered to your staff at your location.

  • Live Online
  • 6 hours Instructor-led
  • Group Training Available
Regular Price:
$199
Coupon Price:
$149
Reserve Your Seat Today
April Sall is a keeper of the Mojave Desert and its mountains, tending a private conservancy in the same canyon where her grandmother homesteaded in the 1920s.

Once considered wasteland, this expanse of sunshine and wind is now a prized battleground between unlikely opponents. For generations, conservationists like Sall's family have guarded the landscape, but 21st-century demands for renewable energy are threatening to crash into the pristine desert, now deemed a gold mine for solar, wind and geothermal farms.

Unlike offshore drilling and other oil and gas ventures in which developers and environmentalists are obvious adversaries, renewable energy is increasingly pitting two kinds of green advocates against each other as the nation seeks alternative sources in the face of record oil prices and global warming, both sides say.

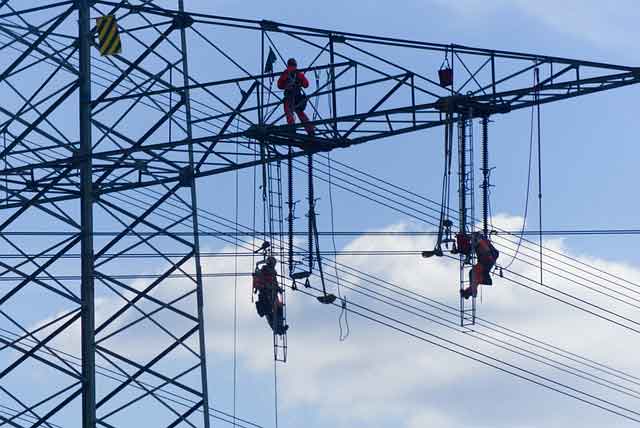
The issue bears upon building a new infrastructure — such as gargantuan transmission towers or wind turbines — to connect remote areas where clean energy is being harvested while conservationists vigilantly protect the land and its life.

The stakes are acute in California, where new state laws demand industry cut carbon emissions to 1990 levels by 2020 and require private utilities to generate 20 percent renewable energy by 2010.

Near Pipes Canyon — where Sall, a preserve manager for the nonprofit Wildlands Conservancy, resides — a group led by the Los Angeles Department of Water and Power is considering building a leg of transmission lines between a substation outside Palm Springs and one in Hesperia, about 80 miles away.

Called Green Path North, the lines would ultimately connect Los Angeles and other communities to the Salton Sea's 2,000 megawatts of geothermal power — enough to juice 2 million homes — as well as solar and wind plants.

The utility group will select from six potential routes, including one as long as 313 miles, but a dispute over a "preferred" route through Pipes Canyon and the broader Morongo Basin has residents fuming.

"There's some conflict due to what's been described as a feeding frenzy for renewable energy in the desert," Sall, 28, said as she walked through a landscape of mesas and the Sawtooth Mountains that surround Pipes Canyon and adjacent Pioneertown.

"If you're going to destroy conservation and pristine lands, then, yeah, how green is it in the end?" Sall asked.

She said she favors cities' building solar plants on warehouse roofs, for example, but the utilities say the desert's geothermal fields provide a steady stream of power and do not rely on weather conditions as solar and wind power do.

Still, the dispute has led to tense meetings, and residents set up a Web site condemning the renewable-energy transmission lines through their communities.

As Congress and presidential candidates John McCain and Barack Obama struggle with the nation's energy crisis, developing alternative energy poses conflicts, too.

"We're really at the forefront of a discussion that is certainly going to be repeated throughout the state of California and nationally as well," said David Nahai, general manager and chief executive officer of the Los Angeles Department of Water and Power.

Related News

Bright Feeds Powers Berlin Facility with Solar Energy

Bright Feeds Solar Upgrade integrates a 300-kW DC PV system and 625 solar panels at the Berlin, CT plant, supplying one-third of power, cutting carbon emissions, and advancing clean, renewable energy in agriculture.


Key Points

An initiative powering Bright Feeds' Berlin plant with a 300-kW DC PV array, reducing costs and carbon emissions.

✅ 300-kW DC PV with 625 panels by Solect Energy

✅ Supplies ~33% of facility power; lowers operating costs

✅ Offsets 2,100+ tons CO2e; advances clean, sustainable agriculture


Bright Feeds, a New England-based startup, has successfully transitioned its Berlin, Connecticut, animal feed production facility to solar energy. The company installed a 300-kilowatt direct current (DC) solar photovoltaic (PV) system at its 25,000-square-foot plant, mirroring progress seen at projects like the Arvato solar plant in advancing onsite generation. This move aligns with Bright Feeds' commitment to sustainability and reducing its carbon footprint.

Solar Installation Details

The solar system comprises 625 solar panels and was developed and installed by Solect Energy, a Massachusetts-based company, reflecting momentum as projects like Building Energy's launch come online nationwide. Over its lifetime, the system is projected to offset more than 2,100 tons of carbon emissions, contributing significantly to the company's environmental goals. This initiative not only reduces energy expenses but also supports Bright Feeds' mission to promote clean energy solutions in the agricultural sector. 

Bright Feeds' Sustainable Operations

At its Berlin facility, Bright Feeds employs advanced artificial intelligence and drying technology to transform surplus food into an all-natural, nutrient-rich alternative to soy and corn in animal feed, complementing emerging agrivoltaics approaches that pair energy with agriculture. The company supplies its innovative feed product to a broad range of customers across the Northeast, including animal feed distributors and dairy farms. By processing food that would otherwise go to waste, the facility diverts tens of thousands of tons of food from the regional waste stream each year. When operating at full capacity, the environmental benefit of the plant’s process is comparable to taking more than 33,000 cars off the road annually.

Industry Impact

Bright Feeds' adoption of solar energy sets a precedent for sustainability in the agricultural sector. The integration of renewable energy sources into production processes not only reduces operational costs but also demonstrates a commitment to environmental stewardship, amid rising European demand for U.S. solar equipment that underscores market momentum. As the demand for sustainable practices grows, and as rural clean energy delivers measurable benefits, other companies in the industry may look to Bright Feeds as a model for integrating clean energy solutions into their operations.

Bright Feeds' initiative to power its Berlin facility with solar energy underscores the company's dedication to sustainability and innovation. By harnessing the power of the sun, Bright Feeds is not only reducing its carbon footprint but also contributing to a cleaner, more sustainable future for the agricultural industry, and when paired with solar batteries can further enhance resilience. This move serves as an example for other companies seeking to align their operations with environmental responsibility and renewable energy adoption, as new milestones like a U.S. clean energy factory signal expanding capacity across the sector.


Related News

View more

Major U.S. utilities spending more on electricity delivery, less on power production

U.S. Utility Spending Shift highlights rising transmission and distribution costs, grid modernization, and smart meters, while generation expenses decline amid fuel price volatility, capital and labor pressures, and renewable integration across the power sector.


Key Points

A decade-long trend where utilities spend more on delivery and grid upgrades, and less on electricity generation costs.

✅ Delivery O&M, wires, poles, and meters drive rising costs

✅ Generation spending declines amid fuel price changes and PPI

✅ Grid upgrades add reliability, resilience, and renewable integration


Over the past decade, major utilities in the United States have been spending more on delivering electricity to customers and less on producing that electricity, a shift occurring as electricity demand is flat across many regions.

After adjusting for inflation, major utilities spent 2.6 cents per kilowatthour (kWh) on electricity delivery in 2010, using 2020 dollars. In comparison, spending on delivery was 65% higher in 2020 at 4.3 cents/kWh, and residential bills rose in 2022 as inflation persisted. Conversely, utility spending on power production decreased from 6.8 cents/kWh in 2010 (using 2020 dollars) to 4.6 cents/kWh in 2020.

Utility spending on electricity delivery includes the money spent to build, operate, and maintain the electric wires, poles, towers, and meters that make up the transmission and distribution system. In real 2020 dollar terms, spending on electricity delivery increased every year from 1998 to 2020 as utilities worked to replace aging equipment, build transmission infrastructure to accommodate new wind and solar generation amid clean energy transition challenges that affect costs, and install new technologies such as smart meters to increase the efficiency, reliability, resilience, and security of the U.S. power grid.

Spending on power production includes the money spent to build, operate, fuel, and maintain power plants, as well as the cost to purchase power in cases where the utility either does not own generators or does not generate enough to fulfill customer demand. Spending on electricity production includes the cost of fuels including natural gas prices alongside capital, labor, and building materials, as well as the type of generators being built.

Other utility spending on electricity includes general and administrative expenses, general infrastructure such as office space, and spending on intangible goods such as licenses and franchise fees, even as electricity sales declined in recent years.

The retail price of electricity reflects the cost to produce and deliver power, the rate of return on investment that regulated utilities are allowed, and profits for unregulated power suppliers, and, as electricity prices at 41-year high have been reported, these components have drawn increased scrutiny.

In 2021, demand for consumer goods and the energy needed to produce them has been outpacing supply, though power demand sliding in 2023 with milder weather has also been noted. This difference has contributed to higher prices for fuels used by electric generators, especially natural gas. The increased cost for fuel, capital, labor, and building materials, as seen in the U.S. Bureau of Labor Statistics’ Producer Price Index, is increasing the cost of power production for 2021. U.S. average electricity prices have been higher every month of this year compared with 2020, according to our Monthly Electric Power Industry Report.


Related News

View more

France nuclear power stations to limit energy output due to high river temps

France Nuclear Heatwave Restrictions signal reduced nuclear power along the Rhone River as EDF imposes output limits due to high water temperatures, grid needs, with minimal price impact amid strong solar and exports.


Key Points

Temporary EDF output limits at Rhone River reactors due to hot water, protecting ecosystems and grid reliability.

✅ EDF expects halved output at Bugey and Saint Alban.

✅ Cuts align with water temperature and discharge rules.

✅ Weekend midday curtailments offset by solar supply.


The high temperature warning has come early this year but will affect fewer nuclear power plants. High temperatures could halve nuclear power production, with river temperature limits at plants along France's Rhone River this week. 

Output restrictions are expected at two nuclear plants in eastern France due to high temperature forecasts, nuclear operator EDF said. It comes several days ahead of a similar warning that was made last year but will affect fewer plants, and follows a period when power demand has held firm during lockdowns across Europe.

The hot weather is likely to halve the available power supply from the 3.6 GW Bugey plant from 13 July and the 2.6 GW Saint Alban plant from 16 July, the operator said.

However, production will be at least 1.8 GW at Bugey and 1.3 GW at Saint Alban to meet grid requirements, and may change according to grid needs, the operator said.

Kpler analyst Emeric de Vigan said the restrictions were likely to have little effect on output in practice. Cuts are likely only at the weekend or midday when solar output was at its peak so the impact on power prices would be slim.

He said the situation would need monitoring in the coming weeks, however, noting it was unusually early in the summer for nuclear-powered France to see such restrictions imposed.

Water temperatures at the Bugey plant already eclipsed the initial threshold for restrictions on 9 July, as European power hits records during the heatwave. They are currently forecast to peak next week and then drop again, Refinitiv data showed.

"France is currently net exporting large amounts of power – and, despite a nuclear power dispute with Germany, single nuclear units' supply restrictions will not have the same effect as last year," Refinitiv analyst Nathalie Gerl said.

The Garonne River in southern France has the highest potential for critical levels of warming, but its Golfech plant is currently offline for maintenance until mid-August, as Europe faces nuclear losses, the data showed.

"(The restrictions were) to be expected and it will probably occur more often," Greenpeace campaigner Roger Spautz said.

"The authorities must stick to existing regulations for water discharges. Otherwise, the ecosystems will be even more affected," he added.


Related News

View more

India is now the world’s third-largest electricity producer

India Electricity Production 2017 surged to 1,160 BU, ranking third globally; rising TWh output with 334 GW capacity, strong renewables and thermal mix, 7% CAGR in generation, and growing demand, investments, and FDI inflows.


Key Points

India's 2017 power output reached 1,160 BU, third globally, supported by 334 GW capacity, rising renewables, and 7% CAGR.

✅ 1,160 BU generated; third after China and the US

✅ Installed capacity 334 GW; 65% thermal, rising renewables

✅ Generation CAGR ~7%; demand, FDI, investments rising


India now generates around 1,160.1 billion units of electricity in financial year 2017, up 4.72% from the previous year, and amid surging global electricity demand that is straining power systems. The country is behind only China which produced 6,015 terrawatt hours (TWh. 1 TW = 1,000,000 megawatts) and the US (4,327 TWh), and is ahead of Russia, Japan, Germany, and Canada.


India’s electricity production grew 34% over seven years to 2017, and the country now produces more energy than Japan and Russia, which had 27% and 8.77% more electricity generation capacity installed, respectively, than India seven years ago.

India produced 1,160.10 billion units (BU) of electricity–one BU is enough to power 10 million households (one household using average of about 3 units per day) for a month–in financial year (FY) 2017. Electricity production stood at 1,003.525 BU between April 2017-January 2018, according to a February 2018 report by India Brand Equity Foundation (IBEF), a trust established by the commerce ministry.

#google#

With a production of 1,423 BU in FY 2016, India was the third largest producer and the third largest consumer of electricity in the world, behind China (6,015 BU) and the United States (4,327 BU).

With an annual growth rate of 22.6% capacity addition over a decade to FY 2017, renewables beat other power sources–thermal, hydro and nuclear. Renewables, however, made up only 18.79% of India’s energy, up 68.65% since 2007, and globally, low-emissions sources are expected to cover most demand growth in the coming years. About 65% of installed capacity continues to be thermal.

As of January 2018, India has installed power capacity of 334.4 gigawatt (GW), making it the fifth largest installed capacity in the world after European Union, China, United States and Japan, and with much of the fleet coal-based, imported coal volumes have risen at times amid domestic supply constraints.

The government is targeting capacity addition of around 100 GW–the current power production of United Kingdom–by 2022, as per the IBEF report.


Electricity generation grew at 7% annually

India achieved a 34.48% growth in electricity production by producing 1,160.10 BU in 2017 compared to 771.60 BU in 2010–meaning that in these seven years, electricity production in India grew at a compound annual growth rate (CAGR) of 7.03%, while thermal power plants' PLF has risen recently amid higher demand and lower hydro.


Generation capacity grew at 10% annually

Of 334.5 GW installed capacity as of January 2018–up 60% from 132.30 GW in 2007–thermal installed capacity was 219.81 GW. Hydro and renewable energy installed capacity totaled 44.96 GW and 62.85 GW, respectively, said the report.

The CAGR in installed capacity over a decade to 2017 was 10.57% for thermal power, 22.06% for renewable energy–the fastest among all sources of power–2.51% for hydro power and 5.68% for nuclear power.


Growing demand, higher investments will drive future growth

Growing population and increasing penetration of electricity connections, along with increasing per-capita usage would provide further impetus to the power sector, said the report.

Power consumption is estimated to increase from 1,160.1 BU in 2016 to 1,894.7 BU in 2022, as per the report, though electricity demand fell sharply in one recent period.

Increasing investment remained one of the driving factors of power sector growth in the country.

Power sector has a 100% foreign direct investment (FDI) permit, which boosted FDI inflows in the sector.

Total FDI inflows in the power sector reached $12.97 billion (Rs 83,713 crore) during April 2000 to December 2017, accounting for 3.52% of FDI inflows in India, the report said.


Related News

View more

Two new electricity interconnectors planned for UK

Ofgem UK Electricity Interconnectors will channel subsea cables, linking Europe, enabling energy import/export, integrating offshore wind via multiple-purpose interconnectors, boosting grid stability, capacity, and investment under National Grid analysis to 2030 targets.


Key Points

Subsea links between the UK and Europe that trade power, integrate offshore wind, and reinforce grid capacity.

✅ Two new subsea interconnector bids open in 2025

✅ Pilot for multiple-purpose links to offshore wind clusters

✅ National Grid to assess optimal routes, capacity, and locations


Ofgem has opened bids to build two electricity interconnectors between the UK and continental Europe as part of the broader UK grid transformation now underway.

The energy regulator said this would “bring forward billions of pounds of investment” in the subsea cables, such as the Lake Erie Connector, which can import cheaper energy when needed and export surplus power from the UK when it is available.

Developers will be invited to submit bids to build the interconnectors next year. Ofgem will additionally run a pilot scheme for ‘multiple-purpose interconnectors’, which are used to link clusters of offshore wind farms and related innovations like an offshore vessel chargepoint to an interconnector.

This forms part of the UK Government drive to more than double capacity by 2030, and to manage rising electric-vehicle demand, as discussed in EV grid impacts, in support of its target of quadrupling offshore wind capacity by the same date.

Interconnectors provide some 7 per cent of UK electricity demand. The UK so far has seven electricity interconnectors linked to Ireland, France, Belgium, the Netherlands and Norway, while projects like the Ireland-France connection illustrate broader European grid integration.

Balfour Beatty won a £90m contract for onshore civil engineering works on the Viking Link Norway interconnector, which is due to come into operation in 2023, while London Gateway's all-electric berth highlights related port electrification.

It said that interconnector developers have in the past been allowed to propose their preferred design, connection location and sea route to the connecting country. Ofgem has now said it may decide to consider only those projects that meet its requirements based on an analysis of location and capacity needs by National Grid.

Ofgem has not specified that the new interconnectors must link to any specific place or country, but may do so later, as priorities like the Cyprus electricity highway illustrate emerging directions.


Related News

View more

Smart grid and system improvements help avoid more than 500,000 outages over the summer

ComEd Smart Grid Reliability drives outage reduction across Illinois, leveraging smart switches, grid modernization, and peak demand programs to keep customers powered, improve power quality, and enhance energy savings during extreme weather and severe storms.


Key Points

ComEd's smart grid performance, cutting outages and improving power quality to enhance reliability and customer savings.

✅ Smart switches reroute power to avoid customer interruptions

✅ Fewer outages during extreme weather across northern Illinois

✅ Peak Time Savings rewards for reduced peak demand usage


While the summer of 2019 set records for heat and brought severe storms, ComEd customers stayed cool thanks to record-setting reliability during the season. These smart grid investments over the last seven years helped to set records in key reliability measurements, including frequency of outages metrics, and through smart switches that reroute power around potential problem areas, avoided more than 538,000 customer interruptions from June to August.

"In a summer where we were challenged by extreme weather, we saw our smart grid investments and our people continue to deliver the highest levels of reliability, backed by extensive disaster planning across utilities, for the families and businesses we serve," said Joe Dominguez, CEO of ComEd. "We're proud to deliver the most affordable, cleanest and, as we demonstrated this summer, most reliable energy to our customers. I want to thank our 6,000 employees who work around the clock in often challenging conditions to power our communities."

ComEd has avoided more than 13 million customer interruptions since 2012, due in part to smart grid and system improvements. The avoided outages have resulted in $2.4 billion in estimated savings to society. In addition to keeping energy flowing for residents, strong power reliability continues to help persuade industrial and commercial companies to expand in northern Illinois and Chicago. The GridWise Alliance recently recognized Illinois as the No. 2 state in the nation for its smart grid implementation.

"Our smart grid investments has vastly improved the infrastructure of our system," said Terry Donnelly, ComEd president and chief operating officer. "We review the system and our operations continually to make sure we're investing in areas that benefit the greatest number of customers, and to prepare for public-health emergencies as well. On a daily basis and during storms or to reduce wildfire risk when necessary, our customers are seeing fewer and fewer interruptions to their lives and businesses."

ComEd customers also set records for energy savings this summer. Through its Peak Time Savings program and other energy-efficiency programs offered by utilities, ComEd empowered nearly 300,000 families and individuals to lower their bills by a total of more than $4 million this summer for voluntarily reducing their energy use during times of peak demand. Since the Peak Time Savings program launched in 2015, participating customers have earned a total of more than $10 million in bill credits.


Related News

View more

Sign Up for Electricity Forum’s Newsletter

Stay informed with our FREE Newsletter — get the latest news, breakthrough technologies, and expert insights, delivered straight to your inbox.

Electricity Today T&D Magazine Subscribe for FREE

Stay informed with the latest T&D policies and technologies.
  • Timely insights from industry experts
  • Practical solutions T&D engineers
  • Free access to every issue

Download the 2025 Electrical Training Catalog

Explore 50+ live, expert-led electrical training courses –

  • Interactive
  • Flexible
  • CEU-cerified