REPowerEU Plan accelerates the EU's shift from Russian fossil fuels with renewable energy, energy efficiency, solar, wind, heat pumps, faster permits, and energy security measures by 2027, backed by grants, loans, and grid investments.
Key Points
EU plan to quit Russian fossil fuels via renewables and efficiency, with faster permits, by 2027.
✅ €300bn in grants and loans for efficiency and renewables
✅ Streamlined permits; solar mandate on new buildings
✅ Targets 2027 independence; cuts Russian gas, oil, coal
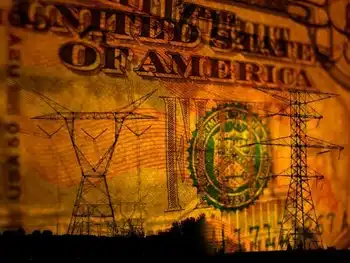
The European Union’s executive arm moved Wednesday to jump-start plans for the 27-nation bloc to abandon Russian energy amid the Kremlin’s war in Ukraine, proposing a nearly 300 billion-euro ($315 billion) package that includes more efficient use of fuels and faster rollout of renewable power, even as rolling back electricity prices remains challenging.
The European Commission’s investment initiative is meant to help the 27 EU countries start weaning themselves off Russian fossil fuels this year, a move many see as a wake-up call to ditch fossil fuels across Europe. The goal is to deprive Russia, the EU’s main supplier of oil, natural gas and coal, of tens of billions in revenue and strengthen EU climate policies.
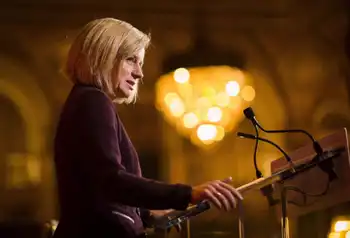
“We are taking our ambition to yet another level to make sure that we become independent from Russian fossil fuels as quickly as possible,” European Commission President Ursula von der Leyen said in Brussels when announcing the package, dubbed REPowerEU.
With no end in sight to Russia’s war in Ukraine and European energy security shaken, amid what some describe as an energy nightmare for the region, the EU is rushing to align its geopolitical and climate interests for the coming decades. It comes amid troubling signs that have raised concerns about energy supplies that the EU relies on and have no quick replacements for, including Russia cutting off member nations Poland and Bulgaria after they refused a demand to pay for natural gas in rubles.
The bloc’s dash to ditch Russian energy stems from a combination of voluntary and mandatory actions. Both reflect the political discomfort of helping fund Russia’s military campaign in a country that neighbors the EU and wants to join the bloc.
An EU ban on coal from Russia is due to start in August, and the bloc has pledged to try to reduce demand for Russian gas by two-thirds by year's end, while debating gas price cap strategies to curb volatility. Meanwhile, a proposed EU oil embargo has hit a roadblock from Hungary and other landlocked countries that worry about the cost of switching to alternative sources.
In a bid to swing Hungary behind the oil phaseout, the REPowerEU package expects oil investment funding of around 2 billion euros for member nations highly dependent on Russian oil.
Energy savings and renewables form the cornerstones of the package, which would be funded mainly by an economic stimulus program put in place to help member countries overcome the slump triggered by the coronavirus pandemic.
The European Commission said the price tag for abandoning Russian fossil fuels completely by a 2027 target date is 210 billion euros. Its package includes 56 billion euros for energy efficiency and 86 billion euros for renewables.
Von der Leyen cited a total funding pot of 72 billion euros in grants and 225 billion euros for loans.
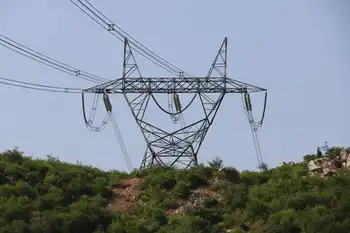
The European Commission also proposed ways to streamline the approval processes in EU countries for renewable projects, which can take up to a decade to get through red tape, as part of a broader effort to revamp the electricity market across Europe. The commission said approval times need to fall to as little as a year or less.
It put forward a specific plan on solar energy, seeking to double photovoltaic capacity by 2025 and pushing for a phased-in obligation to install solar panels on new buildings.
Simone Tagliapietra, an energy expert at the Bruegel think tank in Brussels, called REPowerEU a “jumbo package” whose success will ultimately depend on political will in the bloc’s national capitals, with examples such as Germany’s 200 billion euro energy price shield illustrating the scale of national responses.
“Most of the actions entailed in the plan require either national implementation or strong coordination among member states,” Tagliapietra said. “The extent to which countries really engage is going to be defining.”
The German energy think tank Agora Energiewende said the EU’s plan “gives too little attention to concrete initiatives that reduce fossil fuel demand in the short term and thereby misses the opportunity to simultaneously enhance Europe’s energy security and meet Europe’s climate objectives.”
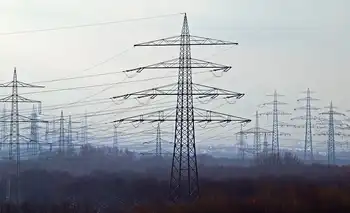
The group's research shows rapidly expanding solar, wind parks and use of heat pumps for low-temperature heat in industry and buildings could be done faster than constructing new liquefied natural gas terminals or gas infrastructure, said Matthias Buck, its director for Europe.
The European Commission’s recommendations on short-term national actions to cut demand for Russian energy, which include potential emergency measures to limit electricity prices as well, coincide with deliberations underway in the bloc since last year on setting more ambitious EU energy-efficiency and renewable targets for 2030.
Those targets, being negotiated by the European Parliament and national governments, are part of the bloc’s commitments to a 55% cut in greenhouse gases by decade's end, compared with 1990 emissions, and to climate neutrality by 2050.
Von der Leyen urged the European Parliament and national governments to deepen the commission’s July proposal for an energy efficiency target of 9% and renewable energy goal of 40% by 2030. She said those objectives should be 13% and 45%, respectively.
Belgium, the Netherlands, Germany and Denmark plan to build North Sea wind farms to help cut carbon emissions.
Related News