Maritime Link HVDC Transmission connects Newfoundland and Nova Scotia to the North American grid, enabling renewable energy imports, subsea cable interconnection, Muskrat Falls hydro power delivery, and lower carbon emissions across Atlantic Canada.
Key Points
A 500 MW HVDC intertie linking Newfoundland and Nova Scotia to deliver Muskrat Falls hydro power.
✅ 500 MW capacity using twin 170 km subsea HVDC cables
✅ Interconnects Newfoundland and Nova Scotia to the North American grid
✅ Enables Muskrat Falls hydro imports, cutting CO2 and costs
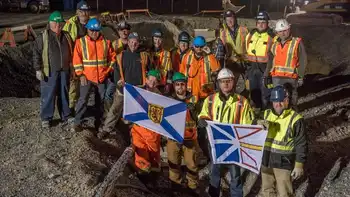
For the first time, electricity has been sent between Newfoundland and Nova Scotia through the new Maritime Link.
The 500-megawatt transmission line — which connects Newfoundland to the North American energy grid for the first time and echoes projects like the New England Clean Power Link underway — was tested Friday.
"This changes not only the energy options for Newfoundland and Labrador but also for Nova Scotia and Atlantic Canada," said Rick Janega, the CEO of Emera Newfoundland and Labrador, which owns the link.
"It's an historic event in our eyes, one that transforms the electricity system in our region forever."
'On time and on budget'
It will eventually carry power from the Muskrat Falls hydro project in Labrador, where construction is running two years behind schedule and $4 billion over budget, a context in which the Manitoba Hydro line to Minnesota has also faced delay, to Nova Scotia consumers. It was supposed to start producing power later this year, but the new deadline is 2020 at the earliest.
The project includes two 170-kilometre subsea cables across the Cabot Strait between Cape Ray in southwestern Newfoundland and Point Aconi in Cape Breton.
The two cables, each the width of a two-litre pop bottle, can carry 250 megawatts of high voltage direct current, and rest on the ocean floor at depths up to 470 metres.
This reel of cable arrived in St. John's back in April aboard the Norwegian vessel Nexans Skagerrak, after the first power cable reached Nova Scotia earlier in the project. (Submitted by Emera NL)
The Maritime Link also includes almost 50 kilometres of overland transmission in Nova Scotia and more than 300 kilometres of overland transmission in Newfoundland, paralleling milestones on Site C transmission work in British Columbia.
The link won't go into commercial operation until January 1.
Janega said the $1.6-billion project is on time and on budget.
"We're very pleased to be in a position to be able to say that after seven years of working on this. It's quite an accomplishment," he said.
This Norwegian vessel was used to transport the 5,500 tonne subsea cable. (Submitted by Emera NL)
Once in service, the link will improve electrical interconnections between the Atlantic provinces, aligning with climate adaptation guidance for Canadian utilities.
"For Nova Scotia it will allow it to achieve its 40 per cent renewable energy target in 2020. For Newfoundland it will allow them to shut off the Holyrood generating station, in fact using the Maritime Link in advance of the balance of the project coming into service," Janega said.
Karen Hutt, president and CEO of Nova Scotia Power, which is owned by Emera Inc., calls it a great day for Nova Scotia.
"When it goes into operation in January, the Maritime Link will benefit Nova Scotia Power customers by creating a more stable and secure system, helping reduce carbon emissions, and enabling NSP to purchase power from new sources," Hutt said in a statement.
Related News