
Substation Relay Protection Training
Our customized live online or in‑person group training can be delivered to your staff at your location.

- Live Online
- 12 hours Instructor-led
- Group Training Available
Regular Price:
$699
Coupon Price:
$599
NEW YORK
—
Clean Coal Technologies Pristine Funding secures investment from a New York asset manager via Black Diamond, advancing commercialization, Tulsa testing, Wyoming relocation, PRB coal enhancement, and cleaner energy innovation to support global coal exports.
What This Means
Capital from a New York asset manager backs Pristine commercialization, testing, and Wyoming relocation to boost PRB coal.
Major NY asset manager invests via Black Diamond.
Funds cover Tulsa tests and relocation to Wyoming.
Permitting underway; first Pristine M module planned in WY.
Aims to upgrade PRB coal and boost U.S. export competitiveness.
Clean Coal Technologies, Inc., an emerging cleaner-energy company utilizing patented and proven technology to convert untreated coal into a cleaner burning and more efficient fuel, announced today that the company has secured funding for their Pristine technology through commercialization, a move reminiscent of Bruce C project funding activity, from a major New York-based Asset Management company. This investment will be made through Black Diamond with all funds earmarked for test procedures at the plant near Tulsa, OK, at a time when rare new coal plants are appearing, and the plant's move to a permanent location in Wyoming. The first tranche is being paid immediately.
"Securing this investment will confidently carry us through to the construction of our first commercial module enabling management to focus on the additional tests that have been requested from multiple parties, even as US coal demand faces headwinds across the market," stated CEO of Clean Coal Technologies, Inc., Robin Eves. "At this time we have begun scheduling plant visits with both US government agency and coal industry officials along with key international energy consortiums that are monitoring transitions such as Alberta's coal phaseout policies."
"We're now able to finalize our negotiations in Wyoming where the permitting process has begun and where we will permanently relocate the test facility later this year following completion of the aforementioned tests," added CCTI COO/CFO, Aiden Neary. "This event also paves the way forward to commence the process of constructing the first commercial Pristine M facility. That plant is planned to be in Wyoming near an operating mine where our process can be used to enhance the quality of PRB coal to make it more competitive globally, even as regions like western Europe see coal-to-renewables conversions at legacy plants, and help restore the US coal export market."
Related News
Related News
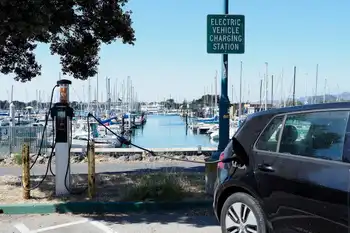
Spread of Electric Cars Sparks Fights for Control Over Charging
Utility-Controlled EV Charging shapes who builds charging stations as utilities, regulators, and private networks compete…
View more
The U.S. passed a historic climate deal this year - Recap
Inflation Reduction Act climate provisions accelerate clean energy, EV tax credits, methane fee, hydrogen incentives,…
View more

Bimbo Canada signs agreements to offset 100 per cent of its electricity consumption for Canadian operations
Bimbo Canada VPPAs secure renewable electricity from RES wind and solar projects in Alberta, totaling…
View more

SEA To Convert 10,000 US School Buses To Electricity
SEA Electric school bus conversions bring EV electrification to Type A and Type C fleets,…
View more

US: In 2021, Plug-Ins Traveled 19 Billion Miles On Electricity
US Plug-in EV Miles 2021 highlight BEV and PHEV growth, DOE and Argonne data, 19.1…
View more

Biden's interior dept. acts quickly on Vineyard Wind
Vineyard Wind I advances as BOEM issues a final environmental impact statement for the 800…
View more
Sign Up for Electricity Forum’s Newsletter
Stay informed with our FREE Newsletter — get the latest news, breakthrough technologies, and expert insights, delivered straight to your inbox.
Electricity Today T&D Magazine Subscribe for FREE

Stay informed with the latest T&D policies and technologies.
- Timely insights from industry experts
- Practical solutions T&D engineers
- Free access to every issue

