Idaho Power: Equipment failure led to wildfire

By Associated Press


NFPA 70e Training - Arc Flash

Our customized live online or in‑person group training can be delivered to your staff at your location.

  • Live Online
  • 6 hours Instructor-led
  • Group Training Available
Regular Price:
$199
Coupon Price:
$149
Reserve Your Seat Today
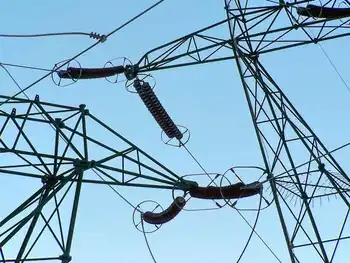
Investigators have concluded that an equipment failure on Idaho Power Co. electricity lines ignited a wildfire in which one woman died and nearly 20 homes were destroyed or damaged in a southeastern Boise neighborhood.

A defective piece of heated metal hardware "was a factor in this accidental and devastating fire," LaMont Keen, the utility's chief executive officer, told a news conference.

"To the extent we are found to be responsible," Keen said, "we will fulfill our obligations."

Several events played a role in the wildfire, including the loose piece of hot metal that fell from the utility pole to the ground and ignited the blaze, according to investigators. Also contributing were high winds and an additional electrical current caused when a tree fell into power lines shortly before the fire.

The Boise Fire Department, Idaho Power and the federal Bureau of Land Management participated in the investigation.

The fire was reported around 7 p.m. August 25 in a vacant field of sagebrush and dry grasses. Winds gusted up to 50 mph and within two minutes the blaze had spread to a nearby ridge and roared toward a line of homes in a Boise subdivision, Fire Chief Dennis Doan said.

"This was a terrible accident caused by high winds," Doan said.

Fire officials have said 10 homes were destroyed.

After the blaze was brought under control fire crews discovered the body of Mary Ellen Ryder in a house that was destroyed. Ryder, 56, was a professor of English and linguistics at Boise State University and Boise police have determined she was likely a victim of the wildfire.

Idaho Power owns the land beneath the utility line where the fire started. The piece of equipment that malfunctioned is called a connector and it was last inspected in 2006, said Lisa Grow, the company's vice president of delivery engineering and operations.

"These types of devices rarely fail," Grow said. "It's quite rare."

Idaho Power, the state's largest utility, routinely inspects power lines every three years, Grow said. "The loose connector would have not been visible even if an inspector saw it the day before the fire," she said.

Earlier this year, fire crews helped residents in the Boise neighborhood where the fire occurred clear "defensible spaces" around their homes, urging them to cut down sagebrush and dry grasses.

But fire prevention measures proved futile against the fast-moving winds, which carried the fire to the line of homes overlooking the ridge, and then continued onto houses across the street.

Related News

Ontario Launches Largest Competitive Energy Procurement in Province’s History

Ontario Competitive Energy Procurement accelerates renewables, boosts grid reliability, and invites competitive bids across solar, wind, natural gas, and storage, driving innovation, lower costs, and decarbonization to meet rising electricity demand and ensure power supply.


Key Points

Ontario Competitive Energy Procurement is a competitive bidding program to deliver reliable, low-carbon electricity.

✅ Competitive bids from renewables, gas, and storage

✅ Targets grid reliability, affordability, and emissions

✅ Phased evaluations: technical, financial, environmental


Ontario has recently marked a significant milestone in its energy sector with the launch of what is being touted as the largest competitive energy procurement process in the province’s history. This ambitious initiative is set to transform the province’s energy landscape through a broader market overhaul that fosters innovation, enhances reliability, and addresses the growing demands of Ontario’s diverse population.

A New Era of Energy Procurement

The Ontario government’s move to initiate this massive competitive procurement process underscores a strategic shift towards modernizing and diversifying the province’s energy portfolio. This procurement exercise will invite bids from a broad spectrum of energy suppliers and technologies, ranging from traditional sources like natural gas to renewable energy options such as solar and wind power. The aim is to secure a reliable and cost-effective energy supply that aligns with Ontario’s long-term environmental and economic goals.

This historic procurement process represents a major leap from previous approaches by emphasizing a competitive marketplace where various energy providers can compete on an equal footing through electricity auctions and transparent bidding. By doing so, the government hopes to drive down costs, encourage technological advancements, and ensure that Ontarians benefit from a more dynamic and resilient energy system.

Key Objectives and Benefits

The primary objectives of this procurement initiative are multifaceted. First and foremost, it seeks to enhance the reliability of Ontario’s electricity grid. As the province experiences population growth and increased energy demands, maintaining a stable and dependable supply of electricity is crucial, and interprovincial imports through an electricity deal with Quebec can complement local generation. This procurement process will help identify and integrate new sources of power that can meet these demands effectively.

Another significant goal is to promote environmental sustainability. Ontario has committed to reducing its greenhouse gas emissions through Clean Electricity Regulations and transitioning to a cleaner energy mix. By inviting bids from renewable energy sources and innovative technologies, the government aims to support its climate action plan and contribute to the province’s carbon reduction targets.

Cost-effectiveness is also a central focus of the procurement process. By creating a competitive environment, the government anticipates that energy providers will strive to offer more attractive pricing structures and fair electricity cost allocation practices for ratepayers. This, in turn, could lead to lower energy costs for consumers and businesses, fostering economic growth and improving affordability.

The Competitive Landscape

The competitive energy procurement process will be structured to encourage participation from a wide range of energy providers. This includes not only established companies but also emerging players and startups with innovative technologies. By fostering a diverse pool of bidders, the government aims to ensure that all viable options are considered, ultimately leading to a more robust and adaptable energy system.

Additionally, the process will likely involve various stages of evaluation, including technical assessments, financial analyses, and environmental impact reviews. This thorough evaluation will help ensure that selected projects meet the highest standards of performance and sustainability.

Implications for Stakeholders

The implications of this procurement process extend beyond just energy providers and consumers. Local communities, businesses, and environmental organizations will all play a role in shaping the outcomes. For communities, this initiative could mean new job opportunities and economic development, particularly in regions where new energy projects are developed. For businesses, the potential for lower energy costs and access to innovative energy solutions, including demand-response initiatives like the Peak Perks program, could drive growth and competitiveness.

Environmental organizations will be keenly watching the process to ensure that it aligns with broader sustainability goals. The inclusion of renewable energy sources and advanced technologies will be a critical factor in evaluating the success of the initiative in meeting Ontario’s climate objectives.

Looking Ahead

As Ontario embarks on this unprecedented energy procurement journey, the outcomes will be closely watched by various stakeholders. The success of this initiative will depend on the quality and diversity of the bids received, the efficiency of the evaluation process, and the ability to integrate new energy sources into the existing grid, while advancing energy independence where feasible.

In conclusion, Ontario’s launch of the largest competitive energy procurement process in its history is a landmark event that holds promise for a more reliable, sustainable, and cost-effective energy future. By embracing competition and innovation, the province is setting a new standard for energy procurement that could serve as a model for other regions seeking to modernize their energy systems. The coming months will be crucial in determining how this bold initiative will shape Ontario’s energy landscape for years to come.


Related News

View more

UK low-carbon electricity generation stalls in 2019

UK low-carbon electricity 2019 saw stalled growth as renewables rose slightly, wind expanded, nuclear output fell, coal hit record lows, and net-zero targets demand faster deployment to cut CO2 intensity below 100gCO2/kWh.


Key Points

Low-carbon sources supplied 54% of UK power in 2019, up just 1TWh; wind grew, nuclear fell, and coal dropped to 2%.

✅ Wind up 8TWh; nuclear down 9TWh amid outages

✅ Fossil fuels 43% of generation; coal at 2%

✅ Net-zero needs 15TWh per year added to 2030


The amount of electricity generated by low-carbon sources in the UK stalled in 2019, Carbon Brief analysis shows.

Low-carbon electricity output from wind, solar, nuclear, hydro and biomass rose by just 1 terawatt hour (TWh, less than 1%) in 2019. It represents the smallest annual increase in a decade, where annual growth averaged 9TWh. This growth will need to double in the 2020s to meet UK climate targets while replacing old nuclear plants as they retire.

Some 54% of UK electricity generation in 2019 came from low-carbon sources, including 37% from renewables and 20% from wind alone, underscoring wind's leading role in the power mix during key periods. A record-low 43% was from fossil fuels, with 41% from gas and just 2% from coal, also a record low. In 2010, fossil fuels generated 75% of the total.

Carbon Brief’s analysis of UK electricity generation in 2019 is based on figures from BM Reports and the Department for Business, Energy and Industrial Strategy (BEIS). See the methodology at the end for more on how the analysis was conducted.

The numbers differ from those published earlier in January by National Grid, which were for electricity supplied in Great Britain only (England, Wales and Scotland, but excluding Northern Ireland), including via imports from other countries.

Low-carbon low
In 2019, the UK became the first major economy to target net-zero greenhouse gas emissions by 2050, increasing the ambition of its legally binding Climate Change Act.

To date, the country has cut its emissions by around two-fifths since 1990, with almost all of its recent progress coming from the electricity sector.

Emissions from electricity generation have fallen rapidly in the decade since 2010 as coal power has been almost phased out and even gas output has declined. Fossil fuels have been displaced by falling demand and by renewables, such as wind, solar and biomass.

But Carbon Brief’s annual analysis of UK electricity generation shows progress stalled in 2019, with the output from low-carbon sources barely increasing compared to a year earlier.

The chart below shows low-carbon generation in each year since 2010 (grey bars) and the estimated level in 2019 (red). The pale grey bars show the estimated future output of existing low-carbon sources after old nuclear plants retire and the pale red bars show the amount of new generation needed to keep electricity sector emissions to less than 100 grammes of CO2 per kilowatt hour (gCO2/kWh), the UK’s nominal target for the sector.

 Annual electricity generation in the UK by fuel, terawatt hours, 2010-2019. Top panel: fuel by fuel. Bottom panel: cumulative total generation from all sources. Source: BEIS energy trends, BM Reports and Carbon Brief analysis. Chart by Carbon Brief using Highcharts.
As the chart shows, the UK will require significantly more low-carbon electricity over the next decade as part of meeting its legally binding climate goals.

The nominal 100gCO2/kWh target for 2030 was set in the context of the UK’s less ambitious goal of cutting emissions to 80% below 1990 levels by 2050. Now that the country is aiming to cut emissions to net-zero by 2050, that 100gCO2/kWh indicator is likely to be the bare minimum.

Even so, it would require a rapid step up in the pace of low-carbon expansion, compared to the increases seen over the past decade. On average, low-carbon generation has risen by 9TWh each year in the decade since 2010 – including a rise of just 1TWh in 2019.

Given scheduled nuclear retirements and rising demand expected by the Committee on Climate Change (CCC) – with some electrification of transport and heating – low-carbon generation would need to increase by 15TWh each year until 2030, just to meet the benchmark of 100gCO2/kWh.

For context, the 3.2 gigawatt (GW) Hinkley C new nuclear plant being built in Somerset will generate around 25TWh once completed around 2026. The world’s largest offshore windfarm, the 1.2GW Hornsea One scheme off the Yorkshire coast, will generate around 5TWh each year.

The new Conservative government is targeting 40GW of offshore wind by 2030, up from today’s figure of around 8GW. If policies are put in place to meet this goal, then it could keep power sector emissions below 100gCO2/kWh, depending on the actual performance of the windfarms built.

However, new onshore wind and solar, further new nuclear or other low-carbon generation, such as gas with carbon capture and storage (CCS), is likely to be needed if demand is higher than expected, or if the 100gCO2/kWh benchmark is too weak in the context of net-zero by 2050.

The CCC says it is “likely” to “reflect the need for more rapid deployment” of low-carbon towards net-zero emissions in its advice on the sixth UK carbon budget for 2033-2037, due in September.

Trading places
Looking more closely at UK electricity generation in 2019, Carbon Brief’s analysis shows why there was so little growth for low-carbon sources compared to the previous year.

There was another increase for wind power in 2019 (up 8TWh, 14%), with record wind generation as several large new windfarms were completed including the 1.2GW Hornsea One project in October and the 0.6GW Beatrice offshore windfarm in Q2 of 2019. But this was offset by a decline for nuclear (down 9TWh, 14%), due to ongoing outages for reactors at Hunterston in Scotland and Dungeness in Kent.

(Analysis of data held by trade organisation RenewableUK suggests some 0.6GW of onshore wind capacity also started operating in 2019, including the 0.2GW Dorenell scheme in Moray, Scotland.)

As a result of these movements, the UK’s windfarms overtook nuclear for the first time ever in 2019, becoming the country’s second-largest source of electricity generation, and earlier, wind and solar together surpassed nuclear in the UK as momentum built. This is shown in the figure below, with wind (green line, top panel) trading places with nuclear (purple) and gas (dark blue) down around 25% since 2010 but remaining the single-largest source.

 Annual electricity generation in the UK by fuel, terawatt hours, 2010-2019. Top panel: fuel by fuel. Bottom panel: cumulative total generation from all sources. Source: BEIS energy trends, BM Reports and Carbon Brief analysis. Chart by Carbon Brief using Highcharts.
The UK’s currently suspended nuclear plants are due to return to service in January and March, according to operator EDF, the French state-backed utility firm. However, as noted above, most of the UK’s nuclear fleet is set to retire during the 2020s, with only Sizewell B in Suffolk due to still be operating by 2030. Hunterston is scheduled to retire by 2023 and Dungeness by 2028.

Set against these losses, the UK has a pipeline of offshore windfarms, secured via “contracts for difference” with the government, at a series of auctions. The most recent auction, in September 2019, saw prices below £40 per megawatt hour – similar to current wholesale electricity prices.

However, the capacity contracted so far is not sufficient to meet the government’s target of 40GW by 2030, meaning further auctions – or some other policy mechanism – will be required.

Coal zero
As well as the switch between wind and nuclear, 2019 also saw coal fall below solar for the first time across a full year, echoing the 2016 moment when wind outgenerated coal across the UK, after it suffered another 60% reduction in electricity output. Just six coal plants remain in the UK, with Aberthaw B in Wales and Fiddlers Ferry in Cheshire closing in March.

Coal accounted for just 2% of UK generation in 2019, a record-low coal share since centralised electricity supplies started to operate in 1882. The fuel met 40% of UK needs as recently as 2012, but has plummeted thanks to falling demand, rising renewables, cheaper gas and higher CO2 prices.

The reduction in average coal generation hides the fact that the fuel is now often not required at all to meet the UK’s electricity needs. The chart below shows the number of days each year when coal output was zero in 2019 (red line) and the two previous years (blue).

 Cumulative number of days when UK electricity generation from renewable sources has been higher than that from fossil fuels. Source: BEIS energy trends, BM Reports and Carbon Brief analysis. Chart by Carbon Brief using Highcharts.
The 83 days in 2019 with zero coal generation amount to nearly a quarter of the year and include the record-breaking 18-day stretch without the fuel.

Great Britain has been running for a record TWO WEEKS without using coal to generate electricity – the first time this has happened since 1882.

The country’s grid has been coal-free for 45% of hours in 2019 so far.https://www.carbonbrief.org/countdown-to-2025-tracking-the-uk-coal-phase-out …

Coal generation was set for significant reductions around the world in 2019 – including a 20% reduction for the EU as a whole – according to analysis published by Carbon Brief in November.

Notably, overall UK electricity generation fell by another 9TWh in 2019 (3%), bringing the total decline to 58TWh since 2010. This is equivalent to more than twice the output from the Hinkley C scheme being built in Somerset. As Carbon Brief explained last year, falling demand has had a similar impact on electricity-sector CO2 emissions as the increase in output from renewables.

This is illustrated by the fact that the 9TWh reduction in overall generation translated into a 9TWh (6%) cut in fossil-fuel generation during 2019, with coal falling by 10TWh and gas rising marginally.

Increasingly renewable
As fossil-fuel output and overall generation have declined, the UK’s renewable sources of electricity have continued to increase. Their output has risen nearly five-fold in the past decade and their share of the UK total has increased from 7% in 2010 to 37% in 2019.

As a result, the UK’s increasingly renewable grid is seeing more minutes, hours and days during which the likes of wind, solar and biomass collectively outpace all fossil fuels put together, and on some days wind is the main source as well.

The chart below shows the number of days during each year when renewables generated more electricity than fossil fuels in 2019 (red line) and each of the previous four years (blue lines). In total, nearly two-fifths of days in 2019 crossed this threshold.

 Cumulative number of days when the UK has not generated any electricity from coal. Source: BEIS energy trends, BM Reports and Carbon Brief analysis. Chart by Carbon Brief using Highcharts.
There were also four months in 2019 when renewables generated more of the UK’s electricity than fossil fuels: March, August, September and December. The first ever such month came in September 2018 and more are certain to follow.

National Grid, which manages Great Britain’s high-voltage electricity transmission network, is aiming to be able to run the system without fossil fuels by 2025, at least for short periods. At present, it sometimes has to ask windfarm operators to switch off and gas plants to start running in order to keep the electricity grid stable.

Note that biomass accounted for 11% of UK electricity generation in 2019, nearly a third of the total from all renewables. Some two-thirds of the biomass output is from “plant biomass”, primarily wood pellets burnt at Lynemouth in Northumberland and the Drax plant in Yorkshire. The remainder was from an array of smaller sites based on landfill gas, sewage gas or anaerobic digestion.

The CCC says the UK should “move away” from large-scale biomass power plants, once existing subsidy contracts for Drax and Lynemouth expire in 2027.

Using biomass to generate electricity is not zero-carbon and in some circumstances could lead to higher emissions than from fossil fuels. Moreover, there are more valuable uses for the world’s limited supply of biomass feedstock, the CCC says, including carbon sequestration and hard-to-abate sectors with few alternatives.

Methodology
The figures in the article are from Carbon Brief analysis of data from BEIS Energy Trends chapter 5 and chapter 6, as well as from BM Reports. The figures from BM Reports are for electricity supplied to the grid in Great Britain only and are adjusted to include Northern Ireland.

In Carbon Brief’s analysis, the BM Reports numbers are also adjusted to account for electricity used by power plants on site and for generation by plants not connected to the high-voltage national grid. This includes many onshore windfarms, as well as industrial gas combined heat and power plants and those burning landfill gas, waste or sewage gas.

By design, the Carbon Brief analysis is intended to align as closely as possible to the official government figures on electricity generated in the UK, reported in BEIS Energy Trends table 5.1.

Briefly, the raw data for each fuel is in most cases adjusted with a multiplier, derived from the ratio between the reported BEIS numbers and unadjusted figures for previous quarters.

Carbon Brief’s method of analysis has been verified against published BEIS figures using “hindcasting”. This shows the estimates for total electricity generation from fossil fuels or renewables to have been within ±3% of the BEIS number in each quarter since Q4 2017. (Data before then is not sufficient to carry out the Carbon Brief analysis.)

For example, in the second quarter of 2019, a Carbon Brief hindcast estimates gas generation at 33.1TWh, whereas the published BEIS figure was 34.0TWh. Similarly, it produces an estimate of 27.4TWh for renewables, against a BEIS figure of 27.1TWh.

National Grid recently shared its own analysis for electricity in Great Britain during 2019 via its energy dashboard, which differs from Carbon Brief’s figures.


Related News

View more

Rising Solar and Wind Curtailments in California

California Renewable Energy Curtailment highlights grid congestion, midday solar peaks, limited battery storage, and market constraints, with WEIM participation and demand response programs proposed to balance supply-demand and reduce wasted solar and wind generation.


Key Points

It is the deliberate reduction of solar and wind output when grid limits or low demand prevent full integration.

✅ Grid congestion restricts transmission capacity

✅ Midday solar peaks exceed demand, causing surplus

✅ Storage, WEIM, and demand response mitigate curtailment


California has long been a leader in renewable energy adoption, achieving a near-100% renewable milestone in recent years, particularly in solar and wind power. However, as the state continues to expand its renewable energy capacity, it faces a growing challenge: the curtailment of excess solar and wind energy. Curtailment refers to the deliberate reduction of power output from renewable sources when the supply exceeds demand or when the grid cannot accommodate the additional electricity.

Increasing Curtailment Trends

Recent data from the U.S. Energy Information Administration (EIA) highlights a concerning upward trend in curtailments in California. In 2024, the state curtailed a total of 3,102 gigawatt-hours (GWh) of electricity generated from solar and wind sources, surpassing the 2023 total of 2,660 GWh. This represents a 32.4% increase from the previous year. Specifically, 2,892 GWh were from solar, and 210 GWh were from wind, marking increases of 31.2% and 51.1%, respectively, compared to the first nine months of 2023.

Causes of Increased Curtailment

Several factors contribute to the rising levels of curtailment:

  1. Grid Congestion: California's transmission infrastructure has struggled to keep pace with the rapid growth of renewable energy sources. This congestion limits the ability to transport electricity from generation sites to demand centers, leading to curtailment.

  2. Midday Solar Peaks: Amid California's solar boom, solar energy production typically peaks during the midday when electricity demand is lower. This mismatch between supply and demand results in excess energy that cannot be utilized, necessitating curtailment.

  3. Limited Energy Storage: While battery storage technologies are advancing, California's current storage capacity is insufficient to absorb and store excess renewable energy for later use. This limitation exacerbates curtailment issues.

  4. Regulatory and Market Constraints: Existing market structures and regulatory frameworks may not fully accommodate the rapid influx of renewable energy, leading to inefficiencies and increased curtailment.

Economic and Environmental Implications

Curtailment has significant economic and environmental consequences. For renewable energy producers, curtailed energy represents lost revenue and undermines the economic viability of new projects. Environmentally, curtailment means that clean, renewable energy is wasted, and the grid may rely more heavily on fossil fuels to meet demand, counteracting the benefits of renewable energy adoption.

Mitigation Strategies

To address the rising curtailment levels, California is exploring several strategies aligned with broader decarbonization goals across the U.S.:

  • Grid Modernization: Investing in and upgrading transmission infrastructure to alleviate congestion and improve the integration of renewable energy sources.

  • Energy Storage Expansion: Increasing the deployment of battery storage systems to store excess energy during peak production times and release it during periods of high demand.

  • Market Reforms: Participating in the Western Energy Imbalance Market (WEIM), a real-time energy market that allows for the balancing of supply and demand across a broader region, helping to reduce curtailment.

  • Demand Response Programs: Implementing programs that encourage consumers to adjust their energy usage patterns, such as shifting electricity use to times when renewable energy is abundant.

Looking Ahead

As California continues to expand its renewable energy capacity, addressing curtailment will be crucial to ensuring the effectiveness and sustainability of its energy transition. By investing in grid infrastructure, energy storage, and market reforms, the state can reduce curtailment levels and make better use of its renewable energy resources, while managing challenges like wildfire smoke impacts on solar output. These efforts will not only enhance the economic viability of renewable energy projects but also contribute to California's 100% clean energy targets by maximizing the use of clean energy and reducing reliance on fossil fuels.

While California's renewable energy sector faces challenges related to curtailment, proactive measures and strategic investments can mitigate these issues, as scientists continue to improve solar and wind power through innovation, paving the way for a more sustainable and efficient energy future.


Related News

View more

Lawmakers question FERC licensing process for dams in West Virginia

FERC Hydropower Licensing Dispute centers on FERC authority, Clean Water Act compliance, state water quality certifications, Federal Power Act timelines, and Army Corps dams on West Virginia's Monongahela River licenses.


Key Points

An inquiry into FERC's licensing process and state water quality authority for hydropower at Monongahela River dams.

✅ Questions on omitted state water quality conditions

✅ Debate over starting Clean Water Act certification timelines

✅ Potential impacts on states' rights and licensing schedules


As federal lawmakers, including Democrats pressing FERC, plan to consider a bill that would expand Federal Energy Regulatory Commission (FERC) licensing authority, questions emerged on Tuesday about the process used by FERC to issue two hydropower licenses for existing dams in West Virginia.

In a letter to FERC Chairman Neil Chatterjee, Democratic leaders of the House Energy and Commerce Committee, as electricity pricing changes were being debated, raised questions about hydropower licenses issued for two dams operated by the U.S. Army Corps of Engineers on the Monongahela River in West Virginia.

U.S. Reps. Frank Pallone Jr. (D-NJ), the ranking member of the Subcommittee on Energy, Bobby Rush (D-IL), the ranking member of the Subcommittee on Environment, and John Sarbanes (D-MD), amid Maryland clean energy enforcement concerns, questioned why FERC did not incorporate all conditions outlined in a West Virginia Department of Environmental Protection water quality certificate into plans for the projects.

“By denying the state its allotted time to review this application and submit requirements on these licenses, FERC is undermining the state’s authority under the Clean Water Act and Federal Power Act to impose conditions that will ensure water quality standards are met,” the letter stated.

The House of Representatives was slated to consider the Hydropower Policy Modernization Act of 2017, H.R. 3043, later in the week. The measure would expand FERC authority over licensing processes, a theme mirrored in Maine's transmission line debate over interstate energy projects. Opponents of the bill argue that the changes would make it more difficult for states to protect their clean water interests.

West Virginia has announced plans to challenge FERC hydropower licenses for the dams on the Monongahela River, echoing Northern Pass opposition seen in New Hampshire.


Related News

View more

Ottawa Launches Sewage Energy Project at LeBreton Flats

Ottawa Sewage Energy Exchange System uses wastewater heat recovery and efficient heat pumps to deliver renewable district energy, zero carbon heating and cooling, cutting greenhouse gas emissions at LeBreton Flats and scaling urban developments.


Key Points

A district energy system recovering wastewater heat via pumps to deliver zero carbon heating and cooling.

✅ Delivers 9 MW heating and cooling for 2.4M sq ft at LeBreton Flats

✅ Cuts 5,066 tonnes CO2e each year, reducing greenhouse gases

✅ Powers Odenak zero carbon housing via district energy


Ottawa is embarking on a groundbreaking initiative to harness the latent thermal energy within its wastewater system, in tandem with advances in energy storage in Ontario that strengthen grid resilience, marking a significant stride toward sustainable urban development. The Sewage Energy Exchange System (SEES) project, a collaborative effort led by the LeBreton Community Utility Partnership—which includes Envari Holding Inc. (a subsidiary of Hydro Ottawa) and Theia Partners—aims to revolutionize how the city powers its buildings.

Harnessing Wastewater for Sustainable Energy

The SEES will utilize advanced heat pump technology to extract thermal energy from the city's wastewater infrastructure, providing both heating and cooling to buildings within the LeBreton Flats redevelopment. This innovative approach eliminates the need for fossil fuels, aligning with Ottawa's commitment to reducing greenhouse gas emissions and promoting clean energy solutions across the province, including the Hydrogen Innovation Fund that supports new low-carbon pathways.

The system operates by diverting sewage from the municipal collection network into an external well, where it undergoes filtration to remove large solids. The filtered water is then passed through a heat exchanger, transferring thermal energy to the building's heating and cooling systems. After the energy is extracted, the treated water is safely returned to the city's sewer system.

Environmental and Economic Impact

Once fully implemented, the SEES is projected to deliver over 9 megawatts of heating and cooling capacity, servicing approximately 2.4 million square feet of development. This capacity is expected to reduce greenhouse gas emissions by approximately 5,066 tonnes annually—equivalent to the electricity consumption of over 3,300 homes for a year. Such reductions are pivotal in helping Ottawa meet its ambitious goal of achieving a 96% reduction in community-wide greenhouse gas emissions by 2040, as outlined in its Climate Change Master Plan and Energy Evolution strategy, and they align with Ontario's plan to rely on battery storage to meet rising demand across the grid.

Integration with the Odenak Development

The first phase of the SEES will support the Odenak development, a mixed-use project comprising two high-rise residential buildings. This development is poised to be Canada's largest residential zero-carbon project, echoing calls for Northern Ontario grid sustainability from community groups, featuring 601 housing units, with 41% designated as affordable housing. The integration of the SEES will ensure that Odenak operates entirely on renewable energy, setting a benchmark for future urban developments.

Broader Implications and Future Expansion

The SEES project is not just a localized initiative; it represents a scalable model for sustainable urban energy solutions that aligns with green energy investments in British Columbia and other jurisdictions. The LeBreton Community Utility Partnership is in discussions with the National Capital Commission to explore extending the SEES network to additional parcels within the LeBreton Flats redevelopment. Expanding the system could lead to economies of scale, further reducing costs and enhancing the environmental benefits.

Ottawa's venture into wastewater-based energy systems places it at the forefront of a growing trend in North America. Cities like Toronto and Vancouver have initiated similar projects, while related pilots such as the EV-to-grid pilot in Nova Scotia highlight complementary approaches, and European counterparts have long utilized sewage heat recovery systems. Ottawa's adoption of this technology underscores its commitment to innovation and sustainability in urban planning.

The SEES project at LeBreton Flats exemplifies how cities can repurpose existing infrastructure to create sustainable, low-carbon energy solutions. By transforming wastewater into a valuable energy resource, Ottawa is setting a precedent for environmentally responsible urban development. As the city moves forward with this initiative, it not only addresses immediate energy needs but also contributes to a cleaner, more sustainable future for its residents, even as the province accelerates Ontario's energy storage push to maintain reliability.


Related News

View more

Europe's stunted hydro & nuclear output may hobble recovery drive

Europe 2023 Energy Shortfall underscores how weak hydro and nuclear offset record solar and wind, tightening grids as natural gas supplies shrink and demand rebounds, heightening risks of electricity shortages across key economies.


Key Points

A regional gap as weak hydro and nuclear offset record solar and wind, straining supply as gas stays tight.

✅ Hydro and nuclear output fell sharply in early 2023

✅ Record solar and wind could not offset the deficit

✅ Industrial demand rebound pressures limited gas supplies


Shortfalls in Europe's hydro and nuclear output have more than offset record electricity generation from wind and solar power sites over the first quarter of 2023, leaving the region vulnerable to acute energy shortages for the second straight year.

European countries fast-tracked renewable energy capacity development in 2022 in the wake of Russia's invasion of Ukraine last February, which upended natural gas flows to the region and sent power prices soaring.

Europe lifted renewable energy supply capacity by a record 57,290 megawatts in 2022, or by nearly 9%, according to the International Energy Agency (IRENA), amid a scramble to replace imported Russian gas with cleaner, home-grown energy.

However, steep drops in both hydro and nuclear output - two key sources of non-emitting energy - mean Europe's power producers have limited ways to lift overall electricity generation, as the region is losing nuclear power at a critical moment, just as the region's economies start to reboot after last year's energy shock.

POWER PLATEAU
Europe's total electricity generation over the first quarter of 2023 hit 1,213 terawatt hours, or roughly 6.4% less than during the same period in 2022, according to data from think tank Ember.

At the same time, European power hits records during extreme heat as plants struggle to cool, exacerbating supply risks.

As Europe's total electricity demand levels were in post-COVID-19 expansion mode in early 2022 before Russia's so-called special operation sent power costs to record highs amid debates over how electricity is priced in Europe, it makes sense that overall electricity use was comparatively stunted in early 2023.

However, efforts are now underway to revive activity at scores of European factories, industrial plants and production lines that were shuttered or curtailed in 2022, so Europe's collective electricity consumption totals are set to trend steadily higher over the remainder of 2023.

With Russian natural gas unavailable in the previous quantities due to sanctions and supply issues, Europe's power producers will need to deploy alternative energy sources, including renewables poised to eclipse coal globally, to feed that increase in power demand.

And following the large jump in renewable capacity brought online in 2022, utilities can deploy more low-emissions energy than ever before across Europe's electricity grids.


Related News

View more

Sign Up for Electricity Forum’s Newsletter

Stay informed with our FREE Newsletter — get the latest news, breakthrough technologies, and expert insights, delivered straight to your inbox.

Electricity Today T&D Magazine Subscribe for FREE

Stay informed with the latest T&D policies and technologies.
  • Timely insights from industry experts
  • Practical solutions T&D engineers
  • Free access to every issue

Live Online & In-person Group Training

Advantages To Instructor-Led Training – Instructor-Led Course, Customized Training, Multiple Locations, Economical, CEU Credits, Course Discounts.

Request For Quotation

Whether you would prefer Live Online or In-Person instruction, our electrical training courses can be tailored to meet your company's specific requirements and delivered to your employees in one location or at various locations.