Electrical Commissioning In Industrial Power Systems
Our customized live online or in‑person group training can be delivered to your staff at your location.

- Live Online
- 12 hours Instructor-led
- Group Training Available
Regular Price:
$599
Coupon Price:
$499
The Environmental Protection Agency proposed a rule that would require a broad range of industries to tally and report their greenhouse gas emissions.
The proposal, which could establish an accounting basis for federal regulation of heat-trapping gases, would require about 13,000 factories, power plants and other facilities to report their emissions of carbon dioxide, methane, nitrous oxide and other gases that climate scientists link to global warming.
Oil refineries, cement makers, utilities and pulp and paper manufacturers and the automotive sector are among the industries covered by the proposal. The E.P.A. says that the rule, promulgated under the Clean Air Act, would account for 85 percent to 90 percent of the countryÂ’s emissions of heat-trapping gases, although small manufacturers would be exempt.
“We do not expect to have a significant impact on small businesses,” said Dina Kruger, the director of the agency’s climate change division.
A 60-day comment period and two public hearings will soon take place. Ms. Kruger said the agency hoped to make the rule final this fall. If that happens, reporting could begin in 2011, after the monitoring of 2010 emissions.
“This is the foundation of any serious program to cap and reduce global warming pollution,” said David Doniger, the policy director for the climate center at the Natural Resources Defense Council. “You have to have source-by-source data on how much of global warming pollution is emitted and from where.”
The E.P.A. estimated that the cost to industry would be $160 million in the first year, then fall to $127 million a year.
Bill Kovacs, the vice president for environment, technology and regulatory affairs for the United States Chamber of Commerce, noted that some manufacturers already volunteered the data.
Manufacturers would be required to report emissions from the vehicles they make. Charles Territo, a spokesman for the Alliance of Automobile Manufacturers, said that his organization was still reviewing the proposal, but that the reporting requirement was not new for the automobile industry.
“E.P.A. already knows the carbon dioxide emissions from automobiles,” Mr. Territo said, “because E.P.A. measures grams per mile of CO2 from automobiles.”
Experts said the proposal had been expected in September.
Related News
Britain Prepares for High Winter Heating and Electricity Costs
UK Energy Price Cap drives household electricity bills and gas prices, as Ofgem adjusts unit…
View more
Canada in top 10 for hydropower jobs, but doesn't rank on other renewables
Canada Renewable Energy Jobs rank top 10 in hydropower, says IRENA, but trail in solar…
View more

Ottawa sets out to protect its hydro heritage
Ottawa Hydro Substation Heritage Designation highlights Hydro Ottawa's 1920s architecture, Art Deco facades, and municipal…
View more
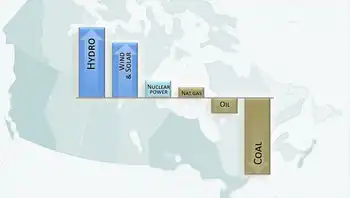
Canada's nationwide climate success — electricity
Canada Clean Electricity leads decarbonization, slashing power-sector emissions through coal phase-out, renewables like hydro, wind,…
View more

Europe's largest shore power plant opens
AIDAsol shore power Rostock-Warnemfcnde delivers cold ironing for cruise ships, up to 20 MVA at…
View more
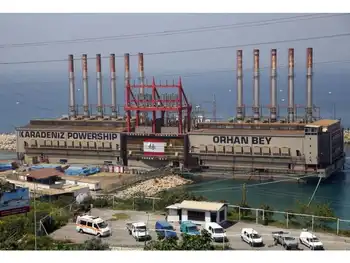
Lebanon Cabinet approves watershed electricity sector reform
Lebanon Electricity Sector Reform aims to overhaul tariffs, modernize the grid, cut fuel oil subsidies,…
View more
Sign Up for Electricity Forum’s Newsletter
Stay informed with our FREE Newsletter — get the latest news, breakthrough technologies, and expert insights, delivered straight to your inbox.
Electricity Today T&D Magazine Subscribe for FREE

Stay informed with the latest T&D policies and technologies.
- Timely insights from industry experts
- Practical solutions T&D engineers
- Free access to every issue
