Protective Relay Training - Basic
Our customized live online or in‑person group training can be delivered to your staff at your location.

- Live Online
- 12 hours Instructor-led
- Group Training Available
Regular Price:
$699
Coupon Price:
$599
Fisker Karma and Tesla Roadster headline premium EV news, covering plug-in hybrid design, series-hybrid powertrains, lithium-ion batteries, range and performance specs, pricing, dealers, and Chicago showroom openings, plus Model S plans and cold-weather testing.
At a Glance
They are premium electrified cars: Karma is a series plug-in hybrid sedan; Roadster is an all-electric sports car.
- Karma: 50-mile EV range; gasoline engine acts as generator only.
- GM-sourced 4-cyl engine; Valmet assembles in Finland.
- Orders open; US deliveries in 2010; starting at $87,900.
- Roadster: 244-mile range, 0-60 in 3.9s; $7,500 federal credit.
Electric vehicles and plug-in hybrids are two technologies that automakers are trying to develop for mainstream use, but two upstart California companies are leading the alternative vehicle world.
Tesla Motors already sells the only electric vehicle legal for highway use, while Fisker Automotive stands to be the first to bring a plug-in hybrid to market.
The Fisker Karma is a stylish sedan with a plug-in hybrid drivetrain. Also known as a series hybrid, it differs from the hybrids on the roads today in that the gasoline engine acts as a generator only. It has no mechanical connection to drive the wheels. The Karma will drive the first 50 miles on electric power only, drawing on Canadian batteries in its pack, after which the gasoline engine will start up as needed to make electricity.
The Karma captures energy used to slow the car down via regenerative braking. Sound familiar? Yes, it’s the same idea as the Chevrolet Volt. In fact, the Karma will use some General Motors parts, including the four-cylinder engine to supplement the hybrid electric drive provided by partner Quantum Technologies. The vehicles will be assembled in Finland by Valmet Automotive, builders of the Porsche Boxster. Fisker showed the production version of the Karma at the 2009 North American International Auto Show in January, as the electric auto fleet moved a few steps closer, along with a concept version of a hardtop convertible. The Karma sedan made its first public “driving debut” earlier this month at the Laguna Seca Raceway.
Orders are being taken for both models, with deliveries of the Karma sedan scheduled to start in 2010. Prices start at $87,900, raising the question of whether consumers can afford an EV in this class. Fisker Automotive has chosen the Patrick and Fields dealer groups to market the Karma in the Chicago area. For now Fisker has decided to work with established dealers with experience in selling luxury brands rather than building new dealerships. They are also not requiring their dealers to stock vehicles beyond demo and display units.
The Tesla Roadster is a two-seat electric car with a stated range of 244 miles and 0-to-60 acceleration of 3.9 seconds. Lotus builds the chassis in England and assembles the bodies. It has a family resemblance to the Lotus Elise, though it actually shares very few parts. The electric motor, controller and lithium ion battery pack are installed at Tesla’s headquarters in San Carlos, Calif. The Roadster base price is $109,000 and qualifies for a $7,500 federal tax credit. Tesla also offers an even faster, more performance-oriented Roadster Sport, and a recent Toronto test drive showcased its appeal.
Tesla Motors has already delivered more than 500 Roadsters. “We are opening our first stores based on the number of current customers we have in each market. We already have several dozen Roadsters on the roads in Chicago and the Chicagoland region,” said Rachel Konrad, Tesla spokesperson.
Tesla is opening a stand-alone store in Chicago, with a VIP customer reception on September 10 followed by a public open house the next two days. Tesla wants its locations, which are all company owned, to be more like Apple stores or Starbuck’s than a traditional car dealership, a strategy many e-car startups use to compete with major automakers today.
The master plan is to launch a new car, built in California, in 2012, with follow-up models to broaden the lineup.
"In addition to having numerous customers in the area for the Roadster, we anticipate that the region will be an excellent one for the Model S sedan, which is our next car," Konrad said. "The Model S has half the sticker price of the Roadster and will also be offered in all-wheel drive, which a lot of customers want in the upper Midwest."
When asked how the sporty alternative Roadster might fare in our climate, Konrad said, "It's important to note that we do our cold-weather testing literally on a frozen lake in Sweden near the Arctic Circle. We do our hot-weather battery testing in south Texas. Two of our best national markets outside of the United States are Canada and Norway. So it’s very safe to say that we do not have problems in cold weather.
Also, we offer two hard-top options on the Roadster and as you can imagine they are very popular in northern climates, while the standard soft-top is popular in California, Texas, Florida and Hawaii."
Related News
Related News
Europe's EV Slump Sounds Alarm for Climate Goals
Europe EV Sales Slowdown signals waning incentives, economic uncertainty, and supply chain constraints, threatening climate…
View more
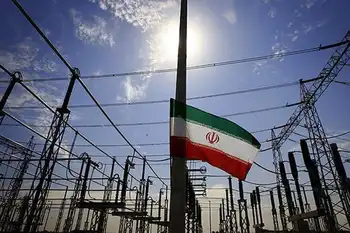
Iran eyes transmitting electricity to Europe as region’s power hub
Iran Electricity Grid Synchronization enables regional interconnection, cross-border transmission, and Caspian-Europe energy corridors, linking Iraq,…
View more
Canada expected to miss its 2035 clean electricity goals
Canada 2035 Clean Electricity Target faces a 48.4GW shortfall as renewable capacity lags; accelerating wind,…
View more

Iran turning thermal power plants to combined cycle to save energy
Iran Combined-Cycle Power Plants drive energy efficiency, cut greenhouse gases, and expand megawatt capacity by…
View more
Data Center Boom Poses a Power Challenge for U.S. Utilities
U.S. Data Center Power Demand is straining electric utilities and grid reliability as AI, cloud…
View more
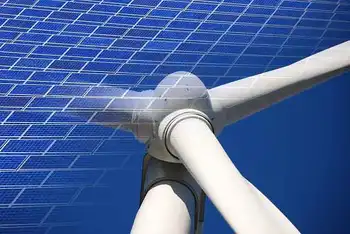
Minister approves 30-megawatt wind farm expansion in Eastern Kings
Eastern Kings Wind Farm Expansion advances P.E.I. renewable energy with seven new wind turbines, environmental…
View more
Sign Up for Electricity Forum’s Newsletter
Stay informed with our FREE Newsletter — get the latest news, breakthrough technologies, and expert insights, delivered straight to your inbox.
Electricity Today T&D Magazine Subscribe for FREE

Stay informed with the latest T&D policies and technologies.
- Timely insights from industry experts
- Practical solutions T&D engineers
- Free access to every issue

