Protective Relay Training - Basic
Our customized live online or in‑person group training can be delivered to your staff at your location.

- Live Online
- 12 hours Instructor-led
- Group Training Available
Regular Price:
$699
Coupon Price:
$599
Energy efficiency program charges fuel debate as the Public Service Commission sets goals, with Tampa Electric and Progress Energy passing rebates, checks, and light bulbs to the rate base, raising bills for low-income customers.
The Main Points
Utility fees that fund rebates and audits, set by regulators and recovered via rate-base charges on bills.
- PSC to set statewide energy savings goals
- Costs passed to rate base raise monthly bills
- Progress Energy charge: $2.70 per 1,000 kWh
It turns out, those "free" energy audits and weatherization programs offered by our local utilities aren't really free.
As with any rebate or "free" thing, somebody has to pay for it because, ultimately, it costs someone, something. In this case, that someone is you, the energy company customer.
Why does this matter right now, other than the hit you take in the pocketbook each month as an energy customer? Because the state is about to decide just how much those free programs should cost you.
The state Public Service Commission is set to vote on the state's goals for energy savings. Whatever the commission decides, utilities like Tampa Electric and Progress Energy will respond with a set of plans on how to achieve those goals.
They come in the form of "free" energy efficient light bulbs to customers through a voluntary bulb plan offered by some utilities, "free" home energy use checks, and rebates for energy efficient appliances.
"Utilities are allowed to pass those on to the rate base," said J.R. Kelly, the state public counsel, noting that many utilities seek money for less power under such mandates today.
For example, this year, Progress Energy customers pay $2.70 a month per 1,000 kilowatt hours of electricity into the utility's energy saving program even as some bills may drop next year for area households. The average customer uses about 1,200 kilowatts hours a month, so that's about $38 for the year tacked onto the bill.
Many customers fail to take advantage of the energy saving offers, even though they are paying for them and could access home heating help resources from utilities. Suzanne Grant, a spokeswoman for Progress Energy, said some 30 percent of low-income customers eligible for the weatherization program do not use it. Progress Energy offers that to specific communities in its 35-county coverage area on a predetermined schedule.
But anyone can request the home energy check or enroll in TECO's energy planner program to better manage usage. It's called "free," but the reality is, as Grant states, "this is something we offer for no additional charge."
No matter which customers take advantage of the programs - rich, poor, big house or small - every customer subsidizes the cost. Should a low-income person help pay for the new energy efficient air conditioning units installed in a multi-million-dollar home?
It's a tough balancing act, Kelly said, especially with so many people suffering from the economic downturn.
"It's a concern," Kelly said. "Do you not implement any program?"
Grant, the Progress spokeswoman, said the utility is concerned about how the state's final decision on the energy savings plan will affect customers struggling through tight financial times.
"If the commission goes with the more aggressive approach, that would increase the bills," Grant said. "We feel energy efficiency is really important. Our concern is at what cost to our customers?"
Progress Energy and Tampa Electric announced that customers would save $4 to $5 a month based on 1,000 kilowatt hours of usage because of lower fuel costs, with TECO expecting lower bills in January for many. That savings could be offset and surpassed by the potential increase in the energy savings program charges.
Related News
Related News
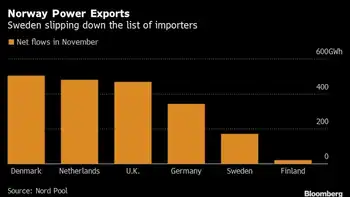
Europe's Thirst for Electricity Spurs Nordic Grid Blockade
Nordic Power Grid Dispute highlights cross-border interconnector congestion, curtailed exports and imports, hydropower priorities, winter…
View more

Trump's Pledge to Scrap Offshore Wind Projects
Trump Offshore Wind Pledge signals a push for deregulation over renewable energy, challenging climate policy,…
View more

Hinkley C nuclear reactor roof lifted into place
Hinkley Point C dome lift marks a nuclear reactor milestone in Somerset, as EDF used…
View more
FPL Proposes Significant Rate Hikes Over Four Years
FPL Rate Increase Proposal 2026-2029 outlines $9B base-rate hikes as Florida grows, citing residential demand,…
View more

Philippines Ranks Highest in Coal-Generated Power Dependency
Philippines coal dependency underscores energy transition challenges, climate change risks, and air pollution, as rising…
View more
Cheaper electricity rate for customers on First Nations not allowed, Manitoba appeal court rules
Manitoba Hydro Court Ruling affirms the Public Utilities Board exceeded its jurisdiction by ordering a…
View more
Sign Up for Electricity Forum’s Newsletter
Stay informed with our FREE Newsletter — get the latest news, breakthrough technologies, and expert insights, delivered straight to your inbox.
Electricity Today T&D Magazine Subscribe for FREE

Stay informed with the latest T&D policies and technologies.
- Timely insights from industry experts
- Practical solutions T&D engineers
- Free access to every issue

