Protective Relay Training - Basic
Our customized live online or in‑person group training can be delivered to your staff at your location.

- Live Online
- 12 hours Instructor-led
- Group Training Available
Regular Price:
$699
Coupon Price:
$599
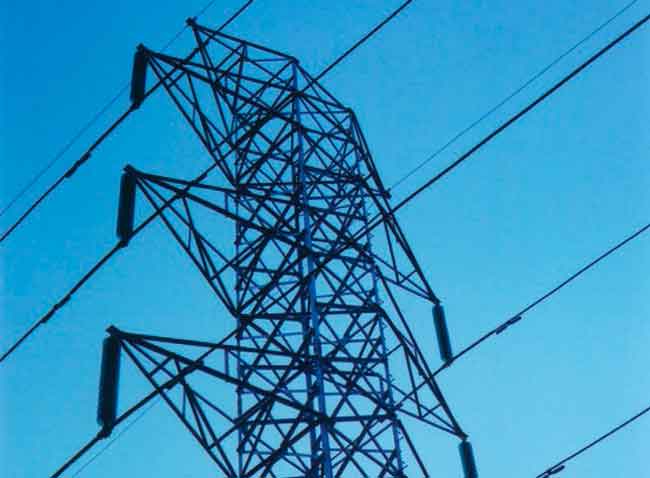
Progress Energy is exploring the possibility of building a new nuclear plant as the company looks at economical ways to supply North Carolina's future energy needs.
The Raleigh-based utility's top executive said he expects company officials will decide within two years what type of energy will best meet anticipated electricity demand.
But the cheapest, cleanest and wisest fuel source would be nuclear, and a natural site for a new reactor would be to expand at the company's Shearon Harris Nuclear Plant in southern Wake County, chief executive Robert McGehee said in an interview.
The company is well aware of the controversy such a decision would generate, and that many people associate nuclear plants with accidents at Three Mile Island and Chernobyl. But McGehee said public opinion could be swayed if the federal government adopted a national energy policy favoring nuclear power.
"The only long-term solution is to do what they're doing in Europe: It is to have some kind of renaissance of nuclear power in this country," McGehee said. "I think it's just a perfect environmental solution, but I know there are other opinions on this."
Four utilities, including Duke Energy in Charlotte, have taken preliminary steps toward getting approval from federal regulators to build a nuclear plant. Duke, whose service area includes Durham, will decide possibly next month whether to build a nuclear plant, and would choose a site by year's end.
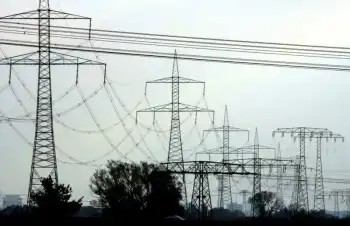
Progress Energy anticipates it will need a new power plant by 2017, and it will finish plans in time to give itself a decade to undertake the project. The utility, which serves 2.9 million customers in the Carolinas and Florida, might decide to build another natural-gas plant, the most common fuel source used in the past decade.
But officials are evaluating new nuclear-plant technology that could be added at the company's 18-year-old Shearon Harris site, about 25 miles south of Raleigh.
"Talking just hypothetically - and I know there are a lot of issues here in Wake County - here's where our load is and here's where growth is," McGehee said. "Here's where we need electricity -- we need it in the Triangle area. Now, I know there are hundreds of other issues that may outweigh that, but it's a very good site, it's built for multiple reactors, and it's where the load is."
Progress Energy operates two nuclear plants in North Carolina -- the Harris plant and the 30-year-old Brunswick Nuclear Plant near Southport. The Harris plant, which began operating in 1987, was the last operating nuclear plant to receive a construction permit in this country.
Some environmental analysts predict pitched battles if Duke or Progress pursue the nuclear option in North Carolina.
"There would be a wide range of opposition tactics - everything from scientific arguments to street protests," said Jim Warren, executive director of N.C. Waste Awareness Reduction Network, or WARN.
Disposing of radioactive nuclear waste remains an impediment to a revival of nuclear power. In Europe, nuclear fuel rods are recycled and reused, but that process is illegal in the United States. Nuclear plants are temporarily storing spent fuel rods, and a controversial plan to create a permanent underground storage facility at Yucca Mountain in Nevada has been stalled for years.
McGehee said the Yucca Mountain project could be revived with offers of financial incentives to Nevada, but a permanent storage site will go nowhere without federal intervention. "Something has to change to get this thing moving," McGehee said.
Additionally, McGehee said the future of nuclear power depends on state regulators allowing utilities to recover nuclear construction costs by raising rates. Progress Energy is lobbying state and federal lawmakers to promote nuclear power.
"It's necessary to get people really building again," McGehee said.
Related News

4 ways the energy crisis hits U.S. electricity, gas, EVs
U.S. Energy Crunch disrupts fuel and power markets, driving natural gas price spikes, coal resurgence,…
View more
Schneider Electric Aids in Notre Dame Restoration
Schneider Electric Notre Dame Restoration delivers energy management, automation, and modern electrical infrastructure, boosting safety,…
View more
Alberta's Path to Clean Electricity
Alberta Clean Electricity Regulations face federal mandates and provincial autonomy, balancing greenhouse gas cuts, net-zero…
View more
Tesla updates Supercharger billing to add cost of electricity use for other than charging
Tesla Supercharger Billing Update details kWh-based pricing that now includes HVAC, battery thermal management, and…
View more
Groups clash over NH hydropower project
Northern Pass Hydropower Project Rehearing faces review by New Hampshire's Site Evaluation Committee as Eversource…
View more
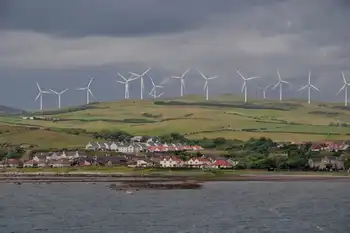
Scotland’s Wind Farms Generate Enough Electricity to Power Nearly 4.5 Million Homes
Scotland Wind Energy delivered record renewable power as wind turbines and farms generated 9,831,320 MWh…
View more
Sign Up for Electricity Forum’s Newsletter
Stay informed with our FREE Newsletter — get the latest news, breakthrough technologies, and expert insights, delivered straight to your inbox.
Electricity Today T&D Magazine Subscribe for FREE

Stay informed with the latest T&D policies and technologies.
- Timely insights from industry experts
- Practical solutions T&D engineers
- Free access to every issue
