Electric Vehicle Adoption Barriers include range anxiety, charging infrastructure, and cost parity; consumer demand, tax credits, lithium-ion batteries, and performance benefits are accelerating EV uptake, pushing SUVs and self-driving tech toward mainstream mobility.
Key Points
They are the key hurdles to mainstream EV uptake: range anxiety, sparse charging networks, and high upfront costs.
✅ Range targets of 300+ miles reduce anxiety and match ICE convenience
✅ Expanded home, work, and public charging speeds adoption
✅ Falling battery costs and incentives drive price parity
The automotive industry is hurtling toward a future that will change transportation the same way electricity changed how we light the world. Electric and self-driving vehicles will alter the automotive landscape forever — it's only a question of how soon, and whether the age of electric cars arrives ahead of schedule.
Like any revolution, this one will be created by market demand.
Beyond the environmental benefit, electric vehicle owners enjoy the performance, quiet operation, robust acceleration, style and interior space. And EV owners like not having to buy gasoline. We believe the majority of these customers will stay loyal to electric cars, and U.S. EV sales are soaring into 2024 as this loyalty grows.
But what about non-EV owners? Will they want to buy electric, and is it time to buy an electric car for them yet? About 25 years ago, when we first considered getting into the electric vehicle business with a small car that had about 70 miles of range, the answer was no. But today, the results are far more encouraging.
We recently held consumer clinics in Los Angeles and Chicago and presented people with six SUV choices: three gasoline and three electric. When we asked for their first choice to purchase, 40% of the Chicago respondents chose an electric SUV, and 45% in LA did the same. This is despite a several thousand-dollar premium on the price of the electric models, and despite that EV sales still lag gas cars nationally today, consumer interest was strong (but also before crucial government tax credits that we believe will continue to drive people toward electric vehicles and help fuel market demand).
They had concerns, to be sure. Most people said they want vehicles that can match gasoline-powered vehicles in range, ease of ownership and cost. The sooner we can break down these three critical barriers, the sooner electric cars will become mainstream.
Range
Range is the single biggest barrier to EV acceptance. Just as demand for gas mileage doesn't go down when there are more gas stations, demand for better range won't ease even as charging infrastructure improves. People will still want to drive as long as possible between charges.
Most consumers surveyed during our clinics said they want at least 300 miles of range. And if you look at the market today, which is driven by early adapters, electric cars have hit an inflection point in demand, and the numbers bear that out. The vast majority of electric vehicles sold — almost 90% — are six models with the highest range of 238 miles or more — three Tesla models, the Chevrolet Bolt EV, the Hyundai Kona and the Kia Niro, according to IHS Markit data.
Lithium-ion batteries, which power virtually all electric cars on the road today, are rapidly improving, increasing range with each generation. At GM, we recently announced that our 2020 Chevrolet Bolt EV will have a range of 259 miles, a 21-mile improvement over the previous model. Range will continue to improve across the industry, and range anxiety will dissipate.
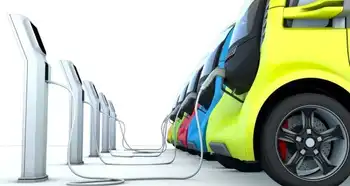
Charging infrastructure
Our research also shows that, among those who have considered buying an electric vehicle, but haven't, the lack of charging stations is the number one reason why.
For EVs to gain widespread acceptance, manufacturers, charging companies, industry groups and governments at all levels must work together to make public charging available in as many locations as possible. For example, we are seeing increased partnership activity between manufacturers and charging station companies, as well as construction companies that build large infrastructure projects, as the American EV boom approaches, with the goal of adding thousands of additional public charging stations in the United States.
Private charging stations are just as important. Nearly 80% of electric vehicle owners charge their vehicles at home, and almost 15% at work, with the rest at public stations, our research shows. Therefore, continuing to make charging easy and seamless is vital. To that end, more partnerships with companies that will install the chargers in consumers' homes conveniently and affordably will be a boon for both buyers and sellers.
Cost
Another benefit to EV ownership is a lower cost of operation. Most EV owners report that their average cost of operation is about one-third of what a gasoline-powered car owner pays. But the purchase price is typically significantly higher, and that's where we should see change as each generation of battery technology improves efficiency and reduces cost.
Looking forward, we think electric vehicle propulsion systems will achieve cost parity with internal combustion engines within a decade or sooner, and will only get better after that, driving sticker prices down and widening the appeal to the average consumer. That will be driven by a number of factors, including improvements with each generation of batteries and vehicles, as well as expected increased regulatory costs on gasoline and diesel engines.
Removing these barriers will lead to what I consider the ultimate key to widespread EV adoption — the emergence of the EV as a consumer's primary vehicle — not a single-purpose or secondary vehicle. That will happen when we as an industry are able to offer the utility, cost parity and convenience of today's internal combustion-based cars and trucks.
To get the electric vehicle to first-string status, manufacturers simply must make it as good or better than the cars, trucks and crossovers most people are used to driving today. And we must deliver on our promise of making affordable, appealing EVs in the widest range of sizes and body styles possible. When we do that, electric vehicle adoption and acceptance will be widespread, and it can happen sooner than most people think.
Mark Reuss is president of GM. The opinions expressed in this commentary are his own.
Related News