Smart Meter Texas real-time pricing faces rollback as utilities limit on-demand reads, impacting demand response, home area networks, ERCOT wholesale tracking, and thermostat automation, reducing efficiency gains promised through deregulation and smart meter investments.
Key Points
A plan linking smart meters to ERCOT prices, enabling near real-time usage alignment and automated demand response.
✅ Twice-hourly reads miss 15-minute ERCOT price spikes.
✅ Less than 1% of 7.3M meters use HAN real-time features.
✅ Limits hinder automation for HVAC, EV charging, and pool pumps.
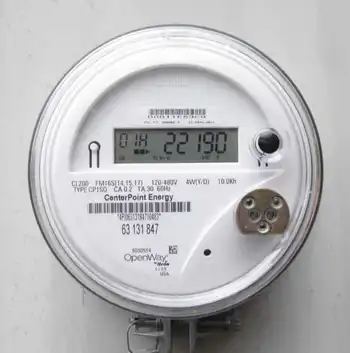
Utilities made a promise several years ago when they built Smart Meter Texas that they’d come up with a way for consumers to monitor their electricity use in real time. But now they’re backing out of the deal with the approval of state regulators, leaving in the lurch retail power companies that are building their business model on the promise of real time pricing and denying consumers another option for managing their electricity costs.
Texas utilities collected higher rates to finance the building of a statewide smart meter network that would allow customers to track their electricity use and the quickly changing prices on wholesale power markets almost as they happened. Some retailers are building electricity plans around this promise, providing customers with in-home devices that would eventually track pricing minute-by-minute and allow them to automatically turn down or shut off air conditioners, pool pumps and energy sucking appliances when prices spiked on hot summer afternoons and turn them back on when they prices fell again.
The idea is to help save consumers money by allowing them to shift their electricity consumption to periods when power is cheaper, typically nights and weekends, even as utility revenue in a free-power era remains a debated topic.
“We’re throwing away a large part of (what) ratepayers paid for,” said John Werner, CEO of GridPlus Texas, one of the companies offering consumers a real-time pricing plan that is scheduled to begin testing next month. “They made the smart meters dumb meters.”
When Smart Meter Texas was launched a decade ago by a consortium of the state’s biggest utilities, it was considered an important part of deregulation. The competitive market for electricity held the promise that consumers would eventually have the technology to control their electricity use through a home area network and cut their power bills.
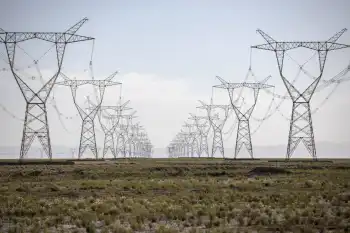
Regulators and legislators also were enticed by the possibility of making the electric system more efficient and relieving pressure on the power grid as consumers responded to high prices and cut consumption when temperatures soared, with ongoing discussions about Texas grid reliability informing policy choices.
One study found that smart meters coupled with smart real time consumption monitors could reduce electricity use between 3 percent and 5 percent, according to Call Me Power, a website sponsored by the European electricity price shopping service Selectra.
But utilities complained that the home area network devices were expensive to install and not used very often, and, with flat electricity demand weighing on growth, they questioned further investment. CenterPoint manager Esther Floyd Kent filed an affidavit with the commission in May that it costs the utility about $30,000 annually to support the network devices, plus maintenance.
Over a six-year period, CenterPoint paid $124,500, or about $20,000 a year, to maintain the system. As of April, there were only 4,067 network devices in CenterPoint’s service area, meaning the utility pays about $30.70 each year to maintain each device.
Centerpoint last year generated $9.6 billion in revenues and earned a $1.8 billion profit, according to its financial filings. CenterPoint officials did not respond to requests for comment.
Other utilities that are part of the Smart Meter consortium also complained to the Public Utility Commission that, up to now, the system hasn’t developed. All told, Texas has 7.3 million meters connected to Smart Meter Texas, but less than 1 percent are using the networking functions to track real-time prices and consumption, according to the testimony of Donny R. Helm, director of technology strategy and architecture for the state’s largest utility Oncor Electric Delivery Co. in Dallas.
The isssue was resolved recently through a settlement agreement that limits on-demand readings to twice an hour that Smart Meter Texas must provide customers. The price of power changes every 15 minutes, so a twice an hour reading may miss some price spikes.
The Public Utility Commission signed off on the deal, and so did several other groups including several retail electricity providers and the Office of Public Utility Counsel which represents residential customers and small businesses.
Michele Gregg, spokeswoman for the Public Utility Counsel, testified in December that the consumer advocate supported the change because widespread use of the networks never materialized. Catherine Webking, an Austin lawyer who represents the Texas Energy Association for Marketers, a group of retail electric providers, said she believes the deal was a reasonable resolution of providing the benefits of Smart Meter Texas while not incurring too much cost.
But Griddy, an electricity provider that offers customers the opportunity to pay wholesale power prices, which also issued a plea to customers during a price surge, said the state hasn’t given the smart-meter networks a chance and could miss out on its potential. Griddy was counting on the continued adoption of real time pricing as the next step for customers wanting to control their electricity costs.
Right now, Griddy sends out price alerts from the grid operator Electric Reliability Council of Texas so businesses like hotels can run washers and dryers when electricity prices are cheapest. But the company was counting on a smart-meter program that would allow customers to track wholesale prices and manage consumption themselves, making Griddy’s offerings attractive to more people.
Wholesale prices are generally cheaper than retail prices, but they can fluctuate widely, especially when the Texas power grid faces another crisis during extreme weather. Last year, wholesale prices averaged less than 3 cents per kilowatt hour, much lower than than retail rates that now are running above 11 cents, but they can spike at times of high demand to as much as $9 a kilowatt hour.
What customers want is to be able to use energy when it’s cheapest, said Greg Craig, Griddy’s CEO, and they want to do it automatically. They want to be able to program their thermostat so that if the price rises they can shut off their air conditioning and if the price falls, they can charge their electric-powered vehicle.
Griddy customers may still save money even without real time data, he said. But they won’t be able to see their usage in real time or see how much they’re spending.
“The big utilities have big investments in the existing way and going to real time and more transparency isn’t really in their best interest,” said Craig.
Related News