Lebanon Power Barge Controversy spotlights Karadeniz Energy's Esra Sultan, Lebanon's electricity crisis, prolonged blackouts, and sectarian politics as Amal and Hezbollah clash over Zahrani vs Jiyeh docking and allocation across regions.
Key Points
A political dispute over the Esra Sultan power ship, its docking, and power allocation amid Lebanon's chronic blackouts.
✅ Karadeniz Energy lent a third barge at below-market rates.
✅ Docking disputes: Zahrani refused; Jiyeh limited; Zouq connected.
✅ Amal vs Hezbollah split exposes sectarian energy politics.
It was supposed to be a goodwill gesture from an energy company in Turkey.
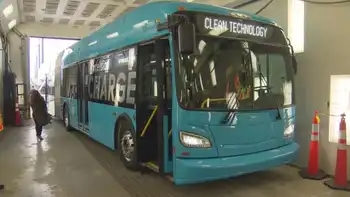
This summer, the Karadeniz Energy Group lent Lebanon a floating power station to generate electricity at below-market rates to help ease the strain on the country's woefully undermaintained power sector.
Instead, the barge's arrival opened a Pandora's box of partisan mudslinging in a country hobbled by political sectarianism and dysfunction.
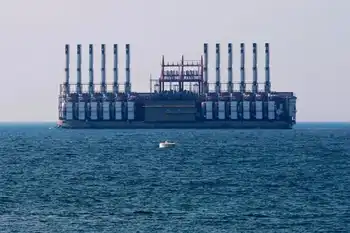
There have been rows over where it should dock, how to allocate its 235 megawatts of power, and even what to call the barge, echoing controversies like the Maine electric line debate that pit local politics against energy needs.
It has even driven a wedge between Lebanon's two dominant parties among Shiite Muslims: Amal and the militant group Hezbollah.
Amal, which has held the parliament speaker's seat since 1992, revealed sensationally last week it had refused to allow the boat to dock in a port in the predominantly Shiite south, even though it is one of the most underserved regions of Lebanon.
Power outages in the south can stretch on for more than 12 hours a day, much like the Gaza electricity crisis, according to regional observers.
Hezbollah, which normally stands pat with Amal in political matters, issued an exceptional statement that it had nothing to do with the matter of the barge at Zahrani port. A Hezbollah lawmaker went further to say his party disagreed on the issue with Amal.
Ali Hassan Khalil, Lebanon's Finance Minister and a leading Amal party member, said southerners wanted a permanent power station, not a stop-gap solution, in an implied dig at the rival Free Patriotic Movement, a Christian party that runs the Energy Ministry.
But critics seized on the statement as confirmation that Amal's leaders were in bed with the operators of private generators, who have been making fortunes selling electricity during blackouts at many times the state price.
"For decades there's been nothing stopping them from building a power plant," said Mohammad Obeid, a former Amal party official, in an interview with Lebanon's Al Jadeed TV station.
"Now there's a barge that's coming for three months to provide a few more hours of electricity -- and that's the issue?"
Hassan Khalil, reached by phone, refused to comment.
Nabih Berri, Amal's chief and Lebanon's parliament speaker, who has long been the subject of critical coverage from Al Jadeed's, sued the TV channel for libel on Wednesday for its reporting.
Energy Minister Cesar Abi Khalil, a Christian, lashed out at Amal, saying the ministry even changed the barge's name from Ayse, Turkish for Aisha, a name associated in Lebanon with Sunnis, to Esra Sultan, which does not carry any Shiite or Sunni connotations, to try to get it to dock in Zahrani.
Karadeniz said the barge was renamed "out of courtesy and respect to local customs and sensitivities."
"Ayse is a very common Turkish name, where such preferences are not as sensitive as in Lebanon," it said in a statement to The Associated Press.
Finally, on July 18, the barge docked in Jiyeh, a harbour south of Beirut but north of Zahrani, and in a religiously mixed Muslim area.
But two weeks later it was unmoored again, after Abi Khalil, the energy minister, said the infrastructure at Jiyeh could only handle 30 megawatts of the Esra Sultan's 235 capacity, and upgrades such as burying subsea cables are expensive.
With Zahrani closed to the Esra Sultan, it could only go to Zouq Mikhael, a port in the Christian-dominated Kesrouan region in the north, where it was plugged to the grid Tuesday night, giving the region almost 24 hours of electricity a day.
Lebanon has been contending with rolling blackouts since the days of its 1975-1990 civil war. Successive governments have failed to agree on a permanent solution for the chronic electricity failures, largely because of profiteering, endemic corruption and lack of political will, despite periodic pushes for electricity sector reform in Lebanon over the years.
In 2013, the Energy Ministry contracted with Karadeniz to buy electricity from a pair of its barges, which are still docked in Jiyeh and Zouq Mikhael.
This summer, Abi Khalil signed a new contract with Karadeniz to keep the barges for another three years. As part of the deal, Karadeniz agreed to lend Lebanon the third barge, the Esra Sultan, to produce electricity for three months at no cost - Lebanon would just have to pay for the fuel.
The company said Lebanon's internal squabbles do not affect how long the Esra Sultan would stay in Lebanon, even amid wider sector volatility and the pandemic's impact highlighted in a recent financial update. It arrived on July 18 and it will leave on Oct. 18, it said.
Related News