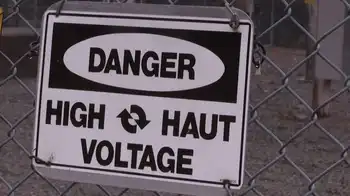
Load Management Standards May Facilitate Effectiveness of Demand Response Programs

By PRNewswire


CSA Z462 Arc Flash Training - Electrical Safety Essentials

Our customized live online or in‑person group training can be delivered to your staff at your location.

  • Live Online
  • 6 hours Instructor-led
  • Group Training Available
Regular Price:
$249
Coupon Price:
$199
Reserve Your Seat Today
Faced with a deficit in meeting its demand response (DR) goals, the California Energy Commission held a workshop on June 5 in Sacramento to consider the imposition of load management standards.

In a white paper prepared for the Energy Commission, The Brattle Group reviewed California's early history with load management standards and provided options that could increase the effectiveness and penetration of load management and demand response programs. After evaluating the reasons for the current DR deficit, the white paper discussed how government standards could be used to overcome it. An encouraging example is provided by the state's appliance and building efficiency standards, which have contributed half of the gain in energy efficiency over the past three decades.

The Brattle Group's white paper contains three illustrative proposals for achieving the state's DR potential. The first is a pricing standard that would make dynamic pricing the default tariff for all customer classes. The second and third proposals provide enabling technologies that would make it easy for customers to respond to dynamic pricing. They would mandate that programmable communicating thermostats be installed in all residential and small commercial and industrial buildings and that automated demand response software, which works with energy management and control systems, be installed in medium and large commercial and industrial buildings.

Ahmad Faruqui, a principal at The Brattle Group who led the research, noted that in the absence of standards, DR in California is likely to yield a drop of only three percent in the state's peak demand. Faruqui concluded, "With all three illustrative standards in place, a load drop of 15 percent becomes feasible. This would yield a reduction of $8.5 billion in the state's electricity costs over a 20-year horizon."

The Brattle Group provides consulting services and expert testimony in economics and finance to corporations, law firms, and public agencies worldwide. We are active in a wide range of areas including antitrust and competition, valuation and damages, and regulation and planning in network industries.

Related News

$1 billion per year is being spent to support climate change denial

Climate Change Consensus and Disinformation highlights the 97% peer-reviewed agreement on human-caused warming, IPCC warnings, and how fossil fuel lobbying, misinformation, and astroturf tactics echo tobacco denial to mislead media and voters.


Key Points

Explains the 97% scientific consensus and the disinformation that obscures IPCC findings and misleads the public.

✅ 97% peer-reviewed consensus on human-caused climate change

✅ Fossil fuel funding drives denial and media misinformation

✅ IPCC and major scientific bodies confirm severe impacts


Orson Johnson says there is no scientific consensus on climate change. He’s wrong. A 2015 study by Drexel University’s Robert Brulle found that nearly $1 billion per year is being spent to support climate change denial. Electric utilities, fossil fuel and transportation sectors outspent environmental and renewable energy sectors by more than 10-to-1, undermining efforts to achieve net-zero electricity emissions globally. It is virtually the same strategy that tobacco companies used to deny the dangers of tobacco smoke, spending hundreds of millions of dollars to delay recognition of harm from tobacco smoke for decades, and today Trump's oil policies can similarly influence Wall Street's energy strategy. These are the same debunked sources Johnson quotes in his commentary.

The authors of six independent peer-reviewed papers on the consensus for human-caused climate change examined “the available studies and conclude that the finding of 97% consensus in published climate research is robust and consistent with other surveys of climate scientists and peer-reviewed studies,” according to an abstract in Environmental Research Letters, and public support for action is strong, with most Americans willing to contribute financially to climate solutions. Of the 30,000 scientists (people with a bachelor’s degree or higher in science) Johnson cites, only 39 specialized in climate science.

A new study by the U.N. Intergovernmental Panel on Climate Change draws on momentum from the Katowice climate summit to warn that “The consequences for nature and humanity are sweeping and severe.”

California’s Office of Planning and Research says: “Every major scientific organization in the United States with relevant expertise has confirmed the IPCC’s conclusion, including the National Academy of Sciences, the American Meteorological Society, the American Geophysical Union, and the American Association for the Advancement of Science. The list of international scientific organizations affirming the worldwide consensus on climate change is even longer.”

Former President Obama argued that decarbonization is irreversible as the clean-energy transition accelerates.

This issue is a symptom of an even larger problem. Recently, Facebook announced it would continue to allow political ads that contain obvious lies. America’s corporate news media has been following the same policy for years. Printing stories and commentary with information that is clearly not true or where data has been cherry-picked to strongly imply a lie, such as claims that Ottawa is making electricity more expensive for Albertans, sets up a false equivalence fallacy in which two incompatible arguments appear to be logically equivalent when, in fact, they are not.

Conservatives focus exclusively on progressive income taxes to argue that rich people pay a disproportionate share of taxes while ignoring that they take a disproportionate share of income, and federal income taxes account for less than half of taxes collected, with almost all of the other taxes being heavily regressive. Critics of single-payer healthcare disregard that almost every other developed country on earth has been using single-payer for decades to provide better care with universal coverage at roughly half the cost. Other examples abound, including recent policy milestones like the historic U.S. climate deal that nevertheless become targets of misinformation. We live in a society where truth is no longer truth, reality is supplanted by alternative facts and where crippling polarization is driven by the inability to agree on basic facts.


Related News

View more

Parsing Ontario's electricity cost allocation

Ontario Global Adjustment and ICI balance hydro rates, renewable cost shift, and peak demand. Class A and Class B customers face demand response decisions amid pandemic occupancy uncertainty and volatile GA charges through 2022.


Key Points

A pricing model where GA costs and ICI peak allocation shape Class A/B bills, driven by renewables cost shifts.

✅ Renewable cost shift trims GA; larger Class A savings expected.

✅ Class A peak strategy returns; occupancy uncertainty persists.

✅ Class B faces volatile GA; limited levers beyond efficiency.


Ontario’s large commercial electricity customers can approach the looming annual decision about their billing structure for the 12 months beginning July 1 with the assurance of long-term relief on a portion of their costs, amid changes coming for electricity consumers that could affect planning. That’s to be weighed against uncertainties around energy demand and whether a locked-in cost allocation formula that looked favourable in pre-pandemic times will remain so until June 30, 2022.

“The biggest unknown is we just don’t know when the people are coming back,” Jon Douglas, director of sustainability with Menkes Property Management Services, reflected during a webinar sponsored by the Building Owners and Managers Association (BOMA) of Greater Toronto last week. “The occupancy in our office buildings this fall, and going into the new year, could really impact the outcome of the decision.”

After a year of operational upheaval and more modifications to provincial electricity pricing policies, BOMA Toronto’s regularly scheduled workshop ahead of the June 15 deadline for eligible customers to opt into the Industrial Conservation Initiative (ICI) program had a lot of ground to cover. Notably, beginning in January, all commercial customers have seen a reduction in the global adjustment (GA) component of their monthly hydro bills after the Ontario government shifted costs associated with contracted non-hydroelectric renewable supply to reduce the burden on industrial ratepayers from electricity rates to the general provincial account — a move that trims approximately $258 million per month from the total GA charged to industrial and commercial customers. However, they won’t garner the full benefit of that until 2022 since they’re currently repaying about $333 million in GA costs that were deferred in April, May and June of 2020.

Renewable cost shift pares the global adjustment
For now, Ontario government officials estimate the renewable cost shift equates to a 12 per cent discount relative to 2020 prices, even as typical bills may rise about 2% as fixed pricing ends in some cases. Once last year’s GA deferral is repaid at the end of 2021, they project the average Class A customer participating in the ICI program should realize a 16 per cent saving on the total hydro bill, while Class B customers paying the GA on a volumetric per kilowatt-hour (kWh) basis will see a slightly more moderate 15 per cent decrease.

“This is the biggest change to electricity pricing that’s happened since the introduction of ICI,” Tim Christie, director of electricity policy, economics and system planning for Ontario’s Ministry of Energy, Northern Development and Mines, told online workshop attendees. “The government is funding the out-of-market costs of renewables. It does tail off into the 2030s as those contracts (for wind, solar and biomass generation) expire, but over the next eight-ish years, it’s pretty steady at around just over $3 billion per year.”

Extrapolating from 2020 costs, he pegged average electricity costs at roughly 9.1 cents/kWh for Class A commercial customers and 13.2 cents/kWh for Class B, a point of concern for Ontario manufacturers facing high rates as well. However, energy management specialists suggest actual 2021 numbers haven’t proved that out.

“In commercial buildings, we’re averaging 10 to 12 cents for Class A in 2021, and we’re seeing more than that for about 14, 15 cents for Class B,” reported Scott Rouse, managing partner with the consulting firm, Energy@Work.

GA costs for Class B customers dropped nearly 30 per cent in the first four months of 2021 compared to the last four months of 2020, when they averaged 11.8 cents/kWh. Thus far, though, there have been significant month-to-month fluctuations, with a low of 5.04 cents/kWh in February and a high of 10.9 cents/kWh in April contributing to the four-month average of 8.3 cents/kWh.

“In 2020, system-wide GA very often averaged more than $1 billion per month,” Rouse said. “This February it dropped to $500 million, which was really quite surprising. So it is a very volatile cost.”

Although welcome, the renewable cost shift does alter the payback on energy-saving investments, particularly for demand response mechanisms like energy storage. When combined with pandemic-related uncertainty and a series of policy and program reversals alongside calls to clean up Ontario’s hydro policy in recent years, the industry’s appetite for some more capital-intensive technologies appears to be flagging.

“Volatility puts a pause on some of the innovation,” said Terry Flynn, general manager with BentallGreenOak and chair of BOMA Toronto’s energy committee. “It could be a leading edge, but it might be a bleeding edge that won’t bear any fruit because the way the commodity costs are structured will change.”

“There’s kind of a wait-and-see approach on some of these bigger investments,” Douglas concurred.

Industrial Conservation Initiative underpins commercial class divide
Turning to the ICI, Class A customers — defined as those with average monthly energy demand of at least 1 megawatt (MW) — encountered some unexpected changes to the program rules during 2020. Meanwhile, Class B customers — encompassing the vast share of commercial properties smaller than about 350,000 square feet — confront the persistent reality of electricity cost allocation that offloads the burden from larger players onto them.

Through the ICI, participating Class A customers pay a share of the global adjustment that’s prorated to their energy use during the five hours of the period from May 1 to April 30 when the highest overall system demand is recorded. This gives Class A customers the opportunity to lock in a favourable factor for calculating their share of monthly system-wide global adjustment costs if they can successful project and curtail energy loads during those five hours of peak demand. On the flipside, Class B customers pay the remainder of those system-wide costs, on a straightforward per-kWh basis, once Class A payments have been reconciled.

“Class B has sometimes been regarded as the forgotten middle child of the customer classes in Ontario where all the shifted costs in the system kind of pile up,” acknowledged Mark Olsheski, vice president, energy and environment, with Sussex Strategy Group. “Likewise, there can be big unpredictable and uncontrollable swings in the global adjustment rate from month to month and, outside of pure energy efficiency, there really is precious little opportunity or empowerment for a Class B customer to take actions to lower their bills.”

Nevertheless, COVID-19 presents a few extra hiccups for Class A customers this year. Conventionally, late May is when they receive notification of the cost allocation factor that would be used to determine their GA for the upcoming July 1 to June 30 period. This year, though, all current ICI participants will retain the factor they secured by responding to the five hours of peak demand during the 12 months from May 1, 2019 to April 30, 2020 after the Ontario government placed a temporary halt on the peak demand response aspect of the program last summer. Regardless, eligible ICI participants must formally opt into the program by June 15 or they will be billed as Class B customers.

Peak chasing resumes for summer 2021
Since peak demand hours conventionally occur from June to September, Class A customers will once again be studying forecasts intently and preparing to respond via Peak Perks as the heat wave season sets in. That should help alleviate some of the system stresses that arose last summer — prompting policy-makers to reject lobbying for a continued pause on peak demand response.

“The policy rationale was to allow consumers to focus on their operations when recovering from COVID as opposed to reducing peaks. The other issue was that we did not expect the peaks to be high last summer given COVID shutdowns,” Christie recounted. “But due to some hot weather, more people at home and also the lack of ICI response, we saw peaks we haven’t seen in many, many years come up last summer. So the peak hiatus has ended and this summer we’ll be back to responding to ICI as per normal.”

Among Class A customers, owners/managers of office and retail facilities generally have the most to lose from a billing formula tied to the energy demand of more densely occupied buildings in the summer of 2019. However, they could be much more competitively positioned for 2022-23 if their buildings remain below full occupancy and energy demand stays lower than usual this summer.

“Where we can improve is the IESO (Independent Electricity System Operator) and the LDCs (local distribution companies) need to help customers get their real-time data, especially in light of the phantom demand issue, interpret their bills and their Class A versus B scenarios much more easily and comprehensively,” urged Lee Hodgkinson, vice president, technical services, sustainability and ESG, with Dream Unlimited. “ I look for APIs (application programming interface) and direct data flow from the LDCs to the building owners so that we can access that data really easily.”

Given Class A’s historic advantages, few eligible ICI participants are expected to migrate out to Class B. From a sustainability perspective, there’s perhaps more cause to question how the ICI’s 1-MW threshold encourages strategies to move in the other direction.

“You could jack up demand in some buildings and get them into Class A basically by firing up the chillers on the weekend and then pouring cooling outside to get rid of it,” Douglas noted. “That has nothing to do with climate change strategy or sustainability, but it’s a cost- saving strategy, and, sometimes, when you look at the math, it’s hundreds of thousands of dollars you can save.”

Brian Hewson, vice president, consumer protection and industry performance with the Ontario Energy Board (OEB), confirmed the OEB is currently scrutinizing the discrepancy that leaves Class B as the only consumer group with no flexibility to curtail energy load during higher-priced periods, and will be providing advice to the Ministry of Energy. In the interim, that status does, at least, simplify tactics.

“Just reduce your kWh and it doesn’t matter what time of day because you’re paying that fixed rate for 24 hours a day. So if you can curb your demand at night, you get a big bang for your dollar,” Rouse advised.

“We do talk about rates a lot, but if you’re not using it, you’re not paying for it,” Flynn agreed. “A lot of our focus is still on really to try to reduce the number of kilowatts that we use. That seems to be the best thing to do.”


Related News

View more

Global oil demand to decline in 2020 as Coronavirus weighs heavily on markets

COVID-19 Impact on Global Oil Demand 2020 signals an IEA forecast of declining consumption as travel restrictions curb transport fuels, disrupt energy markets, and shift OPEC and non-OPEC supply dynamics amid economic slowdown.


Key Points

IEA sees first demand drop since 2009 as COVID-19 curbs travel, weakening transport fuels and unsettling energy markets.

✅ IEA base case: 2020 demand at 99.9 mb/d, down 90 kb/d from 2019.

✅ Travel restrictions hit transport fuels; China drives the decline.

✅ Scenarios: low -730 kb/d; high +480 kb/d in 2020.


Global oil demand is expected to decline in 2020 as the impact of the new coronavirus (COVID-19) spreads around the world, constricting travel and broader economic activity, according to the International Energy Agency’s latest oil market forecast.

The situation remains fluid, creating an extraordinary degree of uncertainty over what the full global impact of the virus will be. In the IEA’s central base case, even as global CO2 emissions flatlined in 2019 according to the IEA, demand this year drops for the first time since 2009 because of the deep contraction in oil consumption in China, and major disruptions to global travel and trade.

“The coronavirus crisis is affecting a wide range of energy markets – including coal-fired electricity generation, gas and renewables – but its impact on oil markets is particularly severe because it is stopping people and goods from moving around, dealing a heavy blow to demand for transport fuels,” said Dr Fatih Birol, the IEA’s Executive Director. “This is especially true in China, the largest energy consumer in the world, which accounted for more than 80% of global oil demand growth last year. While the repercussions of the virus are spreading to other parts of the world, what happens in China will have major implications for global energy and oil markets.”

The IEA now sees global oil demand at 99.9 million barrels a day in 2020, down around 90,000 barrels a day from 2019. This is a sharp downgrade from the IEA’s forecast in February, which predicted global oil demand would grow by 825,000 barrels a day in 2020.

The short-term outlook for the oil market will ultimately depend on how quickly governments move to contain the coronavirus outbreak, how successful their efforts are, and what lingering impact the global health crisis has on economic activity.

To account for the extreme uncertainty facing energy markets, the IEA has developed two other scenarios for how global oil demand could evolve this year. In a more pessimistic low case, global measures fail to contain the virus, and global demand falls by 730,000 barrels a day in 2020. In a more optimistic high case, the virus is contained quickly around the world, and global demand grows by 480,000 barrels a day.

“We are following the situation extremely closely and will provide regular updates to our forecasts as the picture becomes clearer,” Dr Birol said. “The impact of the coronavirus on oil markets may be temporary. But the longer-term challenges facing the world’s suppliers are not going to go away, especially those heavily dependent on oil and gas revenues. As the IEA has repeatedly said, these producer countries need more dynamic and diversified economies in order to navigate the multiple uncertainties that we see today.”

The IEA also published its medium-term outlook examining the key issues in global demand, supply, refining and trade to 2025, as well as the trajectory of the global energy transition now shaping markets. Following a contraction in 2020 and an expected sharp rebound in 2021, yearly growth in global oil demand is set to slow as consumption of transport fuels grows more slowly and as national net-zero pathways, with Canada needing more electricity to reach net-zero influencing power demand, according to the report. Between 2019 and 2025, global oil demand is expected to grow at an average annual rate of just below 1 million barrels a day. Over the period as whole, demand rises by a total of 5.7 million barrels a day, with China and India accounting for about half of the growth.

At the same time, the world’s oil production capacity is expected to rise by 5.9 million barrels a day, with more than three-quarters of it coming from non-OPEC producers, the report forecasts. But production growth in the United States and other non-OPEC countries is set to lose momentum after 2022, amid shifts in Wall Street's energy strategy linked to policy signals, allowing OPEC producers from the Middle East to turn the taps back up to help keep the global oil market in balance.

The medium-term market report, Oil 2020, also considers the impact of clean energy transitions on oil market trends. Demand growth for gasoline and diesel between 2019 and 2025 is forecast to weaken as countries around the world implement policies to improve efficiency and cut carbon dioxide emissions – and as solar power becomes the cheapest electricity in many markets and electric vehicles increase in popularity. The impact of energy transitions on oil supply remains unclear, with many companies prioritising short-cycle projects for the coming years.

“The coronavirus crisis is adding to the uncertainties the global oil industry faces as it contemplates new investments and business strategies,” Dr Birol said. “The pressures on companies are changing, with European oil majors turning electric to diversify. They need to show that they can deliver not just the energy that economies rely on, but also the emissions reductions that the world needs to help tackle our climate challenge.”


Related News

View more

Study: US Power Grid Has More Blackouts Than ENTIRE Developed World

US Power Grid Blackouts highlight aging infrastructure, rising outages, and declining reliability per DOE and NERC data, with weather-driven failures, cyberattack risk, and underinvestment stressing utilities, transmission lines, and modernization efforts.


Key Points

US power grid blackouts are outages caused by aging grid assets, severe weather, and cyber threats reducing reliability.

✅ DOE and NERC data show rising outage frequency and duration.

✅ Weather now drives 68-73% of major failures since 2008.

✅ Modernization, hardening, and cybersecurity investments are critical.


The United States power grid has more blackouts than any other country in the developed world, according to new data and U.S. blackout warnings that spotlight the country’s aging and unreliable electric system.

The data by the Department of Energy (DOE) and the North American Electric Reliability Corporation (NERC) shows that Americans face more power grid failures lasting at least an hour than residents of other developed nations.

And it’s getting worse.

Going back three decades, the US grid loses power 285 percent more often than it did in 1984, when record keeping began, International Business Times reported. The power outages cost businesses in the United States as much as $150 billion per year, according to the Department of Energy.

Customers in Japan lose power for an average of 4 minutes per year, as compared to customers in the US upper Midwest (92 minutes) and upper Northwest (214), University of Minnesota Professor Massoud Amin told the Times. Amin is director of the Technological Leadership Institute at the school.

#google#

The grid is becoming less dependable each year, he said.

“Each one of these blackouts costs tens of hundreds of millions, up to billions, of dollars in economic losses per event,” Amin said. “… We used to have two to five major weather events per year [that knocked out power], from the ‘50s to the ‘80s. Between 2008 and 2012, major outages caused by weather, reflecting extreme weather trends, increased to 70 to 130 outages per year. Weather used to account for about 17 to 21 percent of all root causes. Now, in the last five years, it’s accounting for 68 to 73 percent of all major outages.”

As previously reported by Off The Grid News, the power grid received a “D+” grade on its power grid report card from the American Society of Civil Engineers (ASCE) in 2013. The power grid grade card rating means the energy infrastructure is in “poor to fair condition and mostly below standard, with many elements approaching the end of their service life.” It further means a “large portion of the system exhibits significant deterioration” with a “strong risk of failure.”

“America relies on an aging electrical grid and pipeline distribution systems, some of which originated in the 1880s,” the 2013 ASCE report read. “Investment in power transmission has increased since 2005, but ongoing permitting issues, weather events, and limited maintenance have contributed to an increasing number of failures and power interruptions.”

As The Times noted, the US power grid as it exists today was built shortly after World War II, with the design dating back to Thomas Edison. While Edison was a genius, he and his contemporaries could not have envisioned all the strains the modern world would place upon the grid and the multitude of tech gadgets many Americans treat as an extension of their body. While the drain on the grid has advanced substantially, the infrastructure itself has not.

There are approximately 5 million miles of electrical transmission lines throughout the United States, and thousands of power generating plants dot the landscape. The electrical grid is managed by a group of 3,300 different utilities and serve about 150 million customers, The Times said. The entire power grid system is currently valued at $876 billion.

Many believe the grid is vulnerable to an attack on substations and other threats.

Former Department of Homeland Security Secretary Janet Napolitano once said that a power grid cyber attack is a matter of “when” not “if,” as Russians hacked utilities incidents have shown.


Related News

View more

Hydroelectricity Under Pumped Storage Capacity

Pumped Storage Hydroelectricity balances renewable energy, stabilizes the grid, and provides large-scale energy storage using reservoirs and reversible turbines, delivering flexible peak power, frequency control, and rapid response to variable wind and solar generation.


Key Points

A reversible hydro system that stores energy by pumping water uphill, then generates flexible peak power.

✅ Balances variable wind and solar with rapid ramping

✅ Stores off-peak electricity in upper reservoirs

✅ Enhances grid stability, frequency control, and reserves


The expense of hydroelectricity is moderately low, making it a serious wellspring of sustainable power. The hydro station burns-through no water, dissimilar to coal or gas plants. The commonplace expense of power from a hydro station bigger than 10 megawatts is 3 to 5 US pennies for every kilowatt hour, and Niagara Falls powerhouse upgrade projects show how modernization can further improve efficiency and reliability. With a dam and supply it is likewise an adaptable wellspring of power, since the sum delivered by the station can be shifted up or down quickly (as meager as a couple of moments) to adjust to changing energy requests.

When a hydroelectric complex is developed, the task creates no immediate waste, and it for the most part has an extensively lower yield level of ozone harming substances than photovoltaic force plants and positively petroleum product fueled energy plants, with calls to invest in hydropower highlighting these benefits. In open-circle frameworks, unadulterated pumped storage plants store water in an upper repository with no normal inflows, while pump back plants use a blend of pumped storage and regular hydroelectric plants with an upper supply that is renewed to a limited extent by common inflows from a stream or waterway.

Plants that don't utilize pumped capacity are alluded to as ordinary hydroelectric plants, and initiatives focused on repowering existing dams continue to expand clean generation; regular hydroelectric plants that have critical capacity limit might have the option to assume a comparable function in the electrical lattice as pumped capacity by conceding yield until required.

The main use for pumped capacity has customarily been to adjust baseload powerplants, however may likewise be utilized to decrease the fluctuating yield of discontinuous fuel sources, while emerging gravity energy storage concepts broaden long-duration options. Pumped capacity gives a heap now and again of high power yield and low power interest, empowering extra framework top limit.

In specific wards, power costs might be near zero or once in a while negative on events that there is more electrical age accessible than there is load accessible to retain it; despite the fact that at present this is infrequently because of wind or sunlight based force alone, expanded breeze and sun oriented age will improve the probability of such events.

All things considered, pumped capacity will turn out to be particularly significant as an equilibrium for exceptionally huge scope photovoltaic age. Increased long-distance bandwidth, including hydropower imports from Canada, joined with huge measures of energy stockpiling will be a critical piece of directing any enormous scope sending of irregular inexhaustible force sources. The high non-firm inexhaustible power entrance in certain districts supplies 40% of yearly yield, however 60% might be reached before extra capaciy is fundamental.

Pumped capacity plants can work with seawater, despite the fact that there are extra difficulties contrasted with utilizing new water. Initiated in 1966, the 240 MW Rance flowing force station in France can incompletely function as a pumped storage station. At the point when elevated tides happen at off-top hours, the turbines can be utilized to pump more seawater into the repository than the elevated tide would have normally gotten. It is the main enormous scope power plant of its sort.

Alongside energy mechanism, pumped capacity frameworks help control electrical organization recurrence and give save age. Warm plants are substantially less ready to react to abrupt changes in electrical interest, and can see higher thermal PLF during periods of reduced hydro generation, conceivably causing recurrence and voltage precariousness.

Pumped storage plants, as other hydroelectric plants, including new BC generating stations, can react to stack changes in practically no time. Pumped capacity hydroelectricity permits energy from discontinuous sources, (for example, sunlight based, wind) and different renewables, or abundance power from consistent base-load sources, (for example, coal or atomic) to be put something aside for times of more popularity.

The repositories utilized with siphoned capacity are tiny when contrasted with ordinary hydroelectric dams of comparable force limit, and creating periods are regularly not exactly a large portion of a day. This technique produces power to gracefully high top requests by moving water between repositories at various heights.

Now and again of low electrical interest, the abundance age limit is utilized to pump water into the higher store. At the point when the interest gets more noteworthy, water is delivered once more into the lower repository through a turbine. Pumped capacity plans at present give the most monetarily significant methods for enormous scope matrix energy stockpiling and improve the every day limit factor of the age framework. Pumped capacity isn't a fuel source, and shows up as a negative number in postings.


Related News

View more

Canadian gold mine cleans up its act with electricity

Electric mining equipment enables zero-emission, diesel-free operations at Goldcorp's Borden mine, using Sandvik battery-electric drills and LHD trucks to cut ventilation costs, noise, and maintenance while improving underground air quality.


Key Points

Battery-powered mining equipment replaces diesel, cutting emissions and ventilation costs in underground operations.

✅ Cuts diesel use, heat load, and noise in underground headings.

✅ Reduces ventilation infrastructure and operating expense.

✅ Improves air quality, worker health, and equipment uptime.


Mining operations get a lot of flack for creating environmental problems around the world. Yet they provide much of the basic material that keeps the global economy humming. Some mining companies are drilling down in their efforts to clean up their acts, exploring solutions such as recovering mine heat for power to reduce environmental impact.

As the world’s fourth-largest gold mining company Goldcorp has received its share of criticism about the impact it has on the environment.

In 2016, the Canadian company decided to do something about it. It partnered with mining-equipment company Sandvik and began to convert one of its mines into an all-electric operation, a process that is expected to take until 2021.

The efforts to build an all-electric mine began with the Sandvik DD422iE in Goldcorp’s Borden mine in Ontario, Canada.

Goldcorp's Borden mine in Borden, Ontario, CanadaGoldcorp's Borden mine in Borden, Ontario, Canada

The machine weighs 60,000 pounds and runs non-stop on a giant cord. It has a 75-kwh sodium nickel chloride battery to buffer power demands, a crucial consideration as power-hungry Bitcoin facilities can trigger curtailments during heat waves, and to move the drill from one part of the mine to another.

This electric rock-chewing machine removes the need for the immense ventilation systems needed to clean the emissions that diesel engines normally spew beneath the surface in a conventional mining operation, though the overall footprint depends on electricity sources, as regions with Clean B.C. power imports illustrate in practice.

These electric devices improve air quality, dramatically reduce noise pollution, and remove costly maintenance of internal combustion engines, Goldcorp says.

More importantly, when these electric boring machines are used across the board, it will eliminate the negative health effects those diesel drills have on miners.

“It would be a challenge to go back,” says big drill operator Adam Ladouceur.

Mining with electric equipment also removes second- or third-highest expenditure in mining, the diesel fuel used to power the drills, said Goldcorp spokesman Pierre Noel, even as industries pursue dedicated energy deals like Bitcoin mining in Medicine Hat to manage power costs. (The biggest expense is the cost of labor.)

Electric load, haul, dump machine at Goldcorp Borden mine in OntarioElectric load, haul, dump machine at Goldcorp Borden mine in Ontario

Aside from initial cost, the electric Borden mine will save approximately $7 million ($9 million Canadian) annually just on diesel, propane and electricity.

Along with various sizes of electric drills and excavating tools, Goldcorp has started using electric powered LHD (load, haul, dump) trucks to crush and remove the ore it extracts, and Sandvik is working to increase the charging speed for battery packs in the 40-ton electric trucks which transport the ore out of the mines, while utilities add capacity with new BC generating stations coming online.


Related News

View more

Sign Up for Electricity Forum’s Newsletter

Stay informed with our FREE Newsletter — get the latest news, breakthrough technologies, and expert insights, delivered straight to your inbox.

Electricity Today T&D Magazine Subscribe for FREE

Stay informed with the latest T&D policies and technologies.
  • Timely insights from industry experts
  • Practical solutions T&D engineers
  • Free access to every issue

Download the 2025 Electrical Training Catalog

Explore 50+ live, expert-led electrical training courses –

  • Interactive
  • Flexible
  • CEU-cerified