Chinese power producer to cut spending

By International Herald Tribune


CSA Z462 Arc Flash Training - Electrical Safety Essentials

Our customized live online or in‑person group training can be delivered to your staff at your location.

  • Live Online
  • 6 hours Instructor-led
  • Group Training Available
Regular Price:
$249
Coupon Price:
$199
Reserve Your Seat Today
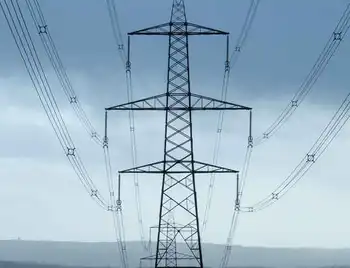
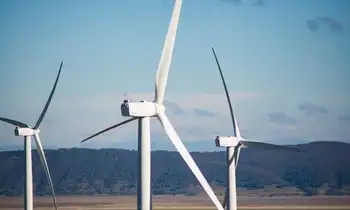
Huadian Power International, a Chinese electricity producer listed in Hong Kong, plans to cut spending on new plants by two-thirds next year to increase profitability.

Capital investment may drop to 5 billion yuan, or $654 million, and will add 1,200 megawatts of coal-fired capacity in 2008, Zhang Gelin, head of the Beijing-based utility's securities department, said. Spending may total 15 billion yuan this year, the managing director, Chen Jianhua, said in March.

Huadian Power's bigger rivals, including Huaneng Power International, are adding plants at a faster pace than growth in demand, leaving some capacity unused. That has increased pressure on Huadian Power to maintain profitability amid higher fuel costs, the deputy general manager, Zhong Tonglin, said recently, after the company's annual general meeting in Beijing.

"Huadian Power is cutting spending amid concern of a possible supply surplus and it needs to reduce debt by making full use of existing plants," Zhang Wenxian, an analyst with Guotai Junan Securities Hong Kong, said. "The government is also tightening approvals for new plants."

China is limiting coal-fired power generation to improve the environment. Huadian Power's parent, China Huadian, is among companies ordered by the government in March to reduce pollution.

"We will try to stabilize our profits this year from the 2006 level amid operational pressures," Zhong, the deputy general manager, said. "Our profitability will improve after 2008 as fewer plants are put on stream, increasing the company's utilization rate."

Construction of new power plants in China will decrease next year because of a potential surplus in the market after three years of rapid development since 2004, Zhong said.

Growth in China's electricity demand will probably slow to a maximum of 12.5 percent this year, from 14 percent in 2006, the State Grid Corp. of China said in January. The country plans to increase power generating capacity by 15 percent this year, the government said in April.

Huadian Power will start operating 6,000 megawatts of capacity this year, raising total output to about 20,000 megawatts, Zhong said. Among the independent generators, the company may experience the biggest decline in the utilization rate at its plants, JPMorgan Chase said in March.

Related News

Iran eyes transmitting electricity to Europe as region’s power hub

Iran Electricity Grid Synchronization enables regional interconnection, cross-border transmission, and Caspian-Europe energy corridors, linking Iraq, Azerbaijan, Russia, and Qatar to West Asia and European markets with reliable, flexible power exchange.


Key Points

Iran's initiative to link West Asian and European power grids for trade, transit, reliability, and regional influence.

✅ Synchronizes grids with Iraq, Azerbaijan, Russia, and potential Qatar link

✅ Enables east-to-Europe electricity transit via Caspian energy corridors

✅ Backed by gas-fueled and combined-cycle generation capacity


Following a plan for becoming West Asia’s electricity hub, Iran has been taking serious steps for joining its electricity network with neighbors in the past few years.

The Iranian Energy Ministry has been negotiating with the neighboring countries including Iraq for the connection of their power networks with Iran, discussing Iran-Iraq energy cooperation as well as ties with Russia, Afghanistan, Azerbaijan, and Qatar to make them enable to import or transmit their electricity to new destination markets through Iran.

The synchronization of power grids with the neighboring countries, not only enhances Iran’s electricity exchanges with them, but it will also increase the political stance of the country in the region.

So far, Iran’s electricity network has been synchronized with Iraq, where Iran is supplying 40% of Iraq's power today, and back in September, the Energy Minister Reza Ardakanian announced that the electricity networks of Russia and Azerbaijan are the next in line for becoming linked with the Iranian grid in the coming months.

“Within the next few months, the study project of synchronization of the electricity networks of Iran, Azerbaijan, and Russia will be completed and then the executive operations will begin,” the minister said.

Meanwhile, Ardakanian and Qatari Minister of State for Energy Affairs Saad Sherida Al-Kaabi held an online meeting in late September to discuss joining the two countries' electricity networks via sea.

During the online meeting, Al-Kaabi said: "Electricity transfer between the two countries is possible and this proposal should be worked on.”

Now, taking a new step toward becoming the region’s power hub, Iran has suggested becoming a bridge between East and Europe for transmitting electricity.

In a virtual conference dubbed 1st Caspian Europe Forum hosted by Berlin on Thursday, the Iranian energy minister has expressed the country’s readiness for joining its electricity network with Europe.

"We are ready to connect Iran's electricity network, as the largest power generation power in West Asia, with the European countries and to provide the ground for the exchange of electricity with Europe," Ardakanian said addressing the online event.

Iran's energy infrastructure in the oil, gas, and electricity sectors can be used as good platforms for the transfer of energy from east to Europe, he noted.

In the event, which was aimed to study issues related to the development of economic cooperation, especially energy, between the countries of the Caspian Sea region, the official added that Iran, with its huge energy resources and having skilled manpower and advanced facilities in the field of energy, can pave the ground for the prosperity of international transport and energy corridors.

"In order to help promote communication between our landlocked neighbors with international markets, as Uzbekistan aims to export power to Afghanistan across the region, we have created a huge transit infrastructure in our country and have demonstrated in practice our commitment to regional development and peace and stability," Ardakanian said.

He pointed out that having a major percentage of proven oil and gas resources in the world, regional states need to strengthen relations in a bid to regulate production and export policies of these huge resources and potentially play a role in determining the price and supply of these resources worldwide.

“EU countries can join our regional cooperation in the framework of bilateral or multilateral mechanisms such as ECO,” he said.

Given the growing regional and global energy needs and the insufficient investment in the field, with parts of Central Asia facing severe electricity shortages today, as well as Europe's increasing needs, this area can become a sustainable area of cooperation, he noted.

Ardakanian also said that by investing in energy production in Iran, Europe can meet part of its future energy needs on a sustainable basis.

In Iraq, plans for nuclear power plants are being pursued to tackle chronic electricity shortages, reflecting parallel efforts to diversify generation.

Iran currently has electricity exchange with Armenia, Azerbaijan, Iraq, where grid rehabilitation deals have been finalized, Turkmenistan, and Afghanistan.

The country’s total electricity exports vary depending on the hot and cold seasons of the year, since during the hot season which is the peak consumption period, the country’s electricity exports decreases, however electrical communication with neighboring countries continues.

Enjoying abundant gas resources, which is the main fuel for the majority of the country’s power plants, Iran has the capacity to produce about 85,500 megawatts [85.5 gigawatts (GW)] of electricity.

Currently, combined cycle power plants account for the biggest share in the country’s total power generation capacity as Iran is turning thermal plants to combined cycle to save energy, followed by gas power plants.


Related News

View more

Duke Energy reaffirms capital investments in renewables and grid projects to deliver cleaner energy, economic growth

Duke Energy Clean Energy Strategy advances renewables, battery storage, grid modernization, and energy efficiency to cut carbon, retire coal, and target net-zero by 2050 across the Carolinas with robust IRPs and capital investments.


Key Points

Plan to expand renewables, storage, and grid upgrades to cut carbon and reach net-zero electricity by 2050.

✅ 56B investment in renewables, storage, and grid modernization

✅ Targets 50% carbon reduction by 2030 and net-zero by 2050

✅ Retires coal units; expands energy efficiency and IRPs


Duke Energy says that the company will continue advancing its ambitious clean energy goals without the Atlantic Coast Pipeline (ACP) by investing in renewables, battery storage, energy efficiency programs and grid projects that support U.S. electrification efforts.

Duke Energy, the nation's largest electric utility, unveils its new logo. (PRNewsFoto/Duke Energy) (PRNewsfoto/Duke Energy)

Duke Energy's $56 billion capital investment plan will deliver significant customer benefits and create jobs at a time when policymakers at all levels are looking for ways to rebuild the economy in 2020 and beyond. These investments will deliver cleaner energy for customers and communities while enhancing the energy grid to provide greater reliability and resiliency.

"Sustainability and the reduction of carbon emissions are closely tied to our region's success," said Lynn Good, Duke Energy Chair, President and CEO. "In our recent Climate Report, we shared a vision of a cleaner electricity future with an increasing focus on renewables and battery storage in addition to a diverse mix of zero-carbon nuclear, natural gas, hydro and energy efficiency programs.

"Achieving this clean energy vision will require all of us working together to develop a plan that is smart, equitable and ensures the reliability and affordability that will spur economic growth in the region. While we're disappointed that we're not able to move forward with ACP, we will continue exploring ways to help our customers and communities, particularly in eastern North Carolina where the need is great," said Good.

Already a clean-energy leader, Duke Energy has reduced its carbon emissions by 39% from 2005 and remains on track to cut its carbon emissions by at least 50% by 2030, as peers like Alliant's carbon-neutral plan demonstrate broader industry momentum toward decarbonization. The company also has an ambitious clean energy goal of reaching net-zero emissions from electricity generation by 2050. 

In September 2020, Duke Energy plans to file its Integrated Resource Plans (IRP) for the Carolinas after an extensive process of working with the state's leaders, policymakers, customers and other stakeholders. The IRPs will include multiple scenarios to support a path to a cleaner energy future in the Carolinas, reflecting key utility trends shaping resource planning.

Since 2010, Duke Energy has retired 51 coal units totaling more than 6,500 megawatts (MW) and plans to retire at least an additional 900 MW by the end of 2024. In 2019, the company proposed to shorten the book lives of another approximately 7,700 MW of coal capacity in North Carolina and Indiana.

Duke Energy will host an analyst call in early August 2020 to discuss second quarter 2020 financial results and other business and financial updates. The company will also host its inaugural Environmental, Social and Governance (ESG) investor day in October 2020.


Duke Energy

Duke Energy is transforming its customers' experience, modernizing the energy grid, generating cleaner energy and expanding natural gas infrastructure to create a smarter energy future for the people and communities it serves. The Electric Utilities and Infrastructure unit's regulated utilities serve 7.8 million retail electric customers in six states: North Carolina, South Carolina, Florida, Indiana, Ohio and Kentucky. The Gas Utilities and Infrastructure unit distributes natural gas to 1.6 million customers in five states: North Carolina, South Carolina, Tennessee, Ohio and Kentucky. The Duke Energy Renewables unit operates wind and solar generation facilities across the U.S., as well as energy storage and microgrid projects.

Duke Energy was named to Fortune's 2020 "World's Most Admired Companies" list and Forbes' "America's Best Employers" list. More information about the company is available at duke-energy.com. The Duke Energy News Center contains news releases, fact sheets, photos, videos and other materials. Duke Energy's illumination features stories about people, innovations, community topics and environmental issues. Follow Duke Energy on Twitter, LinkedIn, Instagram and Facebook.


Forward-Looking Information

This document includes forward-looking statements within the meaning of Section 27A of the Securities Act of 1933 and Section 21E of the Securities Exchange Act of 1934. Forward-looking statements are based on management's beliefs and assumptions and can often be identified by terms and phrases that include "anticipate," "believe," "intend," "estimate," "expect," "continue," "should," "could," "may," "plan," "project," "predict," "will," "potential," "forecast," "target," "guidance," "outlook" or other similar terminology. Various factors may cause actual results to be materially different than the suggested outcomes within forward-looking statements; accordingly, there is no assurance that such results will be realized. These factors include, but are not limited to:

  • The impact of the COVID-19 electricity demand shift on operations and revenues;
  • State, federal and foreign legislative and regulatory initiatives, including costs of compliance with existing and future environmental requirements, including those related to climate change, as well as rulings that affect cost and investment recovery or have an impact on rate structures or market prices;
  • The extent and timing of costs and liabilities to comply with federal and state laws, regulations and legal requirements related to coal ash remediation, including amounts for required closure of certain ash impoundments, are uncertain and difficult to estimate;
  • The ability to recover eligible costs, including amounts associated with coal ash impoundment retirement obligations and costs related to significant weather events, and to earn an adequate return on investment through rate case proceedings and the regulatory process;
  • The costs of decommissioning nuclear facilities could prove to be more extensive than amounts estimated and all costs may not be fully recoverable through the regulatory process;
  • Costs and effects of legal and administrative proceedings, settlements, investigations and claims;
  • Industrial, commercial and residential growth or decline in service territories or customer bases resulting from sustained downturns of the economy and the economic health of our service territories or variations in customer usage patterns, including energy efficiency and demand response efforts and use of alternative energy sources, such as self-generation and distributed generation technologies;
  • Federal and state regulations, laws and other efforts designed to promote and expand the use of energy efficiency measures and distributed generation technologies, such as private solar and battery storage, in Duke Energy service territories could result in customers leaving the electric distribution system, excess generation resources as well as stranded costs;
  • Advancements in technology;
  • Additional competition in electric and natural gas markets and continued industry consolidation;
  • The influence of weather and other natural phenomena on operations, including the economic, operational and other effects of severe storms, hurricanes, droughts, earthquakes and tornadoes, including extreme weather associated with climate change;
  • The ability to successfully operate electric generating facilities and deliver electricity to customers including direct or indirect effects to the company resulting from an incident that affects the U.S. electric grid or generating resources;
  • The ability to obtain the necessary permits and approvals and to complete necessary or desirable pipeline expansion or infrastructure projects in our natural gas business;
  • Operational interruptions to our natural gas distribution and transmission activities;
  • The availability of adequate interstate pipeline transportation capacity and natural gas supply;
  • The impact on facilities and business from a terrorist attack, cybersecurity threats, data security breaches, operational accidents, information technology failures or other catastrophic events, such as fires, explosions, pandemic health events or other similar occurrences;
  • The inherent risks associated with the operation of nuclear facilities, including environmental, health, safety, regulatory and financial risks, including the financial stability of third-party service providers;
  • The timing and extent of changes in commodity prices and interest rates and the ability to recover such costs through the regulatory process, where appropriate, and their impact on liquidity positions and the value of underlying assets;
  • The results of financing efforts, including the ability to obtain financing on favorable terms, which can be affected by various factors, including credit ratings, interest rate fluctuations, compliance with debt covenants and conditions and general market and economic conditions;
  • Credit ratings of the Duke Energy Registrants may be different from what is expected;
  • Declines in the market prices of equity and fixed-income securities and resultant cash funding requirements for defined benefit pension plans, other post-retirement benefit plans and nuclear decommissioning trust funds;
  • Construction and development risks associated with the completion of the Duke Energy Registrants' capital investment projects, including risks related to financing, obtaining and complying with terms of permits, meeting construction budgets and schedules and satisfying operating and environmental performance standards, as well as the ability to recover costs from customers in a timely manner, or at all;
  • Changes in rules for regional transmission organizations, including FERC debates on coal and nuclear subsidies and new and evolving capacity markets, and risks related to obligations created by the default of other participants;
  • The ability to control operation and maintenance costs;
  • The level of creditworthiness of counterparties to transactions;
  • The ability to obtain adequate insurance at acceptable costs;
  • Employee workforce factors, including the potential inability to attract and retain key personnel;
  • The ability of subsidiaries to pay dividends or distributions to Duke Energy Corporation holding company (the Parent);
  • The performance of projects undertaken by our nonregulated businesses and the success of efforts to invest in and develop new opportunities;
  • The effect of accounting pronouncements issued periodically by accounting standard-setting bodies;
  • The impact of U.S. tax legislation to our financial condition, results of operations or cash flows and our credit ratings;
  • The impacts from potential impairments of goodwill or equity method investment carrying values; and
  • The ability to implement our business strategy, including enhancing existing technology systems.
  • Additional risks and uncertainties are identified and discussed in the Duke Energy Registrants' reports filed with the SEC and available at the SEC's website at sec.gov. In light of these risks, uncertainties and assumptions, the events described in the forward-looking statements might not occur or might occur to a different extent or at a different time than described. Forward-looking statements speak only as of the date they are made and the Duke Energy Registrants expressly disclaim an obligation to publicly update or revise any forward-looking statements, whether as a result of new information, future events or otherwise.


Related News

View more

Pennsylvania residents could see electricity prices rise as much as 50 percent this winter

Pennsylvania Electric Rate Increases hit Peco, PPL, and Pike County, driven by natural gas costs and wholesale power markets; default rate changes, price to compare shifts, and time-of-use plans affect residential bills.


Key Points

Electric default rates are rising across Pennsylvania as natural gas costs climb, affecting Peco, PPL, and Pike customers.

✅ PPL, Peco, and Pike raising default rates Dec. 1

✅ Natural gas costs driving wholesale power prices

✅ Consider standard offer, TOU rates, and efficiency


Energy costs for electric customers are going up by as much as 50% across Pennsylvania next week, the latest manifestation of US electricity price increases impacting gasoline, heating oil, propane, and natural gas.

Eight Pennsylvania electric utilities are set to increase their energy prices on Dec. 1, reflecting the higher cost to produce electricity. Peco Energy, which serves Philadelphia and its suburbs, will boost its energy charge by 6.4% on Dec. 1, from 6.6 cents per kilowatt hour to about 7 cents per kWh. Energy charges account for about half of a residential bill.

PPL Electric Utilities, the Allentown company that serves a large swath of Pennsylvania including parts of Bucks, Montgomery, and Chester Counties, will impose a 26% increase on residential energy costs on Dec. 1, from about 7.5 cents per kWh to 9.5 cents per kWh. That’s an increase of $40 a month for an electric heating customer who uses 2,000 kWh a month.

Pike County Light & Power, which serves about 4,800 customers in Northeast Pennsylvania, will increase energy charges by 50%, according to the Pennsylvania Public Utility Commission.

“All electric distribution companies face the same market forces as PPL Electric Utilities,” PPL said in a statement. Each Pennsylvania utility follows a different PUC-regulated plan for procuring energy from power generators, and those forces can include rising nuclear power costs in some regions, which explains why some customers are absorbing the hit sooner rather than later, it said.

There are ways customers can mitigate the impact. Utilities offer a host of programs and grants to support low-income customers, and some states are exploring income-based fixed charges to address affordability, and they encourage anyone struggling to pay their bills to call the utility for help. Customers can also control their costs by conserving energy. It may be time to put on a sweater and weatherize the house.

Peco recently introduced time-of-use rates — as seen when Ontario ended fixed pricing — that include steep discounts for customers who can shift electric usage to late night hours — that’s you, electric vehicle owners.

There’s also a clever opportunity available for many Pennsylvania customers called the “standard offer” that might save you some real money, but you need to act before the new charges take effect on Dec. 1 to lock in the best rates.

Why are the price hikes happening?
But first, how did we get here?

Energy charges are rising for a simple reason: Fuel prices for power generators are increasing, and that’s driven mostly by natural gas. It’s pushing up electricity prices in wholesale power markets and has lifted typical residential bills in recent years.

“It’s all market forces right now,” said Nils Hagen-Frederiksen, PUC spokesperson. Energy charges are strictly a pass-through cost for utilities. Utilities aren’t allowed to mark them up.

The increase in utility energy charges does not affect customers who buy their energy from competitive power suppliers in deregulated electricity markets. About 27% of Pennsylvania’s 5.9 million electric customers who shop for electricity from third-party suppliers either pay fixed rates, whose price remains stable, or are on a variable-rate plan tied to market prices. The variable-rate electric bills have probably already increased to reflect the higher cost of generating power.

Most New Jersey electric customers are shielded for now from rising energy costs. New Jersey sets annual energy prices for customers who don’t shop for power. Those rates go into effect on June 1 and stay in place for 12 months. The current energy market fluctuations will be reflected in new rates that take effect next summer, said Lauren Ugorji, a spokesperson for Public Service Electric & Gas Co., New Jersey’s largest utility.

For each utility, its own plan
Pennsylvania has a different system for setting utility energy charges, which are also known as the “default rate,” because that’s the price a customer gets by default if they don’t shop for power. The default rate is also the same thing as the “price to compare,” a term the PUC has adopted so consumers can make an apples-to-apples comparison between a utility’s energy charge and the price offered by a competitive supplier.

Each of the state’s 11 PUC-regulated electric utilities prepares its own “default service plan,” that governs the method by which they procure power on wholesale markets. Electric distribution companies like Peco are required to buy the lowest priced power. They typically buy power in blind auctions conducted by independent agents, so that there’s no favoritism for affiliated power generators

Some utilities adjust charges quarterly, and others do it semi-annually. “This means that each [utility’s] resulting price to compare will vary as the market changes, some taking longer to reflect price changes, both up and down,” PPL said in a statement. PPL conducted its semi-annual auction in October, when energy prices were rising sharply.

Most utilities buy power from suppliers under contracts of varying durations, both long-term and short-term. The contracts are staggered so market price fluctuations are smoothed out. One utility, Pike County Power & Light, buys all its power on the spot market, which explains why its energy charge will surge by 50% on Dec. 1. Pike County’s energy charge will also be quicker to decline when wholesale prices subside, as they are expected to next year.

Peco adjusts its energy charge quarterly, but it conducts power auctions semi-annually. It buys about 40% of its power in one-year contracts, and 60% in two-year contracts, and does not buy any power on spot markets, said Richard G. Webster Jr., Peco’s vice president of regulatory policy and strategy.

“At any given time, we’re replacing about a third of our supplied portfolio,” he said.

The utility’s energy charge affects only part of the monthly bill. For a Peco residential electric customer who uses 700 kWh per month, the Dec. 1 energy charge increase will boost monthly bills by $2.94 per month, or 2.9%. For an electric heating customer who uses about 2,000 kWh per month, the change will boost bills $8.40 a month, or about 3.5%, said Greg Smore, a Peco spokesperson.


Related News

View more

Parsing Ontario's electricity cost allocation

Ontario Global Adjustment and ICI balance hydro rates, renewable cost shift, and peak demand. Class A and Class B customers face demand response decisions amid pandemic occupancy uncertainty and volatile GA charges through 2022.


Key Points

A pricing model where GA costs and ICI peak allocation shape Class A/B bills, driven by renewables cost shifts.

✅ Renewable cost shift trims GA; larger Class A savings expected.

✅ Class A peak strategy returns; occupancy uncertainty persists.

✅ Class B faces volatile GA; limited levers beyond efficiency.


Ontario’s large commercial electricity customers can approach the looming annual decision about their billing structure for the 12 months beginning July 1 with the assurance of long-term relief on a portion of their costs, amid changes coming for electricity consumers that could affect planning. That’s to be weighed against uncertainties around energy demand and whether a locked-in cost allocation formula that looked favourable in pre-pandemic times will remain so until June 30, 2022.

“The biggest unknown is we just don’t know when the people are coming back,” Jon Douglas, director of sustainability with Menkes Property Management Services, reflected during a webinar sponsored by the Building Owners and Managers Association (BOMA) of Greater Toronto last week. “The occupancy in our office buildings this fall, and going into the new year, could really impact the outcome of the decision.”

After a year of operational upheaval and more modifications to provincial electricity pricing policies, BOMA Toronto’s regularly scheduled workshop ahead of the June 15 deadline for eligible customers to opt into the Industrial Conservation Initiative (ICI) program had a lot of ground to cover. Notably, beginning in January, all commercial customers have seen a reduction in the global adjustment (GA) component of their monthly hydro bills after the Ontario government shifted costs associated with contracted non-hydroelectric renewable supply to reduce the burden on industrial ratepayers from electricity rates to the general provincial account — a move that trims approximately $258 million per month from the total GA charged to industrial and commercial customers. However, they won’t garner the full benefit of that until 2022 since they’re currently repaying about $333 million in GA costs that were deferred in April, May and June of 2020.

Renewable cost shift pares the global adjustment
For now, Ontario government officials estimate the renewable cost shift equates to a 12 per cent discount relative to 2020 prices, even as typical bills may rise about 2% as fixed pricing ends in some cases. Once last year’s GA deferral is repaid at the end of 2021, they project the average Class A customer participating in the ICI program should realize a 16 per cent saving on the total hydro bill, while Class B customers paying the GA on a volumetric per kilowatt-hour (kWh) basis will see a slightly more moderate 15 per cent decrease.

“This is the biggest change to electricity pricing that’s happened since the introduction of ICI,” Tim Christie, director of electricity policy, economics and system planning for Ontario’s Ministry of Energy, Northern Development and Mines, told online workshop attendees. “The government is funding the out-of-market costs of renewables. It does tail off into the 2030s as those contracts (for wind, solar and biomass generation) expire, but over the next eight-ish years, it’s pretty steady at around just over $3 billion per year.”

Extrapolating from 2020 costs, he pegged average electricity costs at roughly 9.1 cents/kWh for Class A commercial customers and 13.2 cents/kWh for Class B, a point of concern for Ontario manufacturers facing high rates as well. However, energy management specialists suggest actual 2021 numbers haven’t proved that out.

“In commercial buildings, we’re averaging 10 to 12 cents for Class A in 2021, and we’re seeing more than that for about 14, 15 cents for Class B,” reported Scott Rouse, managing partner with the consulting firm, Energy@Work.

GA costs for Class B customers dropped nearly 30 per cent in the first four months of 2021 compared to the last four months of 2020, when they averaged 11.8 cents/kWh. Thus far, though, there have been significant month-to-month fluctuations, with a low of 5.04 cents/kWh in February and a high of 10.9 cents/kWh in April contributing to the four-month average of 8.3 cents/kWh.

“In 2020, system-wide GA very often averaged more than $1 billion per month,” Rouse said. “This February it dropped to $500 million, which was really quite surprising. So it is a very volatile cost.”

Although welcome, the renewable cost shift does alter the payback on energy-saving investments, particularly for demand response mechanisms like energy storage. When combined with pandemic-related uncertainty and a series of policy and program reversals alongside calls to clean up Ontario’s hydro policy in recent years, the industry’s appetite for some more capital-intensive technologies appears to be flagging.

“Volatility puts a pause on some of the innovation,” said Terry Flynn, general manager with BentallGreenOak and chair of BOMA Toronto’s energy committee. “It could be a leading edge, but it might be a bleeding edge that won’t bear any fruit because the way the commodity costs are structured will change.”

“There’s kind of a wait-and-see approach on some of these bigger investments,” Douglas concurred.

Industrial Conservation Initiative underpins commercial class divide
Turning to the ICI, Class A customers — defined as those with average monthly energy demand of at least 1 megawatt (MW) — encountered some unexpected changes to the program rules during 2020. Meanwhile, Class B customers — encompassing the vast share of commercial properties smaller than about 350,000 square feet — confront the persistent reality of electricity cost allocation that offloads the burden from larger players onto them.

Through the ICI, participating Class A customers pay a share of the global adjustment that’s prorated to their energy use during the five hours of the period from May 1 to April 30 when the highest overall system demand is recorded. This gives Class A customers the opportunity to lock in a favourable factor for calculating their share of monthly system-wide global adjustment costs if they can successful project and curtail energy loads during those five hours of peak demand. On the flipside, Class B customers pay the remainder of those system-wide costs, on a straightforward per-kWh basis, once Class A payments have been reconciled.

“Class B has sometimes been regarded as the forgotten middle child of the customer classes in Ontario where all the shifted costs in the system kind of pile up,” acknowledged Mark Olsheski, vice president, energy and environment, with Sussex Strategy Group. “Likewise, there can be big unpredictable and uncontrollable swings in the global adjustment rate from month to month and, outside of pure energy efficiency, there really is precious little opportunity or empowerment for a Class B customer to take actions to lower their bills.”

Nevertheless, COVID-19 presents a few extra hiccups for Class A customers this year. Conventionally, late May is when they receive notification of the cost allocation factor that would be used to determine their GA for the upcoming July 1 to June 30 period. This year, though, all current ICI participants will retain the factor they secured by responding to the five hours of peak demand during the 12 months from May 1, 2019 to April 30, 2020 after the Ontario government placed a temporary halt on the peak demand response aspect of the program last summer. Regardless, eligible ICI participants must formally opt into the program by June 15 or they will be billed as Class B customers.

Peak chasing resumes for summer 2021
Since peak demand hours conventionally occur from June to September, Class A customers will once again be studying forecasts intently and preparing to respond via Peak Perks as the heat wave season sets in. That should help alleviate some of the system stresses that arose last summer — prompting policy-makers to reject lobbying for a continued pause on peak demand response.

“The policy rationale was to allow consumers to focus on their operations when recovering from COVID as opposed to reducing peaks. The other issue was that we did not expect the peaks to be high last summer given COVID shutdowns,” Christie recounted. “But due to some hot weather, more people at home and also the lack of ICI response, we saw peaks we haven’t seen in many, many years come up last summer. So the peak hiatus has ended and this summer we’ll be back to responding to ICI as per normal.”

Among Class A customers, owners/managers of office and retail facilities generally have the most to lose from a billing formula tied to the energy demand of more densely occupied buildings in the summer of 2019. However, they could be much more competitively positioned for 2022-23 if their buildings remain below full occupancy and energy demand stays lower than usual this summer.

“Where we can improve is the IESO (Independent Electricity System Operator) and the LDCs (local distribution companies) need to help customers get their real-time data, especially in light of the phantom demand issue, interpret their bills and their Class A versus B scenarios much more easily and comprehensively,” urged Lee Hodgkinson, vice president, technical services, sustainability and ESG, with Dream Unlimited. “ I look for APIs (application programming interface) and direct data flow from the LDCs to the building owners so that we can access that data really easily.”

Given Class A’s historic advantages, few eligible ICI participants are expected to migrate out to Class B. From a sustainability perspective, there’s perhaps more cause to question how the ICI’s 1-MW threshold encourages strategies to move in the other direction.

“You could jack up demand in some buildings and get them into Class A basically by firing up the chillers on the weekend and then pouring cooling outside to get rid of it,” Douglas noted. “That has nothing to do with climate change strategy or sustainability, but it’s a cost- saving strategy, and, sometimes, when you look at the math, it’s hundreds of thousands of dollars you can save.”

Brian Hewson, vice president, consumer protection and industry performance with the Ontario Energy Board (OEB), confirmed the OEB is currently scrutinizing the discrepancy that leaves Class B as the only consumer group with no flexibility to curtail energy load during higher-priced periods, and will be providing advice to the Ministry of Energy. In the interim, that status does, at least, simplify tactics.

“Just reduce your kWh and it doesn’t matter what time of day because you’re paying that fixed rate for 24 hours a day. So if you can curb your demand at night, you get a big bang for your dollar,” Rouse advised.

“We do talk about rates a lot, but if you’re not using it, you’re not paying for it,” Flynn agreed. “A lot of our focus is still on really to try to reduce the number of kilowatts that we use. That seems to be the best thing to do.”


Related News

View more

Manitoba's electrical demand could double in next 20 years: report

Manitoba Hydro Integrated Resource Plan outlines electrification-driven demand growth, clean electricity needs, wind generation, energy efficiency, hydropower strengths, and net-zero policy impacts, guiding investments to expand capacity and decarbonize Manitoba's grid.


Key Points

Manitoba Hydro IRP forecasting 2.5x demand, clean power needs, and capacity additions via wind and energy efficiency.

✅ Projects electricity demand could more than double within 20 years.

✅ Leverages 97% hydro supply; adds wind generation and efficiency.

✅ Positions for net-zero, electrification, and new capacity by the 2030s.


Electrical demand in Manitoba could more than double in the next 20 years, a trend echoed by BC Hydro's call for power in response to electrification, according to a new report from Manitoba Hydro.

On Tuesday, the Crown corporation released its first-ever Integrated Resource Plan (IRP), which not only predicts a significant increase in electrical demand, but also that new sources of energy, and a potential need for new power generation, could be needed in the next decade.

“Right now, what [our customers] are telling us, with the climate change objectives, with federal policy, provincial policies, is they see using electricity much more in the future than they do today,” said president and CEO of Manitoba Hydro Jay Grewal.

“And our current, where we’re at now, our customers have told us through all this consultation and engagement over the last two years, they’re going to want and need more than 2.5 times the electricity than we have in the province today.”

The IRP indicates that the move towards low or no-carbon energy sources will accelerate the need for clean electricity, which will require significant investments, including new turbine investments to expand capacity. Some of the clean energy measures Hydro is looking at for the future include wind generation and energy efficiency.

The report also found that Manitoba is in a good position as it prepares for the future due to its hydroelectric system, which delivers around 97 per cent of the yearly electricity. However, the province’s existing supply is limited, and vulnerable to Western Canada drought impacts on hydropower, so other electrical energy sources will be needed.

“Something Manitobans may not realize is, we are in such a privileged province, because 97 per cent of the electricity produced in Manitoba today is clean energy and net zero,” Grewal said.

Manitoba also supplies power to neighbouring utilities, with a SaskPower purchase agreement to buy more electricity under an expanded deal.

The IRP is the result of a two-year development process that involved multiple rounds of engagement with customers and other interested parties. The IRP is not a development plan, but it arrives as Hydro warns it can't service new energy-intensive customers under current capacity, and it outlines how Manitoba Hydro will monitor, prepare and respond to the changes in the energy landscape.

“We spoke with over 15,000 of our customers, whether they’re residential, commercial, industrial, industry associations, regulators, government – across the board, we talked with our customers,” said Grewal.

“And what we did was through this work, we understood what our customers are anticipating using electricity for going forward.


Related News

View more

Solar PV and wind power in the US continue to grow amid favourable government plans

US Renewable Power Outlook 2030 projects surging capacity, solar PV and wind growth, grid modernization, and favorable tax credits, detailing market trends, CAGR, transmission expansion, and policy drivers shaping clean energy generation and consumption.


Key Points

A forecast of US power capacity, generation, and consumption, highlighting solar, wind, tax credits, and grid modernization.

✅ Targets 48.4% renewable capacity share by 2030

✅ Strong growth in solar PV and onshore wind installations

✅ Investment and tax credits drive grid and transmission upgrades


GlobalData’s latest report, ‘United States Power Market Outlook to 2030, Update 2021 – Market Trends, Regulations, and Competitive Landscape’ discusses the power market structure of the United States and provides historical and forecast numbers for capacity, generation and consumption up to 2030. Detailed analysis of the country’s power market regulatory structure, competitive landscape and a list of major power plants are provided. The report also gives a snapshot of the power sector in the country on broad parameters of macroeconomics, supply security, generation infrastructure, transmission and distribution infrastructure, about a quarter of U.S. electricity from renewables in recent years, electricity import and export scenario, degree of competition, regulatory scenario, and future potential. An analysis of the deals in the country’s power sector is also included in the report.

Renewable power held a 19% share of the US’s total power capacity in 2020, and in that year renewables became the second-most prevalent source in the U.S. electricity mix by generation; this share is expected to increase significantly to 48.4% by 2030. Favourable policies introduced by the US Government will continue to drive the country’s renewable sector, particularly solar photovoltaics (PV) and wind power, with wind now the most-used renewable source in the U.S. generation mix. Installed renewable capacity* increased from 16.5GW in 2000 to 239.2GW in 2020, growing at a compound annual growth rate (CAGR) of 14.3%. By 2030, the cumulative renewable capacity is expected to rise to 884.6GW, growing at a CAGR of 14% from 2020 to 2030. Despite increase in prices of renewable equipment, such as solar modules, in 2021, the US renewable sector will show strong growth during the 2021 to 2030 period as this increase in equipment prices are short term due to supply chain disruptions caused by the Covid-19 pandemic.

The expansion of renewable power capacity during the 2000 to 2020 period has been possible due to the introduction of federal schemes, such as Production Tax Credits, Investment Tax Credits and Manufacturing Tax Credits. These have massively aided renewable installations by bringing down the cost of renewable power generation and making it at par with power generated from conventional sources. Over the last few years, the cost of solar PV and wind power installations has declined sharply, and by 2023 wind, solar, and batteries made up most of the utility-scale pipeline across the US, highlighting investor confidence. Since 2010, the cost of utility-scale solar PV projects decreased by around 82% while onshore wind installations decreased by around 39%. This has supported the rapid expansion of the renewable market. However, the price of solar equipment has risen due to an increase in raw material prices and supply shortages. This may slightly delay the financing of some solar projects that are already in the pipeline.

The US will continue to add significant renewable capacity additions during the forecast period as industry outlooks point to record solar and storage installations over the coming years, to meet its target of reaching 80% clean energy by 2030. In November 2021, President Biden signed a $1tr Infrastructure Bill, within which $73bn is designated to renewables. This includes not just renewable capacity building, but also strengthening the country’s power grid and laying new high voltage transmission lines, both of which will be key to driving solar and wind power capacity additions as wind power surges in the U.S. electricity mix nationwide.

The US was one of the worst hit countries in the world due to the Covid-19 pandemic in 2020. With respect to the power sector, the electricity consumption in the country declined by 2.5% in 2020 as compared to 2019, even as renewable electricity surpassed coal in 2022 in the generation mix, highlighting continued structural change. Power plants that were under construction faced delays due to unavailability of components due to supply chain disruptions and unavailability of labour due to travel restrictions.

According to the US Energy Information Administration, 61 power projects, having a total capacity of 2.4GWm which were under construction during March and April 2020 were delayed because of the Covid-19 pandemic. Among renewable power technologies, solar PV and wind power projects were the most badly affected due to the pandemic.

In March and April 2020, 53 solar PV projects, having a total capacity of 1.3GW, and wind power projects, having a total capacity of 1.2GW, were delayed due to the Covid-19 pandemic. Moreover, several states suspended renewable energy auctions due to the pandemic.

For instance, New York State Energy Research and Development Authority (NYSERDA) had issued a new offshore wind solicitation for 1GW and up to 2.5GW in April 2020, but this was suspended due to the Covid-19 pandemic. In July 2020, the authority relaunched the tender for 2.5GW of offshore wind capacity, with a submission deadline in October 2020.

To ease the financial burden on consumers during the pandemic, more than 1,000 utilities in the country announced disconnection moratoria and implemented flexible payment plans. Duke Energy, American Electric Power, Dominion Power and Southern California Edison were among the major utilities that voluntarily suspended disconnections.


Related News

View more

Sign Up for Electricity Forum’s Newsletter

Stay informed with our FREE Newsletter — get the latest news, breakthrough technologies, and expert insights, delivered straight to your inbox.

Electricity Today T&D Magazine Subscribe for FREE

Stay informed with the latest T&D policies and technologies.
  • Timely insights from industry experts
  • Practical solutions T&D engineers
  • Free access to every issue

Download the 2025 Electrical Training Catalog

Explore 50+ live, expert-led electrical training courses –

  • Interactive
  • Flexible
  • CEU-cerified