Canada Electricity Supply Crunch underscores grid reliability risks, aging infrastructure, and rising demand, pushing upgrades in transmission, energy storage, smart grid technology, and renewable energy integration to protect industry, consumers, and climate goals.
Key Points
A nationwide power capacity shortfall stressing the grid, raising outage risks and slowing the renewable transition.
✅ Demand growth and aging infrastructure strain transmission capacity
✅ Smart grid, storage, and interties improve reliability and flexibility
✅ Accelerated renewables and efficiency reduce fossil fuel reliance
Canada, known for its vast natural resources and robust energy sector, is now confronting a significant challenge: a crunch in electrical supply. A recent report from EnergyNow.ca highlights the growing concerns over Canada’s electricity infrastructure, revealing that the country is facing a critical shortage that could impact both consumers and industries alike. This development raises pressing questions about the future of Canada’s energy landscape and its implications for the nation’s economy and environmental goals.
The Current Electrical Supply Dilemma
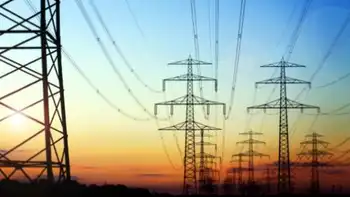
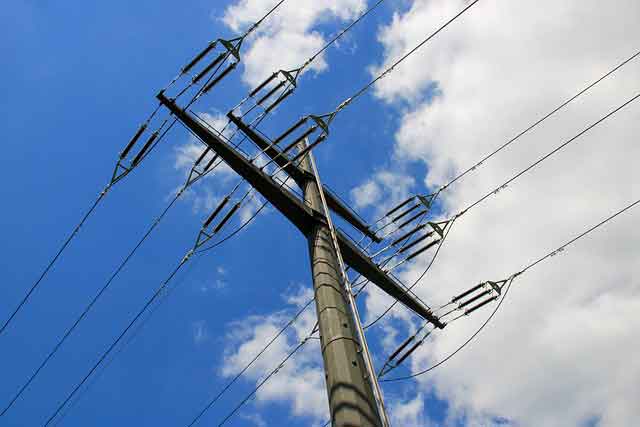
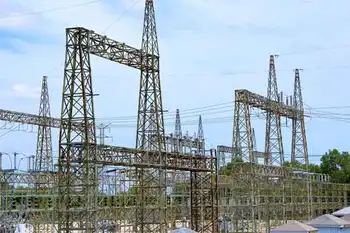
According to EnergyNow.ca, Canada’s electrical supply is under unprecedented strain due to several converging factors. One major issue is the rapid pace of economic and population growth, particularly in urban centers. This expansion has increased demand for electricity, putting additional pressure on an already strained grid. Compounding this issue are aging infrastructure and a lack of sufficient investment in modernizing the electrical grid to meet current and future needs, with interprovincial frictions such as the B.C. challenge to Alberta's export restrictions further complicating coordination.
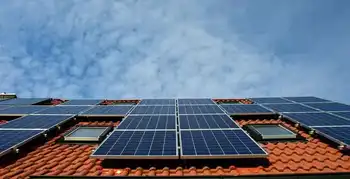
The report also points out that Canada’s reliance on certain types of energy sources, including fossil fuels, exacerbates the problem. While the country has made strides in renewable energy, including developments in clean grids and batteries across provinces, the transition has not kept pace with the rising demand for electricity. This imbalance highlights a crucial gap in Canada’s energy strategy that needs urgent attention.
Economic and Social Implications
The shortage in electrical supply has significant economic and social implications. For businesses, particularly those in energy-intensive sectors such as manufacturing and technology, the risk of power outages or unreliable service can lead to operational disruptions and financial losses. Increased energy costs due to supply constraints could also affect profit margins and competitiveness on both domestic and international fronts, with electricity exports at risk amid trade tensions.
Consumers are not immune to the impact of this electrical supply crunch. The potential for rolling blackouts or increased energy prices, as debates over electricity rates and innovation continue nationwide, can strain household budgets and affect overall quality of life. Additionally, inconsistent power supply can affect essential services, including healthcare facilities and emergency services, highlighting the critical nature of reliable electricity for public safety and well-being.
Investment and Infrastructure Upgrades
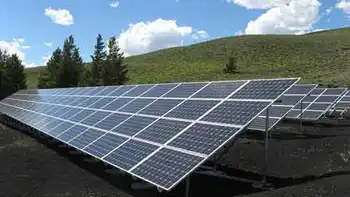
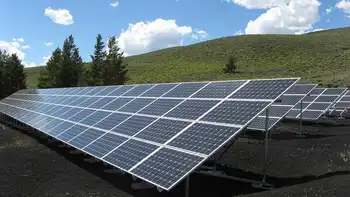
Addressing the electrical supply crunch requires significant investment in infrastructure and technology, and recent tariff threats have boosted support for Canadian energy projects that could accelerate these efforts. The EnergyNow.ca report underscores the need for modernizing the electrical grid to enhance capacity and resilience. This includes upgrading transmission lines, improving energy storage solutions, and expanding the integration of renewable energy sources such as wind and solar power.
Investing in smart grid technology is also essential. Smart grids use digital communication and advanced analytics to optimize electricity distribution, detect outages, and manage demand more effectively. By adopting these technologies, Canada can better balance supply and demand, reduce the risk of blackouts, and improve overall efficiency in energy use.
Renewable Energy Transition
Transitioning to renewable energy sources is a critical component of addressing the electrical supply crunch. While Canada has made progress in this area, the pace of change needs to accelerate under the new Clean Electricity Regulations for 2050 that set long-term targets. Expanding the deployment of wind, solar, and hydroelectric power can help diversify the energy mix and reduce reliance on fossil fuels. Additionally, supporting innovations in energy storage and grid management will enhance the reliability and sustainability of renewable energy.
The EnergyNow.ca report highlights several ongoing initiatives and projects aimed at increasing renewable energy capacity. However, these efforts must be scaled up and supported by both public policy and private investment to ensure that Canada can meet its energy needs and climate goals.
Policy and Strategic Planning
Effective policy and strategic planning are crucial for addressing the electrical supply challenges, with an anticipated electricity market reshuffle in at least one province signaling change ahead. Government action is needed to support infrastructure investment, incentivize renewable energy adoption, and promote energy efficiency measures. Collaborative efforts between federal, provincial, and municipal governments, along with private sector stakeholders, will be key to developing a comprehensive strategy for managing Canada’s electrical supply.
Public awareness and engagement are also important. Educating consumers about energy conservation practices and encouraging the adoption of energy-efficient technologies can contribute to reducing overall demand and alleviating some of the pressure on the electrical grid.
Conclusion
Canada’s electrical supply crunch is a pressing issue that demands immediate and sustained action. The growing demand for electricity, coupled with aging infrastructure and a lagging transition to renewable energy, poses significant challenges for the country’s economy and daily life. Addressing this issue will require substantial investment in infrastructure, advancements in technology, and effective policy measures. By taking a proactive and collaborative approach, Canada can navigate this crisis and build a more resilient and sustainable energy future.
Related News