Can green avoid soaring nuclear costs?

By Toronto Star


NFPA 70b Training - Electrical Maintenance

Our customized live online or in‑person group training can be delivered to your staff at your location.

  • Live Online
  • 12 hours Instructor-led
  • Group Training Available
Regular Price:
$599
Coupon Price:
$499
Reserve Your Seat Today
Ontario needs a frank and public debate on how to protect electricity consumers from the rising costs of the McGuinty government's nuclear plans.

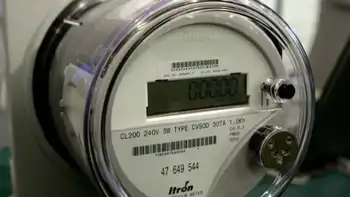
The government's decision to restrict public consultation on revisions to its long-term electricity plan to a web-based survey simply dodges any meaningful public debate. This will end up costing the ratepayer and the environment.

We were told in 2007 it would cost $26 billion to keep nuclear at 50 per cent of electricity supply. That would repair 12 operating reactors and build two new ones. Since then, we've learned that building just two new reactors would cost $26 billion - sucking up the entire 20-year nuclear spending plan.

It takes 10 years to build new reactors and up to five to repair old ones, so the full cost of the government's nuclear plan hasn't hit our bills yet. But painful price hikes are coming unless the Ontario government reins in its nuclear plans.

Four trends point to need for a plan to protect the ratepayer from nuclear cost increases. These require meaningful consultations with the public.

Rising reactor repair costs: All of Ontario's Candu reactors must be rebuilt or closed over the next decade. In the last 10 years, the estimated costs of repairing a Candu have jumped to $2.5 billion from $300 million. This means repairing both Darlington and Bruce B reactors over the next decade would top $20 billion before the inevitable cost over-runs.

Rising new reactor costs: The cost to build two new reactors in Ontario has jumped to a reported $26 billion from $6 billion. Yet the government's response was to reaffirm its commitment to new reactors.

Aging reactor maintenance costs: Keeping Ontario's old reactors operating safely costs a lot of money. The cost of operating the province's oldest reactors at Pickering ignoring the billions it cost to repair them just five years ago is three times more than the newest reactors at Darlington. We can expect these costs to continue rising.

Privatization of Atomic Energy of Canada Limited AECL: Ontario has always enjoyed subsidized maintenance and repair services from AECL, the federally backstopped reactor vendor. After more than $20 billion in subsidies, the Harper government is rightfully pulling the plug. Ontario will increasingly face the true costs of reactor operation and repair.

Politicians are ignoring these trends because voters won't feel the impact until after the next election. A more responsible approach, however, would be to prevent future nuclear rate hikes by expanding the province's existing impressive but limited green energy and conservation programs, which would have the side-benefit of creating more green jobs across Ontario.

First, the province's conservation programs need to start prioritizing the reduction of total energy consumption and not just shifting when it is used. This will deliver lower bills and less pollution.

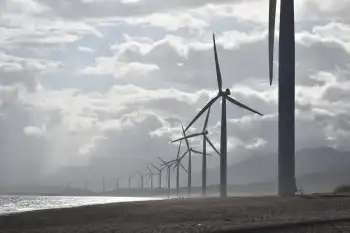
Second, the government should expand the use of new green energy above its current target of 10 per cent of supply. Analysis and international experience show that green energy at current prices would be cheaper than building new reactors to replace the retiring Pickering reactors.

Finally, put measures in place to protect the ratepayer from the risks of reactor repair, construction and operation. Tell Ontario's nuclear operators — OPG and Bruce Power — they can't pass cost over-runs on to the ratepayer — just like renewable operators under the Green Energy Act.

Luckily, while nuclear costs have only risen over the industry's 50-year history, the costs for modern green power technologies are dropping rapidly. The government's Green Energy Act is admirably designed to lower the prices paid for new green power over time.

Ontario's other political parties should be asked how they will protect ratepayers from nuclear rate-hikes.

Tory Leader Tim Hudak is positioning himself as the defender of tax- and ratepayers. He should tell reactor operators they can't pass their cost over-runs on to Ontarians. Hudak should also explain how his calls for increasing nuclear reliance beyond the government's plans won't drive up electricity prices.

Andrea Howarth's NDP, the self-appointed defenders of public power, should be demanding why the McGuinty government has prohibited OPG from developing wind and solar power projects — and potentially doomed it to extinction by limiting it to running expensive aging reactors.

Ratepayers are still paying off the decades-old nuclear debt from building the first generation of reactors. We should not repeat that mistake again.

With nuclear costs increasing as green costs decrease, it's time we had an honest and transparent debate on the best path forward. A web survey doesn't cut it.

Related News

Invest in Hydropower to Tackle Coronavirus and Climate Crisis Impacts

Hydropower Covid-19 Resilience highlights clean, reliable energy and flexible grid services, with pumped storage, automation, and affordability supporting climate action, decarbonization, and recovery through sustainable infrastructure, policy incentives, and capacity upgrades.


Key Points

Hydropower Covid-19 Resilience is the sector's ability to ensure clean, reliable, flexible power during crises.

✅ Record 4,306 TWh in 2019, avoiding 80-100 Mt CO2e emissions.

✅ 1,308 GW installed; 15.6 GW added; flexibility and storage in demand.

✅ Policy, tax incentives, and fast-track approvals to spur projects.


The Covid-19 pandemic has underlined hydropower's resilience and critical role in delivering clean, reliable and affordable energy, especially in times of crisis, as highlighted by IAEA lessons for low-carbon electricity. This is the conclusion of two new reports published by the International Hydropower Association (IHA).

The 2020 Hydropower Status Report presents latest worldwide installed capacity and generation data, showcasing the sector's contribution to global carbon reduction efforts, with low-emissions sources projected to cover almost all demand increases in the next three years. It is published alongside a Covid-19 policy paper featuring recommendations for governments, financial institutions and industry to respond to the current health and economic crisis.

"Preventing an emergency is far better than responding to one," says Roger Gill, President of IHA, highlighting the need to incentivise investments in renewable infrastructure, a view echoed by Fatih Birol during the crisis. "The events of the past few months must be a catalyst for stronger climate action, including greater development of sustainable hydropower."

Now in its seventh edition, the Hydropower Status Report shows electricity generation hit a record 4,306 terawatt hours (TWh) in 2019, the single greatest contribution from a renewable energy source in history, aligning with the outlook that renewables to surpass coal by 2025.

The annual rise of 2.5 per cent (106 TWh) in hydroelectric generation - equivalent to the entire electricity consumption of Pakistan - helped to avoid an estimated additional 80-100 million metric tonnes of greenhouse gases being emitted last year.

The report also highlights:

* Global hydropower installed capacity reached 1,308 gigawatts (GW) in 2019, as 50 countries completed greenfield and upgrade projects, including pumped storage and repowering old dams in some regions.

* A total of 15.6 GW in installed capacity was added in 2019, down on the 21.8 GW recorded in 2018. This represents a rise of 1.2 per cent, which is below the estimated 2.0 per cent growth rate required for the world to meet Paris Agreement carbon reduction targets.

* India has overtaken Japan as the fifth largest world hydropower producer with its total installed capacity now standing at over 50 GW. The countries with the highest increases in were Brazil (4.92 GW), China (4.17 GW) and Laos (1.89 GW).

* Hydropower's flexibility services have been in high demand during the Covid-19 crisis, even as global demand dipped 15% globally, while plant operations have been less affected due to the degree of automation in modern facilities.

* Hydropower developments have not been immune to economic impacts however, with the industry facing widespread uncertainty and liquidity shortages which have put financing and refinancing of some projects at risk.

In a companion policy paper, IHA sets out the immediate impacts of the crisis on the sector, noting how European responses to Covid-19 have accelerated the electricity system transition, as well as recommendations to assist governments and financial institutions and enhance hydropower's contribution to the recovery.

The recommendations include:

  • Increasing the ambition of renewable energy and climate change targets which incorporate the role of sustainable hydropower development.
  • Supporting sustainable hydropower through introducing appropriate financial measures such as tax incentives to ensure viable and shovel-ready projects can commence.
  • Fast-tracking planning approvals to ensure the development and modernisation of hydropower projects can commence as soon as possible, in line with internationally recognised sustainability guidelines.
  • Safeguarding investment by extending deadlines for concession agreements and other awarded projects.
  • Given the increasing need for long-duration energy storage such as pumped storage, working with regulators and system operators to develop appropriate compensation mechanisms for hydropower's flexibility services.


Related News

View more

Was there another reason for electricity shutdowns in California?

PG&E Wind Shutdown and Renewable Reliability examines PSPS strategy, wildfire risk, transmission line exposure, wind turbine cut-out speeds, grid stability, and California's energy mix amid historic high-wind events and supply constraints across service areas.


Key Points

An overview of PG&E's PSPS decisions, wildfire mitigation, and how wind cut-out limits influence grid reliability.

✅ Wind turbines reach cut-out near 55 mph, reducing generation.

✅ PSPS mitigates ignition from damaged transmission infrastructure.

✅ Baseload diversity improves resilience during high-wind events.


According to the official, widely reported story, Pacific Gas & Electric (PG&E) initiated power shutoffs across substantial portions of its electric transmission system in northern California as a precautionary measure.

Citing high wind speeds they described as “historic,” the utility claims that if it didn’t turn off the grid, wind-caused damage to its infrastructure could start more wildfires.

Perhaps that’s true. Perhaps. This tale presumes that the folks who designed and maintain PG&E’s transmission system are unaware of or ignored the need to design it to withstand severe weather events, and that the Federal Energy Regulatory Commission (FERC) and North American Electric Reliability Corp. (NERC) allowed the utility to do so.

Ignorance and incompetence happens, to be sure, but there’s much about this story that doesn’t smell right—and it’s disappointing that most journalists and elected officials are apparently accepting it without question.

Take, for example, this statement from a Fox News story about the Kincade Fires: “A PG&E meteorologist said it’s ‘likely that many trees will fall, branches will break,’ which could damage utility infrastructure and start a fire.”

Did you ever notice how utilities cut wide swaths of trees away when transmission lines pass through forests? There’s a reason for that: When trees fall and branches break, the grid can still function, and even as the electric rhythms of New York City shifted during COVID-19, operators planned for variability.

So, if badly designed and poorly maintained infrastructure isn’t the reason PG&E cut power to millions of Californians, what might have prompted them to do so? Could it be that PG&E’s heavy reliance on renewable energy means they don’t have the power to send when a “historic” weather event occurs, especially as policymakers weigh the postponed closure of three power plants elsewhere in California?


Wind Speed Limits

The two most popular forms of renewable energy come with operating limitations, which is why some energy leaders urge us to keep electricity options open when planning the grid. With solar power, the constraint is obvious: the availability of sunlight. One doesn’t generate solar power at night and energy generation drops off with increasing degrees of cloud cover during the day.

The main operating constraint of wind power is, of course, wind speed, and even in markets undergoing 'transformative change' in wind generation, operators adhere to these technical limits. At the low end of the scale, you need about a 6 or 7 miles-per-hour wind to get a turbine moving. This is called the “cut-in speed.” To generate maximum power, about a 30 mph wind is typically required. But, if the wind speed is too high, the wind turbine will shut down. This is called the “cut-out speed,” and it’s about 55 miles per hour for most modern wind turbines.

It may seem odd that wind turbines have a cut-out speed, but there’s a very good reason for it. Each wind turbine rotor is connected to an electric generator housed in the turbine nacelle. The connection is made through a gearbox that is sized to turn the generator at the precise speed required to produce 60 Hertz AC power.

The blades of the wind turbine are airfoils, just like the wings of an airplane. Adjusting the pitch (angle) of the blades allows the rotor to maintain constant speed, which, in turn, allows the generator to maintain the constant speed it needs to safely deliver power to the grid. However, there’s a limit to blade pitch adjustment. When the wind is blowing so hard that pitch adjustment is no longer possible, the turbine shuts down. That’s the cut-out speed.

Now consider how California’s power generation profile has changed. According to Energy Information Administration data, the state generated 74.3 percent of its electricity from traditional sources—fossil fuels and nuclear, amid debates over whether to classify nuclear as renewable—in 2001. Hydroelectric, geothermal, and biomass-generated power accounted for most of the remaining 25.7 percent, with wind and solar providing only 1.98 percent of the total.

By 2018, the state’s renewable portfolio had jumped to 43.8 percent of total generation, with clean power increasing and wind and solar now accounting for 17.9 percent of total generation. That’s a lot of power to depend on from inherently unreliable sources. Thus, it wouldn’t be at all surprising to learn that PG&E didn’t stop delivering power out of fear of starting fires, but because it knew it wouldn’t have power to deliver once high winds shut down all those wind turbines


Related News

View more

California Skirts Blackouts With Heat Wave to Test Grid Again

California Heatwave Power Crisis strains CAISO as record demand triggers emergency alerts, demand response, and rolling blackout warnings. PG&E prepares outages while solar fades at peak, drought cuts hydropower, and reliability hinges on conservation.


Key Points

Extreme heat driving record demand in California, straining CAISO and prompting conservation to avert rolling blackouts.

✅ CAISO hit a record 52 GW peak load amid triple-digit heat

✅ Emergency alerts spurred demand response, cutting load spikes

✅ Solar drop and drought-weakened hydro worsened evening shortfall


California narrowly avoided blackouts for a second successive day even as blistering temperatures pushed electricity demand to a record and stretched the state’s power grid close to its limits.

The state imposed its highest level of energy emergency for several hours late Tuesday and urged consumers to turn off lights, curb air conditioners and shut off power-hungry appliances after a day of extraordinary stress on electricity infrastructure as temperatures in many regions topped 110 degrees Fahrenheit (43 Celsius).

Electricity use had reached 52 gigawatts Tuesday, easily breaking a record that stood since 2006, according to the California Independent System Operator. The state issued emergency alerts direct to cell phones in several counties asking for immediate power conservation, and grid data show that demand plunged in response. Emergency measures were finally lifted at about 9 p.m. local time.

Much of California remains under an excessive heat warning through Friday, with authorities already preparing for more severe pressure on the power system on Wednesday amid a looming supply shortage across the grid. “We aren’t out of the woods yet,” Governor Gavin Newsom said in a message posted on his office’s Twitter account. “We will see continued extreme temps this week and if we rallied today, we can do it again.”

The state’s largest power company, PG&E Corp. said earlier Tuesday that it had notified about 525,000 homes and businesses that they could lose power for up to two hours. That warning came as temperatures in downtown Sacramento hit 116 degrees Fahrenheit, topping a previous 1925 record.

Newsom earlier signed an executive order extending until Friday emergency measures to free up additional power supplies, rather than allowing them to expire as planned on Wednesday. Many state buildings were ordered to power down lights and air conditioning at 4 p.m., and he urged residents and businesses to conserve the equivalent of 3 gigawatts of power in order to stave off blackouts. 

California's Early Brush With Blackouts Bodes Ill For Days Ahead
The downtown skyline during a heatwave in Los Angeles.Photographer: Eric Thayer/Bloomberg
California faced a similar energy emergency Monday, which was alleviated in part by activating temporary gas-fired power plants operated by the California Department of Water Resources. The current heat wave, which began in the last week of August, is remarkable in both its ferocity and duration, according to officials. 

The prospect of outages underscores how grids have become vulnerable in the face of extreme weather as California transitions from fossil fuels to renewable energy, an approach it is increasingly exporting to Western states as well. California's climate policies have aggressively closed natural-gas power plants in recent years, leaving the state increasingly dependent on solar farms that go dark late in the day just as electricity demand peaks. At the same time, the state is enduring the Southwest’s worst drought in 1,200 years, sapping hydropower production.

The average 15-minute wholesale power price in Caiso surged to $1,806 a megawatt-hour at 4:45 p.m. local time, according to the grid operator’s website.

Average day-ahead prices top $300 a megawatt-hour in Southern California
  
A break from the heat will come across Southern California later this week, thanks to Tropical Storm Kay in the Pacific Ocean, according to weather officials. Kay is forecast to edge up the coastline of Mexico’s Baja California peninsula. As it moves north, the storm will pump moisture and clouds into Southern California and Arizona, taking an edge off the heat.


Related News

View more

EIA expects solar and wind to be larger sources of U.S. electricity generation this summer

US Summer Electricity Outlook 2022 projects rising renewable energy generation as utility-scale solar and wind capacity additions surge, while coal declines and natural gas shifts amid higher fuel prices and regional supply constraints.


Key Points

An EIA forecast of summer 2022 power: more solar and wind, less coal, and shifting gas use amid higher fuel prices.

✅ Solar +10 million MWh; wind +8 million MWh vs last summer

✅ Coal generation -20 million MWh amid supply constraints, retirements

✅ Gas prices near $9/MMBtu; slight national gen decline


In our Summer Electricity Outlook, a supplement to our May 2022 Short-Term Energy Outlook, we expect the largest increases in U.S. electric power sector generation this summer will come from renewable energy sources such as wind and solar generation. These increases are the result of new capacity additions. We forecast utility-scale solar generation between June and August 2022 will grow by 10 million megawatthours (MWh) compared with the same period last summer, and wind generation will grow by 8 million MWh. Forecast generation from coal and natural gas declines by 26 million MWh this summer, although natural gas generation could increase in some electricity markets where coal supplies are constrained.

For recent context, overall U.S. power generation in January rose 9.3% year over year, the EIA reports.

Wind and solar power electric-generating capacity has been growing steadily in recent years. By the start of June, we estimate the U.S. electric power sector will have 65 gigawatts (GW) of utility-scale solar-generating capacity, a 31% increase in solar capacity since June 2021. Almost one-third of this new solar capacity will be built in the Texas electricity market. The electric power sector will also have an estimated 138 GW of wind capacity online this June, which is a 12% increase from last June.

Along with growth in renewables capacity, we expect that an additional 6 GW of new natural gas combined-cycle generating capacity will come online by June 2022, an increase of 2% from last summer. Despite this increase in capacity, we expect natural gas-fired electricity generation at the national level will be slightly (1.3%) lower than last summer.

We forecast the price of natural gas delivered to electric generators will average nearly $9 per million British thermal units between June and August 2022, which would be more than double the average price last summer. The higher expected natural gas prices and growth in renewable generation will likely lead to less natural gas-fired generation in some regions of the country.

In contrast to renewables and natural gas, the electricity industry has been steadily retiring coal-fired power plants over the past decade. Between June 2021 and June 2022, the electric power sector will have retired 6 GW (2%) of U.S. coal-fired generating capacity.

In previous years, higher natural gas prices would have resulted in more coal-fired electricity generation across the fleet. However, coal-fired power plants have been limited in their ability to replenish their historically low inventories in recent months as a result of mine closures, rail capacity constraints, and labor market tightness. These coal supply constraints, along with continued retirement of generating capacity, contribute to our forecast that U.S. coal-fired generation will decline by 20 million MWh (7%) this summer. In some regions of the country, these coal supply constraints may lead to increased natural gas-fired electricity generation despite higher natural gas prices.


Related News

View more

B.C. Hydro doing good job managing billions in capital assets, says auditor

BC Hydro Asset Management Audit confirms disciplined oversight of dams, generators, power lines, substations, and transformers, with robust lifecycle planning, reliability metrics, and capital investment sustaining aging infrastructure and near full-capacity performance.


Key Points

Audit confirming BC Hydro's asset governance and lifecycle planning, ensuring safe, reliable grid infrastructure.

✅ $25B in assets; many facilities operating near full capacity.

✅ 80% of assets are dams, generators, lines, poles, substations, transformers.

✅ $2.5B invested in renewal, repair, and replacement in fiscal 2018.


A report by B.C.’s auditor-general says B.C. Hydro is doing a good job managing the province’s dams, generating stations and power lines, including storm response during severe weather events.

Carol Bellringer says in the audit that B.C. Hydro’s assets are valued at more than $25 billion and even though some generating facilities are more than 85 years old they continue to operate near full-capacity and can accommodate holiday demand peaks when needed.

The report says about 80 per cent of Hydro’s assets are dams, generators, power lines, poles, substations and transformers that are used to provide electrical service to B.C., where residential electricity use shifted during the pandemic.

The audit says Hydro invested almost $2.5 billion to renew, repair or replace the assets it manages during the last fiscal year, ending March 31, 2018, and, in a broader context, bill relief has been offered to only part of the province.

Bellringer’s audit doesn’t examine the $10.7 billion Site C dam project, which is currently under construction in northeast B.C. and not slated for completion until 2024.

She says the audit examined whether B.C. Hydro has the information, practices, processes and systems needed to support good asset management, at a time when other utilities are dealing with pandemic impacts on operations.


Related News

View more

U.S. Electricity Sales Projections Continue to Fall

US Electricity Demand Outlook examines EIA forecasts, GDP decoupling, energy efficiency, electrification, electric vehicles, grid load growth, and weather variability to frame long term demand trends and utility planning scenarios.


Key Points

An analysis of EIA projections showing demand decoupling from GDP, with EV adoption and efficiency shaping future grid load.

✅ EIA lowers load growth; demand decouples from GDP.

✅ Efficiency and sector shifts depress kWh sales.

✅ EV adoption could revive load and capacity needs.


Electricity producers and distributors are in an unusual business. The product they provide is available to all customers instantaneously, literally at the flip of a switch. But the large amount of equipment, both hardware and software to do this takes years to design, site and install.

From a long range planning perspective, just as important as a good engineering design is an accurate sales projections. For the US electric utility industry the most authoritative electricity demand projec-tions come from the Department of Energy’s Energy Information Administration (EIA). EIA's compre-hensive reports combine econometric analysis with judgment calls on social and economic trends like the adoption rate of new technologies that could affect future electricity demand, things like LED light-ing and battery powered cars, and the rise of renewables overtaking coal in generation.

Before the Great Recession almost a decade ago, the EIA projected annual growth in US electricity production at roughly 1.5 percent per year. After the Great Recession began, the EIA lowered its projections of US electricity consumption growth to below 1 percent. Actual growth has been closer to zero. While the EIA did not antici-pate the last recession or its aftermath, we cannot fault them on that.

After the event, though, the EIA also trimmed its estimates of economic growth. For the 2015-2030 period it now predicts 2.1 percent economic and 0.3 percent electricity growth, down from previously projections of 2.7 percent and 1.3 percent respectively. (See Figures 1 and 2.)


Table 1. EIA electric generation projections by year of forecast (kWh billions)


Table 2. EIA forecast of GDP by year of forecast (billion 2009 $)

Back in 2007, the EIA figured that every one percent increase in economic activity required a 0.48 percent in-crease in electric generation to support it. By 2017, the EIA calculated that a 1 percent growth in economic activity now only required a 0.14 percent increase in electric output. What accounts for such a downgrade or disconnect between electricity usage and economic growth? And what factors might turn the numbers 
around?

First, the US economy lost energy intensive heavy industry like smelting, steel mills and refineries; patterns in China's electricity sector highlight how industrial shifts can reshape power demand. A more service oriented economy (think health care) relies more heavily on the movement of data or information and uses far less power than a manufacturing-oriented economy.

A small volcano in Argentina is about to fuel the next tech boom – and a little known company is going to be right at the center. Early investors stand to gain incredible profits and you can too. Read the report.

Second, internet shopping has hurt so-called "brick and mortar" retailers. Despite the departure of heavy industry, in years past a burgeoning US commercial sector increased its demand and usage of electricity to offset the industrial decline. But not anymore. Energy efficiency measures as well as per-haps greater concern about global warming and greenhouse gas emissions and have cut into electricity sales. “Do more with less” has the right ring to it.

But there may be other components to the ongoing decline in electricity usage. Academic studies show that electricity usage seems to increase with income along an S curve, and flattens out after a certain income level. That is, if you earn $1 billion per year you do not (or cannot) use ten times a much electricity as someone earning only $100 million.

But people at typical, middle income levels increase or decrease electricity usage when incomes rise or fall. The squeeze on middle income families was discussed often in the late presidential campaign. In recent decades an increasing percentage of income has gone to a small percentage of the population at the top of the income scale. This trend probably accounts for some weakness in residential sales. This suggests that government policy addressing income inequality would also boost electricity sales.

Population growth affects demand for electricity as well as the economy as a whole. The EIA has made few changes in its projections, showing 0.7 percent per year population growth in 2015- 2030 in both the 2007 and 2017 forecasts. Recent studies, however, have shown a drop in the birth rate to record lows. More troubling, from a national health perspective is that the average age of death may have stopped rising. Those two factors point to lower population growth, especially if the government also restricts immi-gration. Thus, the US may be approaching a period of rather modest population growth.

All of the above factors point to minimal sales growth for electricity producers in the US--perhaps even lower than the seemingly conservative EIA estimates. But the cloud on the horizon has a silver lining in the shape of an electric car. Both the United Kingdom and France have set dates to end of production of automobiles with internal combustion engines. Several European car makers have declared that 20 percent of their output will be electric vehicles by the early 2020s. If we adopt automobiles powered by electricity and not gasoline or diesel, electricity sales would increase by one third. For the power indus-try, electric vehicles represent the next big thing.

We don’t pretend to know how electric car sales will progress. But assume vehicle turnover rates re-main at the current 7 percent per year and electric cars account for 5 percent of sales in the first five years (as op-posed to 1 percent now), 20 percent in the next five years and 50 percent in the third five year period. Wildly optimistic assumptions? Maybe. By 2030, electric cars would constitute 28 percent of the vehicle fleet. They would add about 10 percent to kilowatt hour sales by that date, assuming that battery efficiencies do not improved by then. Those added sales would require increased electric generation output, with low-emissions sources expected to cover almost all the growth globally. They would also raise long term growth rates for 2015-2030 from the present 0.3 percent to 1.0 percent. The slow upturn in demand should give the electric companies time to gear up so to speak.

In the meantime, weather will continue to play a big role in electricity consumption. Record heat-induced demand peaks are being set here in the US even as surging global demand puts power systems under strain worldwide.

Can we discern a pattern in weather conditions 15 years out? Maybe we can, but that is one topic we don’t expect a government agency to tackle in public right now. Meantime, weather will affect sales more than anything else and we cannot predict the weather. Or can we?


Related News

View more

Sign Up for Electricity Forum’s Newsletter

Stay informed with our FREE Newsletter — get the latest news, breakthrough technologies, and expert insights, delivered straight to your inbox.

Electricity Today T&D Magazine Subscribe for FREE

Stay informed with the latest T&D policies and technologies.
  • Timely insights from industry experts
  • Practical solutions T&D engineers
  • Free access to every issue

Live Online & In-person Group Training

Advantages To Instructor-Led Training – Instructor-Led Course, Customized Training, Multiple Locations, Economical, CEU Credits, Course Discounts.

Request For Quotation

Whether you would prefer Live Online or In-Person instruction, our electrical training courses can be tailored to meet your company's specific requirements and delivered to your employees in one location or at various locations.