Germany Energy Transition faces offshore wind expansion, grid bottlenecks, and North-South transmission delays, while Nord Stream 2 boosts Russian gas reliance and lignite coal persists amid a nuclear phaseout and rising re-dispatch costs.
Key Points
Germanys shift to renewables faces grid delays, boosting gas via Nord Stream 2 and extending lignite coal use.
✅ Offshore wind grows, but grid congestion curtails turbines.
✅ Nord Stream 2 expands Russian gas supply to German industry.
✅ Lignite coal persists, raising emissions amid nuclear exit.
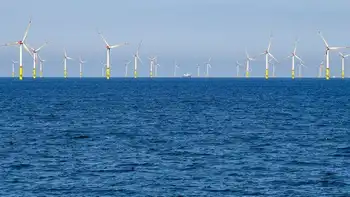
On a blazing hot August day on Germany’s Baltic Sea coast, a few hundred tourists skip the beach to visit the “Fascination Offshore Wind” exhibition, held in the port of Mukran at the Arkona wind park. They stand facing the sea, gawking at white fiberglass blades, which at 250 feet are longer than the wingspan of a 747 aircraft. Those blades, they’re told, will soon be spinning atop 60 wind-turbine towers bolted to concrete pilings driven deep into the seabed 20 miles offshore. By early 2019, Arkona is expected to generate 385 megawatts, enough electricity to power 400,000 homes.
“We really would like to give the public an idea of what we are going to do here,” says Silke Steen, a manager at Arkona. “To let them say, ‘Wow, impressive!’”
Had the tourists turned their backs to the sea and faced inland, they would have taken in an equally monumental sight, though this one isn’t on the day’s agenda: giant steel pipes coated in gray concrete, stacked five high and laid out in long rows on a stretch of dirt. The port manager tells me that the rows of 40-foot-long, 4-foot-thick pipes are so big that they can be seen from outer space. They are destined for the Nord Stream 2 pipeline, a colossus that, when completed next year, will extend nearly 800 miles from Russia to Germany, bringing twice the amount of gas that a current pipeline carries.
The two projects, whose cargo yards are within a few hundred feet of each other, provide a contrast between Germany’s dream of renewable energy and the political realities of cheap Russian gas. In 2010, Germany announced an ambitious goal of generating 80 percent of its electricity from renewable sources by 2050. In 2011, it doubled down on the commitment by deciding to shut down every last nuclear power plant in the country by 2022, as part of a broader coal and nuclear phaseout strategy embraced by policymakers. The German government has paid more than $600 billion to citizens and companies that generate solar and wind power. As a result, the generating capacity from renewable sources has soared: In 2017, a third of the nation’s electricity came from wind, solar, hydropower and biogas, up from 3.6 percent in 1990.
But Germany’s lofty vision has run into a gritty reality: Replacing fossil fuels and nuclear power in one of the largest industrial nations in the world is politically more difficult and expensive than planners thought. It has forced Germany to put the brakes on its ambitious renewables program, ramp up its investments in fossil fuels, amid a renewed nuclear option debate over climate strategy, and, to some extent, put its leadership role in the fight against climate change on hold.
The trouble lies with Germany’s electricity grid. Solar and wind power call for more complex and expensive distribution networks than conventional large power plants do. “What the Germans were good at was getting new technology into the market, like wind and solar power,” said Arne Jungjohann, author of Energy Democracy: Germany’s ENERGIEWENDE to Renewables. To achieve its goals, “Germany needs to overhaul its whole grid.”
The North-South Conundrum
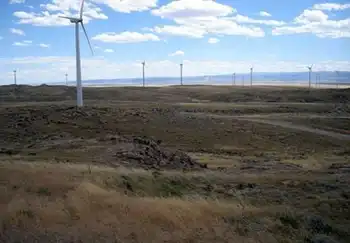
The boom in wind power has created an unanticipated mismatch between supply and demand. Big wind turbines, especially offshore plants such as Arkona, produce powerful, concentrated gusts of energy. That’s good when the factory that needs that energy is nearby and the wind kicks up during working hours. It’s another matter when factories are hundreds of miles away. In Germany, wind farms tend to be located in the blustery north. Many of the nation’s big factories lie in the south, which also happens to be where most of the country’s nuclear plants are being mothballed.
Getting that power from north to south is problematic. On windy days, northern wind farms generate too much energy for the grid to handle. Power lines get overloaded. To cope, grid operators ask wind farms to disconnect their turbines from the grid—those elegant blades that tourists so admired sit idle. To ensure a supply of power, operators employ backup generators at great expense. These so-called re-dispatching costs ran to 1.4 billion euros ($1.6 billion) last year.
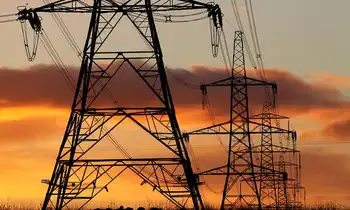
The solution is to build more power transmission lines to take the excess wind from northern wind farms to southern factories. A grid expansion project is underway to do exactly that. Nearly 5,000 miles of new transmission lines, at a cost of billions of euros, will be paid for by utility customers. So far, less than a fifth of the lines have been built.
The grid expansion is “catastrophically behind schedule,” Energy Minister Peter Altmaier told the Handelsblatt business newspaper in August. Among the setbacks: citizens living along the route of four high-voltage power lines have demanded the cables be buried underground, which has added to the time and expense. The lines won’t be finished before 2025—three years after Germany’s nuclear shutdown is due to be completed.
With this backlog, the government has put the brakes on wind power, reducing the number of new contracts for farms and curtailing the amount it pays for renewable energy. “In the past, we have focused too much on the mere expansion of renewable energy capacity,” Joachim Pfeiffer, a spokesman for the Christian Democratic Union, wrote to Newsweek. “We failed to synchronize this expansion of generation with grid expansion.”
Advocates of renewables are up in arms, accusing the government of suffocating their industry and making planning impossible. Thousands of people lost their jobs in the wind industry, according to Wolfram Axthelm, CEO of the German Wind Energy Association. “For 2019 and 2020, we see a highly problematic situation for the industry,” he wrote in an email.
Fueling the Gap
Nord Stream 2, by contrast, is proceeding according to schedule. A beige and black barge, Castoro 10, hauls dozens of lengths of giant pipe off Germany’s Baltic Sea coast, where a welding machine connects them for lowering onto the seabed. The $11 billion project is funded by Russian state gas monopoly Gazprom and five European investors, at no direct cost to the German taxpayer. It is slated to cross the territorial waters of five countries—Germany, Russia, Finland, Sweden and Denmark. All but Denmark have approved the route. “We have good reason to believe that after four governments said yes, that Denmark will also approve the pipeline,” says Nord Stream 2 spokesman Jens Mueller.
Construction of the pipeline off Finland began in September, and the gas is expected to start flowing in late 2019, giving Russia leverage to increase its share of the European gas market. It already provides a third of the gas used in the EU and will likely provide more after the Netherlands stops its gas production in 2030. President Donald Trump has called the pipeline “a very bad thing for NATO” and said that “Germany is totally controlled by Russia.” U.S. senators have threatened sanctions against companies involved in the project. Ukraine and Poland are concerned the new pipeline will make older pipelines in their territories irrelevant.
German leaders are also wary of dependence on Russia but are under considerable pressure to deliver energy to industry. Indeed, among the pipeline’s investors are German companies that want to run their factories, like BASF’s Wintershall subsidiary and Uniper, the German utility. “It’s not that Germany is naive,” says Kirsten Westphal, an energy expert at the German Institute for International and Security Affairs. It’s just pragmatic. “Economically, the judgment is that yes, this gas will be needed, we have an import gap to fill.”
The electricity transmission problem has also opened an opportunity for lignite coal, as coal generation in Germany remains significant, the most carbon-intensive fuel available and the source for nearly a quarter of Germany’s power. Mining companies are expanding their operations in coal-rich regions to strip out the fuel while it is still relevant. In the village of Pödelwitz, 155 miles south of Berlin, most houses feature a white sign with the logo of Mibrag, the German mining giant, which has paid nearly all the 130 residents to relocate. The company plans to level the village and scrape lignite that lies below the soil.
A resurgence in coal helped raise carbon emissions in 2015 and 2016 (2017 saw a slight decline), maintaining Germany’s place as Europe’s largest carbon emitter. Chancellor Angela Merkel has scrapped her pledge to slash carbon emissions to 40 percent of 1990 levels by the year 2020. Several members have threatened to resign from her policy commission on coal if the government allows utility company RWE to mine for lignite in Hambach Forest.
Only a few years ago, during the Paris climate talks, Germany led the EU in pushing for ambitious plans to curb emissions. Now, it seems to be having second thoughts. Recently, the European Union’s climate chief, Miguel Arias Cañete, suggested EU nations step up their commitment to reduce carbon emissions by 45 percent of 1990 levels instead of 40 percent by 2030. “I think we should first stick to the goals we have already set ourselves,” Merkel replied, even as a possible nuclear phaseout U-turn is debated, “I don’t think permanently setting ourselves new goals makes any sense.”
Related News