Human carbon emissions make oceans corrosive

By Reuters


Protective Relay Training - Basic

Our customized live online or in‑person group training can be delivered to your staff at your location.

  • Live Online
  • 12 hours Instructor-led
  • Group Training Available
Regular Price:
$699
Coupon Price:
$599
Reserve Your Seat Today
Carbon dioxide spewed by human activities has made ocean water so acidic that it is eating away at the shells and skeletons of starfish, coral, clams and other sea creatures, scientists said.

Marine researchers knew that ocean acidification, as it's called, was occurring in deep water far from land. What they called "truly astonishing" was the appearance of this damaging phenomenon on the Pacific North American continental shelf, stretching from Mexico to Canada.

"This means that ocean acidification may be seriously impacting our marine life on our continental shelf right now, today," said Richard Feely of the Pacific Marine Environmental Laboratory, part of the U.S. National Oceanic and Atmospheric Administration.

Other continental shelf regions around the world are likely to face the same fate, he said.

Plenty of natural activities, including human breath, send the greenhouse gas carbon dioxide into the atmosphere, but for the last 200 years or so, industrial processes that involve the burning of fossil fuels such as coal and petroleum have pushed emissions higher.

Oceans have long been repositories for the carbon dioxide, absorbing some 525 billion tonnes of the climate-warming substance over the last two centuries - about one-third of all human-generated carbon dioxide for that period.

But the daily absorption of 22 million tonnes of the stuff has changed the chemistry and biology of the oceans, turning it corrosive and making it difficult or impossible for some animals to produce their calcium carbonate shells and skeletons, the researchers said.

This change has been observed over the last three decades, the scientists said in research published in the journal Science.

The acidic waters are coming up onto the continental shelf - the shallow area near a big land mass like North America - because of a long-term churning ocean pattern that moves cold deep water up toward the surface in the spring and summer, the scientists said.

The carbon-loaded waters that are now near the U.S. West Coast took about 50 years to get there, starting somewhere on the ocean surface and absorbing their share of carbon dioxide, then sinking deep down and eventually welling upward.

The natural process called ocean respiration could not explain the high levels of carbon dioxide that caused the corrosive water the scientists found on the continental shelf; the addition of human-generated carbon dioxide did.

This acidic water is corroding the shells of clams, mussels, starfish and the free-floating sea-snails called pterapods that nourish young salmon, the researchers said, citing data from a 2007 research cruise.

Corrosion occurred in water that absorbed carbon dioxide from the atmosphere in 1957, when levels of this gas were considerably lower than they are now, the researchers said.

"This means that even if we were to stop instantaneously the current rate of rise of carbon dioxide in the atmosphere, the corrosivity of these upwelling waters would increase for the next 50 years," said Burke Hales, a professor of chemical oceanography at Oregon State University.

Related News

New York Faces Soaring Energy Bills

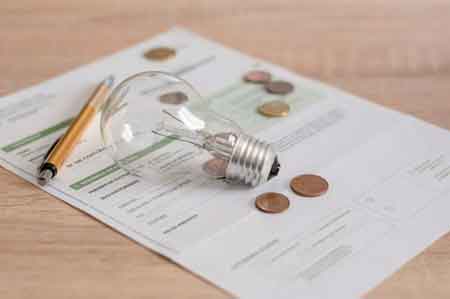
New York faces soaring energy bills as utilities seek record rate hikes, aging grid infrastructure demands upgrades, and federal renewable policies shift. Consumers struggle with affordability, late payments, and rising costs of delivery and energy supply across the state.


Why is New York Facing Soaring Energy Bills?

New York faces soaring energy bills because utilities are raising rates to cover the costs of grid upgrades, inflation, and policy-driven changes in energy supply.

✅ Utilities seek double-digit rate hikes across the state

✅ Aging infrastructure and storm repairs increase delivery costs

✅ Federal policies and gas dependence push energy prices higher

New Yorkers are bracing for another wave of energy bill increases as utilities seek record-high rate hikes and policy changes ripple through the state’s power system. Electric bills in New York are the highest they’ve been in over a decade, and more than a million households are now at least two months behind on payments, a sign of pandemic energy insecurity that continues to strain budgets, owing utilities nearly $2 billion.

Record numbers of households have had their electricity or gas shut off this year — more than 61,000 in May alone — despite pandemic shut-off suspensions that had offered temporary relief, the highest the Public Utility Law Project (PULP) has ever recorded. “This August was the group’s busiest month ever,” said Laurie Wheelock, PULP’s executive director, citing a surge in calls to its hotline. “The top concern on people’s minds: rate hikes.”

Utilities across the state are pushing for significant price increases, citing aging infrastructure, the need for climate adaptation, and higher operating costs, as California regulators face calls for action amid rising bills. “We used to see single-digit rate hikes and now we see double-digit rate hikes,” said Jessica Azulay, executive director of the Alliance for a Green Economy. “That’s a new normal that is unacceptable.”

Several utilities have requested delivery rate increases of 25 percent or more, with some proposals as high as 39 percent. Upstate utilities NYSEG and RG&E are seeking to raise electric and gas bills by about $33 a month, although regulators are unlikely to approve the full amount.

The companies argue the hikes are needed “to pay for rebuilding an aging grid and expanding its capacity to meet residents’ and businesses’ service demands,” including storm repairs. They also claim the plan would create more than 1,000 jobs.

James Denn, a spokesperson for the Public Service Commission (PSC), said much of the cost pressure stems from “inflation, higher interest rates, supply chain disruptions, the global push to upgrade electrical infrastructure, and, most recently, the rising risk and uncertainty from tariffs,” trends reflected in U.S. electricity price data over the past two years.

While some have blamed New York’s clean-energy transition, a PSC report found that state climate policies account for only 5 to 9.5 percent of the average household’s electric bill, or approximately $10 to $12 per month. The bulk of the increases still come from traditional spending on infrastructure, storm resilience, and system expansion.

On the supply side, costs are rising too. President Donald Trump’s recent policies have threatened renewable-energy investment nationwide, even as states’ renewable ambitions carry significant costs, potentially adding to New York’s woes. His July “megabill” phases out a 30 percent federal tax credit for solar and wind unless projects begin construction by mid-2026. Industry experts warn that the changes could make renewables “more expensive to build” and “increase reliance on gas.”

“It just means more expensive power,” said Marguerite Wells of the Alliance for Clean Energy New York.

The state estimates Trump’s policy shifts could cost New York $60 billion in lost renewable investment. With fewer clean-energy projects moving forward, gas — which already supplies roughly half of the state’s electricity — will remain the dominant source, tying energy prices to volatile global markets and the kinds of price drivers seen in California in recent years.

Governor Kathy Hochul has called affordability “our greatest short-term challenge,” while consumer advocates are demanding reforms to reduce utility profits and overhaul “rate design,” and to strengthen protections such as the emergency disconnection moratorium that applies during declared emergencies.

“There is definitely a groundswell of concern,” Wheelock said. “We go to meetings and we’re getting questions about rate design, like, ‘What is the revenue decoupling mechanism?’ Never had that question before.”


Related Articles


View more

How Energy Use Has Evolved Throughout U.S. History

U.S. Energy Transition traces the shift from coal and oil to natural gas, nuclear power, and renewables like wind and solar, driven by efficiency, grid modernization, climate goals, and economic innovation.


Key Points

The U.S. Energy Transition is the shift from fossil fuels to cleaner power, driven by tech, policy, and markets.

✅ Shift from coal and oil to gas, nuclear, wind, and solar

✅ Enabled by grid modernization, storage, and efficiency

✅ Aims to cut emissions while ensuring reliability and affordability


The evolution of energy use in the United States is a dynamic narrative that reflects technological advancements, economic shifts, environmental awareness, and societal changes over time. From the nation's early reliance on wood and coal to the modern era dominated by oil, natural gas, and renewable sources, the story of energy consumption in the U.S. is a testament to innovation and adaptation.

Early Energy Sources: Wood and Coal

In the early days of U.S. history, energy needs were primarily met through renewable resources such as wood for heating and cooking. As industrialization took hold in the 19th century, coal emerged as a dominant energy source, fueling steam engines and powering factories, railways, and urban growth. The widespread availability of coal spurred economic development and shaped the nation's infrastructure.

The Rise of Petroleum and Natural Gas

The discovery and commercialization of petroleum in the late 19th century transformed the energy landscape once again. Oil quickly became a cornerstone of the U.S. economy, powering transportation, industry, and residential heating, and informing debates about U.S. energy security in policy circles. Concurrently, natural gas emerged as a significant energy source, particularly for heating and electricity generation, as pipelines expanded across the country.

Electricity Revolution

The 20th century witnessed a revolution in electricity generation and consumption, and understanding where electricity comes from helps contextualize how systems evolved. The development of hydroelectric power, spurred by projects like the Hoover Dam and Tennessee Valley Authority, provided clean and renewable energy to millions of Americans. The widespread electrification of rural areas and the proliferation of appliances in homes and businesses transformed daily life and spurred economic growth.

Nuclear Power and Energy Diversification

In the mid-20th century, nuclear power emerged as a promising alternative to fossil fuels, promising abundant energy with minimal greenhouse gas emissions. Despite concerns about safety and waste disposal, nuclear power plants became a significant part of the U.S. energy mix, providing a stable base load of electricity, even as the aging U.S. power grid complicates integration of variable renewables.

Renewable Energy Revolution

In recent decades, the U.S. has seen a growing emphasis on renewable energy sources such as wind, solar, and geothermal power, yet market shocks and high fuel prices alone have not guaranteed a rapid green revolution, prompting broader policy and investment responses. Advances in technology, declining costs, and environmental concerns have driven investments in clean energy infrastructure and policies promoting renewable energy adoption. States like California and Texas lead the nation in wind and solar energy production, demonstrating the feasibility and benefits of transitioning to sustainable energy sources.

Energy Efficiency and Conservation

Alongside shifts in energy sources, improvements in energy efficiency and conservation have played a crucial role in reducing per capita energy consumption and greenhouse gas emissions. Energy-efficient appliances, building codes, and transportation innovations have helped mitigate the environmental impact of energy use while reducing costs for consumers and businesses, and weather and economic factors also influence demand; for example, U.S. power demand fell in 2023 on milder weather, underscoring the interplay between efficiency and usage.

Challenges and Opportunities

Looking ahead, the U.S. faces both challenges and opportunities in its energy future, as recent energy crisis effects ripple across electricity, gas, and EVs alike. Addressing climate change requires further investments in renewable energy, grid modernization, and energy storage technologies. Balancing energy security, affordability, and environmental sustainability remains a complex task that requires collaboration between government, industry, and society.

Conclusion

The evolution of energy use throughout U.S. history reflects a continuous quest for innovation, economic growth, and environmental stewardship. From wood and coal to nuclear power and renewables, each era has brought new challenges and opportunities in meeting the nation's energy needs. As the U.S. transitions towards a cleaner and more sustainable energy future, leveraging technological advancements and embracing policy solutions, amid debates over U.S. energy dominance, will be essential in shaping the next chapter of America's energy story.


Related News

View more

Sudbury, Ont., eco groups say sustainability is key to grid's future

Sudbury Electrification and Grid Expansion is driving record power demand, EV charging, renewable energy planning, IESO forecasts, smart grid upgrades, battery storage, and industrial electrification, requiring cleaner power plants and transmission capacity in northern Ontario.


Key Points

Rising electricity demand and clean energy upgrades in Sudbury to power EVs, industry, and a smarter, expanded grid.

✅ IESO projects system size may need to more than double

✅ EVs and smart devices increase peak and off-peak load

✅ Battery storage and V2G can support reliability and resiliency


Sudbury, Ont., is consuming more power than ever, amid an electricity supply crunch in Ontario, according to green energy organizations that say meeting the demand will require cleaner energy sources.

"This is the welfare of the entire city on the line and they are putting their trust in electrification," said David St. Georges, manager of communications at reThink Green, a non-profit organization focused on sustainability in Sudbury.

According to St. Georges, Sudbury and northern Ontario can meet the growing demand for electricity to charge clean power for EVs and smart devices. 

According to the Independent Electricity System Operator (IESO), making a full switch from fossil fuels to other renewable energy sources could require more power plants, while other provinces face electricity shortages of their own.

"We have forecasted that Ontario's electricity system will need significant expansion to meet this, potentially more than doubling in size," the IESO told CBC News in an emailed statement.

Electrification in the industrial sector is adding greater demand to the electrical grid as electric cars challenge power grids in many regions. Algoma Steel in Sault Ste. Marie and ArcelorMittal Dofasco in Hamilton both aim to get electric arc furnaces in operation. Together, those projects will require 630 megawatts.

"That's like adding four cities the size of Sudbury to the grid," IESO said.

Devin Arthur, chapter president of the Electric Vehicle society in Greater Sudbury, said the city is coming full circle with fully electrifying its power grid, reflecting how EVs are a hot topic in Alberta and beyond.

"We're going to need more power," he said.

"Once natural gas was introduced, that kind of switched back, and everyone was getting out of electrification and going into natural gas and other sources of power."

Despite Sudbury's increased appetite for electricity, Arthur added it's also easier to store now as Ontario moves to rely on battery storage solutions.

"What that means is you can actually use your electric vehicle as a battery storage device for the grid, so you can actually sell power from your vehicle that you've stored back to the grid, if they need that power," he said.

Harneet Panesar, chief operating officer for the Ontario Energy Board, told CBC the biggest challenge to going green is seeing if it can work around older infrastructure, while policy debates such as Canada's 2035 EV sales mandate shape the pace of change.

"You want to make sure that you're building in the right spot," he said.

"Consumers are shifting from combustion engines to EV drivetrains. You're also creating more dependency. At a very high level, I'm going to say it's probably going to go up in terms of the demand for electricity."

Fossil fuels are the first to go for generating electricity, said St. Georges.

"But we're not there yet, because it's not a light switch solution. It takes time to get to that, which is another issue of electrification," he said.

"It's almost impossible for us not to go that direction."


Related News

View more

Hydro One deal to buy Avista receives U.S. antitrust clearance

Hydro One-Avista Acquisition secures U.S. antitrust clearance under Hart-Scott-Rodino, pending approvals from state utility commissions, the FCC, and CFIUS, with prior FERC approval and shareholder vote supporting the cross-border utility merger.


Key Points

A $6.7B cross-border utility merger cleared under HSR, still awaiting state, FCC, and CFIUS approvals; FERC approved earlier.

✅ HSR waiting period expired; U.S. antitrust clearance obtained

✅ Approvals pending: state commissions, FCC, and CFIUS

✅ FERC and Avista shareholders have approved the transaction


Hydro One Ltd. says it has received antitrust clearance in the United States for its deal to acquire U.S. energy company Avista Corp., even as it sought to redesign customer bills in Ontario.

The Ontario-based utility says the 30-day waiting period under the Hart-Scott-Rodino Antitrust Improvements Act expired Thursday night.

Hydro One announced the friendly deal to acquire Avista last summer, amid customer backlash in some service areas, in an agreement that valued the company at $6.7 billion.

The deal still requires several other approvals, including those from utility commissions in Washington, Idaho, Oregon, Montana and Alaska.

Analysts also warned of political risk for Hydro One during this period, reflecting concerns about provincial influence.

The U.S. Federal Communications Commission must also sign off on the transaction, and although U.S. regulators later rejected the $6.7B takeover following review, clearance is required by the Committee on Foreign Investment in the United States.

The agreement has received approval from the U.S. Federal Energy Regulatory Commission as well as Avista shareholders, and it mirrored other cross-border deals such as Algonquin Power's acquisition of Empire District that closed in the sector.


Related News

View more

Almost 500-mile-long lightning bolt crossed three US states

Longest Lightning Flash Record confirmed by WMO: a 477.2-mile megaflash spanning Mississippi, Louisiana, and Texas, detected by satellite sensors, highlighting Great Plains supercell storms, lightning safety, and extreme weather monitoring advancements.


Key Points

It is the WMO-verified 477.2-mile megaflash across MS, LA, and TX, detected via satellites.

✅ Spanned 477.2 miles across Mississippi, Louisiana, and Texas

✅ Verified by WMO using space-based lightning detection

✅ Occurs in megaflash-prone regions like the U.S. Great Plains


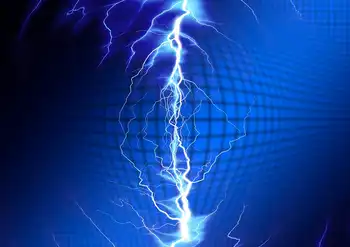
An almost 500-mile long bolt of lightning that lit up the sky across three US states has set a new world record for longest flash, scientists have confirmed.

The lightning bolt, extended a total of 477.2 miles (768 km) and spread across Mississippi, Louisiana, and Texas.

The previous record was 440.6 miles (709 km) and recorded in Brazil in 2018.

Lightning rarely extends over 10 miles and usually lasts under a second, yet utilities plan for severe weather when building long-distance lines such as the TransWest Express transmission project to enhance reliability.

Another lightning flash recorded in 2020 - in Uruguay and Argentina - has also set a new record for duration at 17.1 seconds. The previous record was 16.7 seconds.

"These are extraordinary records from lightning flash events," Professor Randall Cerveny, the WMO's rapporteur of weather and climate extremes, said.

According to the WMO, both records took place in areas prone to intense storms that produce 'megaflashes', namely the Great Plains region of the United States and the La Plata basin of South America's southern cone, where utilities adapting to climate change is an increasing priority.

Professor Cerveny added that greater extremes are likely to exist and are likely to be recorded in the future thanks to advances in space-based lightning detection technology.

The WMO warned that lightning was a hazard and urged people in both regions and around the world to take caution during storms, which can lead to extensive disruptions like the Tennessee power outages reported after severe weather.

"These extremely large and long-duration lightning events were not isolated but happened during active thunderstorms," lightning specialist Ron Holle said in a WMO statement.

"Any time there is thunder heard, it is time to reach a lightning-safe place".

Previously accepted WMO 'lightning extremes' include a 1975 incident in which 21 people were killed by a single flash of a lightning as they huddled inside a tent in Zimbabwe, and modern events show how dangerous weather can also cut electricity for days, as with the Hong Kong typhoon outages that affected families.

In another incident, 469 people were killed when lightning struck the Egyptian town of Dronka in 1994, causing burning oil to flood the town, and major incidents can also disrupt infrastructure, as seen during the LA power outage following a substation fire.

The WMO notes that the only lightning-safe locations are "substantial" buildings with wiring and plumbing, and dedicated lightning protection training helps reinforce these guidelines, rather than structures such as bus stops or those found at beaches.

Fully enclosed metal-topped vehicles are also considered reliably safe, and regional storm safety tips offer additional guidance.


Related News

View more

Wind Power Surges in U.S. Electricity Mix

U.S. Wind Power 2025 drives record capacity additions, with FERC data showing robust renewable energy growth, IRA incentives, onshore and offshore projects, utility-scale generation, grid integration, and manufacturing investment boosting clean electricity across key states.


Key Points

Overview of record wind additions, IRA incentives, and grid expansion defining the U.S. clean electricity mix in 2025.

✅ FERC: 30.1% of new U.S. capacity in Jan 2025 from wind

✅ Major projects: Cedar Springs IV, Boswell, Prosperity, Golden Hills

✅ IRA incentives drive onshore, offshore builds and manufacturing


In early 2025, wind power has significantly strengthened its position in the United States' electricity generation portfolio. According to data from the Federal Energy Regulatory Commission (FERC), wind energy accounted for 30.1% of the new electricity capacity added in January 2025, and as the most-used renewable source in the U.S., it also surpassed the previous record set in 2024. This growth is attributed to substantial projects such as the 390.4 MW Cedar Springs Wind IV and the 330.0 MW Boswell Wind Farm in Wyoming, along with the 300.0 MW Prosperity Wind Farm in Illinois and the 201.0 MW Golden Hills Wind Farm Expansion in Oregon. 

The expansion of wind energy capacity is part of a broader trend where solar and wind together accounted for over 98% of the new electricity generation capacity added in the U.S. in January 2025. This surge is further supported by the federal government's Inflation Reduction Act (IRA) and broader policy support for renewables, which has bolstered incentives for renewable energy projects, leading to increased investments and the establishment of new manufacturing facilities. 

By April 2025, clean electricity sources, including wind and solar, were projected to surpass 51% of total utility-scale electricity generation in the U.S., building on a 25.5% renewable share seen in recent data, marking a significant milestone in the nation's energy transition. This achievement is attributed to a combination of factors: a seasonal drop in electricity demand during the spring shoulder season, increased wind speeds in key areas like Texas, and higher solar production due to longer daylight hours and expanded capacity in states such as California, Arizona, and Nevada, supported by record installations across the solar and storage industry. 

Despite a 7% decline in wind power production in early April compared to the same period in 2024—primarily due to weaker wind speeds in regions like Texas—the overall contribution of wind energy remained robust, supported by an 82% clean-energy pipeline that includes wind, solar, and batteries. This resilience underscores the growing reliability of wind power as a cornerstone of the U.S. electricity mix. 

Looking ahead, the U.S. Department of Energy projects that wind energy capacity will continue to grow, with expectations of adding between 7.3 GW and 9.9 GW in 2024, and potentially increasing to 14.5 GW to 24.8 GW by 2028. This growth is anticipated to be driven by both onshore and offshore wind projects, with onshore wind representing the majority of new additions, continuing a trajectory since surpassing hydro capacity in 2016 in the U.S.

Early 2025 has witnessed a notable increase in wind power's share of the U.S. electricity generation mix. This trend reflects the nation's ongoing commitment to expanding renewable energy sources, especially after renewables surpassed coal in 2022, supported by favorable policies and technological advancements. As the U.S. continues to invest in and develop wind energy infrastructure, the role of wind power in achieving a cleaner and more sustainable energy future becomes increasingly pivotal.


Related News

View more

Sign Up for Electricity Forum’s Newsletter

Stay informed with our FREE Newsletter — get the latest news, breakthrough technologies, and expert insights, delivered straight to your inbox.

Electricity Today T&D Magazine Subscribe for FREE

Stay informed with the latest T&D policies and technologies.
  • Timely insights from industry experts
  • Practical solutions T&D engineers
  • Free access to every issue

Download the 2025 Electrical Training Catalog

Explore 50+ live, expert-led electrical training courses –

  • Interactive
  • Flexible
  • CEU-cerified