Electrical Commissioning In Industrial Power Systems
Our customized live online or in‑person group training can be delivered to your staff at your location.

- Live Online
- 12 hours Instructor-led
- Group Training Available
Regular Price:
$599
Coupon Price:
$499
Wind Power Costs and Tariffs compare onshore and offshore CAPEX, OPEX, LCOE, PPAs, and feed-in incentives, citing 2008 IEA data on €/kW installation, €/MWh generation, and policy drivers like PTC, ITC, and RPS.
Key Information
They cover onshore and offshore CAPEX, OPEX, LCOE ranges, plus revenues via PPAs and feed-in tariffs.
- 2008 onshore CAPEX: 984 to 1,885 €/kW; offshore: 2,100 to 3,230 €/kW
- Italy 30 MW case: 1,800 €/kW; turbines 70.6%, O&M 54 €/kW-year
- LCOE ranges: 26-100 €/MWh by country, site, and financing
- Incentives: feed-in tariffs, PPAs, PTC, ITC, RPS boost revenues
- Offshore O&M and foundations notably higher than onshore
Although many countries do not report cost information, several member countries reported stable or slightly increasing wind turbine costs from 2007 to 2008.
Turbine costs reported by the IEA Wind member countries averaged from a low of 977 (euros) €/kW (U.S.) to a high of 1,800 €/kW (Austria) for 2008. Total installed costs onshore for 2008 in the reporting countries ranged from a low of 984 €/kW (Mexico) to a high of 1,885 €/kW (Switzerland). Total installed costs offshore ranged from 2,100 €/kW (UK) to 3,230 €/kW (Germany).
Some member countries have reported how costs of wind projects are distributed. In Italy, the cost of installed wind turbines is at substantially the same level as it was in 2007. The average installed plant cost of a medium-sized wind farm (30 MW) at a site of medium complexity, with 15 km of paths/roads and 12 km of electric line for connection to the high-voltage grid, is approximately 1,800 €/kW. This cost is generally subdivided as follows:
• Turbines, installation, and commissioning, 1,270 €/kW: 70.6%;
• Development, namely site qualification, design, administrative procedures, and so on, 236 €/kW: 13.1%;
• Interest on loans, 196 €/kW: 10.9%;
• Connection to the grid, 73.8 €/kW: 4.1%;
• Civil engineering work, 23.4 €/kW: 1.3%.
Annual cost of operation and maintenance has been estimated to be about 54 €/kW, which includes leasing of terrain, insurance, and guarantees. Decommissioning cost has been estimated at approximately 5 €/kW. Explanations for higher costs varied by country. Spain reports that the increasing use of large wind turbines (2 MW of nominal power), the increasing prices of raw materials, the shortage of main components, and the excess demand for wind turbines have increased prices for wind generators.
In Portugal, the cost depends on the turbines characteristics and/or the country of manufacture. In the United Kingdom, the higher capital costs of offshore are due to the increase in size of structures and the logistics of installing the turbines at sea. The costs of foundations, construction, installations, and grid connection are significantly higher offshore than onshore. Typically, for example, offshore turbines are 20% more expensive, and towers and foundations can cost more than 2.5 times offshore than onshore for a project of similar size.
Costs for service, consumables, repair, insurance, administration, lease of site, and so on, for new large turbines ranged from 1.3% to 1.5% of capital cost per year. When O&M costs are mentioned by the member countries, they are reported as fairly constant over the years. O&M costs are higher for offshore turbines.
Key to the economic viability of a wind project is the balance of costs and revenue. Wind energy tariffs, feed-in tariffs, and buyback rates are the payments to the wind farm owner for electricity generated. In some countries, this is the market price of electricity. In others, the wind energy tariff includes going green bonuses or other added incentives to encourage wind energy development.
In many countries, the revenue of each wind farm is governed by the contract (power purchase agreement) negotiated with the power purchaser, so the numbers reported by the IEA Wind member countries are estimated averages or ranges. IEA Wind Task 26 Cost of Wind Energy, which will begin work in 2009, will survey the state of the art of calculating the cost of wind energy in preparation for developing recommended practices for such calculations.
Several countries explained how cost of energy might be calculated. In Finland, on coastal sites the cost of wind energy production could be about 50 €/MWh to 80 €/MWh without subsidies (15 years, 7% internal rate of return), while the cost of offshore production could be about 80 €/MWh to 100 €/MWh. The average spot price in the electricity market Nord Pool was 51 €/MWh in 2008 (30 €/MWh in 2007). Emission trade effects on the operating costs of thermal power have resulted in an increase of spot market prices; however, emission permit prices have been volatile and future and forward prices are about 40 €/MWh for 2009–2010. Wind power still needs subsidies to compete, even on the best available sites in Finland.


In Canada, wind generation costs are estimated to be between 44 €/MWh and 70 €/MWh, as wind power in Canada becomes increasingly competitive in regional markets. For example, provincial calls for power in British Columbia, Ontario, and Québec and the Renewable Portfolio Standard (RPS) in Prince Edward Island resulted in electricity prices from wind energy in the range 45 €/MWh to 56 €/MWh.
In most cases, the latest price proposals have shown the highest prices. The primary variables associated with this cost range are the cost of the wind turbines themselves, the quality of wind resources, transmission connection fees, the scale of operation, and the size of turbines.
In Greece, the cost of wind generated electricity could be assumed to be between 26 €/MWh and 47 €/MWh, depending on the site and project cost. The typical interest rate for financing wind energy projects is 7% to 8%. In Norway, estimates of production costs from sites with good wind conditions suggest a production cost of about 66 €/MWh, including capital costs (discount rate 8.0%, 20-year period), operation, and maintenance.
During 2008, the spot market electricity price on the Nord Pool (Nordic electricity market place) increased until autumn 2008 and then dropped noticeably. The forward price by the end of December 2008 was 38 €/MWh. So far, wind energy is not competitive with the price of many new hydropower projects; hydro still is an option for new green power in Norway.
Wind energy tariffs or buyback rates vary by country according to the incentive structure. In Germany, the wind energy tariff includes an initial remuneration of 92 €/MWh for at least 5 years and a maximum of 20 years. After the initial period, the tariff is 50.2 €/MWh for a maximum of 20 years. Offshore turbines put into operation by 31 December 2015 receive an initial remuneration of 150 €/MWh for 12 years. After that period, the basic tariff is 35 €/MWh until the maximum remuneration period (20 years plus year of commissioning) is reached. Wind farms more than 12 nautical miles away from the coast and in waters deeper than 20 m receive a longer initial period.
In Spain, payment for electricity generated by wind farms is based on a feed-in scheme. The owners of wind farms can choose payment for electricity generated by a wind farm independent of the size of the installation and the year of start-up. For 2009, the value is 78.183 €/MWh; the update is based on the Retail Price Index minus an adjustment factor. They can choose instead payment calculated as the market price of electricity plus a premium, plus a supplement, and minus the cost of deviations from energy forecasting.
There is a lower limit to guarantee the economic viability of the installations and an upper limit (floor and cap). For instance, the values for 2009 are reference premium 31.27€/MWh, lower limit 76.098 €/MWh, and upper limit 90.692 €/MWh. In 2008, the market price of electricity in Spain reached 64.43 €/MWh.
In the United States, the sales price of electricity was estimated by weighing projects by nameplate capacity to represent actual market prices. The average electricity sales price for projects built in 2008 was roughly 51.5 USD/MWh (36.98 €/MWh), as wind generation technology matures in North America, up from a low of 30.9 USD/MWh (22.19 €/MWh) for projects built in 2002 to 2003. This price is what the utility pays to the wind plant operator and includes the benefit of the federal production tax credit and state incentives.
In each country, the mix of incentive types and the level of government at which they are applied is unique and changing as regulators signal change across key markets. Widely ranging incentives are operating in the IEA Wind member countries. Those mentioned most often include direct capital investment such as subsidies or grants for projects, providing a premium price for electricity generated by wind (tariffs or production subsidies), obliging utilities to purchase renewable energy, and providing a free market for green electricity.


Tax credit incentives based on investment or electrical generation are also gaining popularity. In the United States, the very effective production tax credit (PTC) and investment tax credits (ITC) for wind energy development were extended through 2012 amid stimulus-driven growth across the wind sector then. The PTC provides an income tax credit based on electricity production from wind projects. The ITC allows 30% of the investment in wind projects to be refunded in the form of reduced income taxes. The ITC may also be taken in the form of an up-front grant equivalent to 30% of the project value. The inflation-adjusted value of the PTC in 2008 was 21(USD)/MWh (15 €/MWh) for wind energy.
In Canada, the ecoENERGY for Renewable Power program provides tax write-offs as a production incentive to all renewable energy technologies. The 14-year program will invest close to 1.5 billion CAD (0.88 billion €) to increase Canada’s supply of clean electricity from renewable sources such as wind, biomass, low-impact hydro, geothermal, PV, and ocean energy. In 2007, the tax write-off was increased from 30% to 50% per year on a declining-balance basis.
Some IEA Wind member countries have national and state governments that require utilities to purchase a percentage of their overall generating capacity from renewable resources. Often called renewable portfolio standards (RPS) or renewables production obligation (RPO), they allow utilities to select the most economical renewable technology. The preferred option by most utilities to satisfy this obligation is wind energy. In the United States, 28 of the 50 states had adopted RPS approaches that collectively called for utilities to procure about 23 billion kWh of renewable energy in 2008. Wind energy qualifies as green electricity used to meet utility RPOs, to trade as certificates, or to meet consumer preferences.
In Australia, a state-based renewable energy target scheme requires electricity retailers and wholesale purchasers in Victoria to acquire Victorian Renewable Energy Certificates. Because wind projects can create these certificates, at least two large wind energy projects were able to move forward. Clear, consistent programs give the industry a firm foundation.
Other kinds of support have also accelerated the development of wind energy in the IEA Wind member countries. For example, publishing wind energy atlases developed with public research money helps developers select productive sites (Austria, Finland, Italy). In Canada, some provincial initiatives require projects to have elements manufactured in the region. This has helped develop a wind industrial base in Canada. To stimulate the industrial base, Portugal has also used domestic manufacturing as a requirement for government-supported project proposals.
Microgeneration (i.e., small wind turbines) is being promoted in several countries, including the UK where small wind remains resilient, with new incentive approaches. An indirect incentive for the deployment of microgeneration is provided in Ireland under the Building Energy Ratings scheme (BER). Irish building regulations require that new dwellings have a portion of their energy demands met by renewable sources on site. The designer has a choice between sourcing this energy through either renewable thermal or renewable electrical means (4 kWh/m2/year electrical or 10 kWh/m2/year thermal). The contribution of a wind turbine can be included in the BER once its performance over a year has been verified.
In the United States, many states also have policies and incentives for small wind electric systems, reflecting growing interest in wind at home among households today. These incentives include rebates and buy-downs, production incentives, tax incentives, and net metering. The subsidy or rebate may be as much as 50% of the cost of a small wind turbine. The rebates become even more effective when combined with low-interest loans and net metering programs. In Ireland, there is growing interest in microgeneration. Interest is expected to increase further now that the largest electricity supplier intends to offer 0.09 €/kWh to its domestic customers for electricity they deliver to the grid.
Related News

Ireland goes 25 days without using coal to generate electricity
Ireland Coal-Free Electricity Record: EirGrid reports 25 days without coal on the all-island grid, as…
View more

Electricity Regulation With Equity & Justice For All
Energy equity in utility regulation prioritizes fair rates, clean energy access, and DERs, addressing fixed…
View more

Reconciliation and a Clean Electricity Standard
Clean Electricity Standard (CES) sets utility emissions targets, uses tradable credits, and advances decarbonization via…
View more
France and Allies Plan Emergency Energy Support Talks for Ukraine
France is planning emergency energy support discussions with G7, Nordic, and Baltic partners to coordinate…
View more

BC Hydro completes major milestone on Site C transmission line work
Site C 500 kV transmission lines strengthen the BC Hydro grid, linking the new substation…
View more
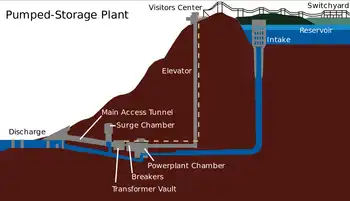
Hydroelectricity Under Pumped Storage Capacity
Pumped Storage Hydroelectricity balances renewable energy, stabilizes the grid, and provides large-scale energy storage using…
View more
Sign Up for Electricity Forum’s Newsletter
Stay informed with our FREE Newsletter — get the latest news, breakthrough technologies, and expert insights, delivered straight to your inbox.
Electricity Today T&D Magazine Subscribe for FREE

Stay informed with the latest T&D policies and technologies.
- Timely insights from industry experts
- Practical solutions T&D engineers
- Free access to every issue

