Officials mull alternative-energy regulations

By McClatchy Tribune News


Substation Relay Protection Training

Our customized live online or in‑person group training can be delivered to your staff at your location.

  • Live Online
  • 12 hours Instructor-led
  • Group Training Available
Regular Price:
$699
Coupon Price:
$599
Reserve Your Seat Today
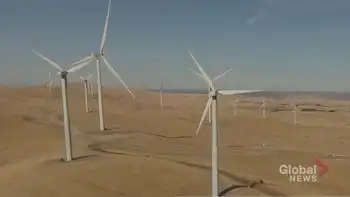
Looking at the hill he owns behind the Homestead Inn at Elton, Percy Helsel sees the potential to power his restaurant.

He's not alone. With interest in alternative energy sources growing, many communities are looking for ways to help residents save money while protecting those living nearby.

Adams and Richland townships are among area communities considering energy regulations. After Helsel asked Adams leaders about putting in a small wind turbine, supervisors told Solicitor Bill Barbin to look into new regulations.

In Richland, supervisors are developing rules for outdoor furnaces. "You have to have some kind of guidelines," said William "B.J." Smith, Adams chairman. "But we wouldn't want to deny anybody the right to run their own home."

Barbin's residential wind-turbine ordinance is based on those enacted by other municipalities.

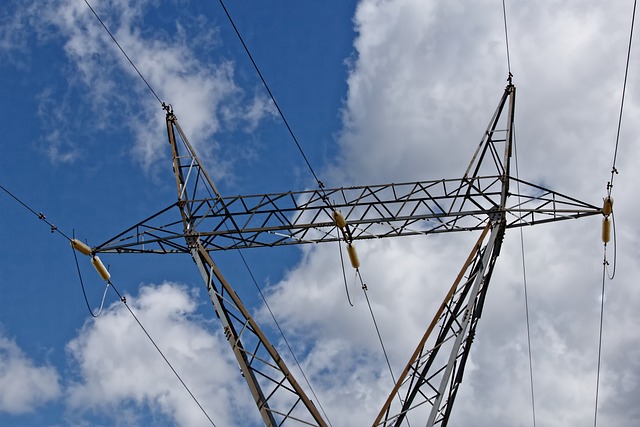
It would require setbacks from the owner's property line to be at least equal to tower's height plus 15 feet. Most residential wind turbines are less than 100 feet tall, according to the American Wind Energy Association.

In Pennsylvania, the push for alternative energy sources is due in part to worries about deregulation.

Under a law passed more than 10 years ago to encourage competition in the electric utility business, the state's electric companies will be able to charge market prices on Jan. 1, 2010. "If they deregulate the electric industry in 2010, people will be in a real bind," Helsel said.

In Richland Township, noise and smoke nuisances were discussed at a recent meeting. Executive Secretary Kim Stayrook is collecting sample ordinances from other townships to deal with both issues.

"We have no control over (outdoor furnaces) at all right now," supervisors' Chairman Melvyn Wingard said. When Wingard asked Solicitor Gary Costlow about a possible noise ordinance, Costlow said uniform enforcement often is a problem.

"I think we owe it to those people who are concerned," Wingard said, calling for a vote authorizing Stayrook to investigate.

Related News

UK EV Drivers Demand Fairer Vehicle Taxes

UK EV Per-Mile Taxes are reshaping road pricing and vehicle taxation for electric cars, raising fairness concerns, climate policy questions, and funding needs for infrastructure and charging networks across the country.


Key Points

They are per-mile road charges on EVs to fund infrastructure, raising fairness, emissions, and vehicle taxation concerns.

✅ Propose tax relief or credits for EV owners

✅ Consider emission-based road user charging

✅ Invest in charging networks and road infrastructure


As the UK continues its push towards a greener future with increased adoption of electric vehicles (EVs) and surging EV interest during supply disruptions, a growing number of electric car drivers are voicing their frustration over the current tax system. The debate centers around the per-mile vehicle taxes that are being proposed and implemented, which many argue are unfairly burdensome on EV owners. This issue has sparked a broader campaign advocating for a more equitable approach to vehicle taxation, one that reflects the evolving landscape of transportation and environmental policy.

Rising Costs for Electric Car Owners

Electric vehicles have been hailed as a crucial component in the UK’s strategy to reduce carbon emissions and combat climate change. Government incentives, such as grants for EV purchases and tax breaks, have been instrumental in encouraging the shift from petrol and diesel cars to cleaner alternatives, even as affordability concerns persist among many UK consumers. However, as the number of electric vehicles on the road grows, the financial dynamics of vehicle taxation are coming under scrutiny.

One of the key issues is the introduction and increase of per-mile vehicle taxes. While these taxes are designed to account for road usage and infrastructure costs, they have been met with resistance from EV drivers who argue that they are being disproportionately affected. Unlike traditional combustion engine vehicles, electric cars typically have lower running costs compared to petrol or diesel models and, in many cases, benefit from lower or zero emissions. Yet, the current tax system does not always reflect these advantages.

The Taxation Debate

The crux of the debate lies in how vehicle taxes are structured and implemented. Per-mile taxes are intended to ensure that all road users contribute fairly to the maintenance of transport infrastructure. However, the implementation of such taxes has raised concerns about fairness and affordability, particularly for those who have invested heavily in electric vehicles.

Critics argue that per-mile taxes do not adequately take into account the environmental benefits of driving an electric car, noting that the net impact depends on the electricity generation mix in each market. While EV owners are contributing to a cleaner environment by reducing emissions, they are also facing higher taxes that could undermine the financial benefits of their greener choice. This has led to calls for a reassessment of the tax system to ensure that it aligns with the UK’s climate goals and provides a fair deal for electric vehicle drivers.

Campaigns for Fairer Taxation

In response to these concerns, several advocacy groups and individual EV owners have launched campaigns calling for a more balanced approach to vehicle taxation. These campaigns emphasize the need for a system that supports the transition to electric vehicles and recognizes their role in reducing environmental impact, drawing on ambitious EV targets abroad as useful benchmarks.

Key proposals from these campaigns include:

  1. Tax Relief for EV Owners: Advocates suggest providing targeted tax relief for electric vehicle owners to offset the costs of per-mile taxes. This could include subsidies or tax credits that acknowledge the environmental benefits of EVs and help to make up for higher road usage fees.

  2. Emission-Based Taxation: An alternative approach is to design vehicle taxes based on emissions rather than mileage. This system would ensure that those driving high-emission vehicles contribute more to road maintenance, while EV owners, who are already reducing emissions, are not penalized.

  3. Infrastructure Investments: Campaigners also call for increased investments in infrastructure that supports electric vehicles, such as charging networks and proper grid management practices that balance load. This would help to address concerns about the adequacy of current road maintenance and support the growing number of EVs on the road.

Government Response and Future Directions

The UK government faces the challenge of balancing revenue needs with environmental goals. While there is recognition of the need to update the tax system in light of increasing EV adoption, there is also a focus on ensuring that any changes are equitable and do not disincentivize the shift towards cleaner vehicles, while considering whether the UK grid can handle additional EV demand reliably.

Discussions are ongoing about how to best implement changes that address the concerns of electric vehicle owners while ensuring that the transportation infrastructure remains adequately funded. The outcome of these discussions will be critical in shaping the future of vehicle taxation in the UK and supporting the country’s broader environmental objectives.

Conclusion

As electric vehicle adoption continues to rise in the UK, the debate over vehicle taxation becomes increasingly important. The campaign for fairer per-mile taxes highlights the need for a tax system that supports the transition to cleaner transportation while also being fair to those who have made environmentally conscious choices. Balancing these factors will be key to achieving the UK’s climate goals and ensuring that all road users contribute equitably to the maintenance of transport infrastructure. The ongoing dialogue and policy adjustments will play a crucial role in shaping a sustainable and just future for transportation in the UK.


Related News

View more

BC Hydro completes major milestone on Site C transmission line work

Site C 500 kV transmission lines strengthen the BC Hydro grid, linking the new substation and Peace Canyon via a 75 kilometre right-of-way to deliver clean energy, with 400 towers built and both circuits energized.


Key Points

High-voltage lines connecting Site C substation to the BC Hydro grid, delivering clean energy via Peace Canyon.

✅ Two 75 km circuits between Site C and Peace Canyon

✅ Connect new 500 kV substation to BC Hydro grid

✅ Over 400 towers built along existing right-of-way


The second and final 500 kilovolt, 75 kilometre transmission line on the Site C project, which has faced stability questions in recent years, has been completed and energized.

With this milestone, the work to connect the new Site C substation to the BC Hydro grid, amid treaty rights litigation that has at times shaped schedules, is complete. Once the Site C project begins generating electricity, much like when the Maritime Link first power flowed between Newfoundland and Nova Scotia, the transmission lines will help deliver clean energy to the rest of the province.

The two 75 kilometre transmission lines run along an existing right-of-way between Site C and the Peace Canyon generating station, a route that has seen community concerns from some northerners. The project’s first 500 kilovolt, 75 kilometre transmission line – along with the Site C substation – were both completed and energized in the fall of 2020.

BC Hydro awarded the Site C transmission line construction contract to Allteck Line Contractors Inc. (now Allteck Limited Partnership) in 2018. Since construction started on this part of the project in summer 2018, crews have built more than 400 towers and strung lines, even as other interties like the Manitoba-Minnesota line have faced scheduling uncertainty, over a total of 150 kilometres.

The two transmission lines are a major component of the Site C project, comparable to initiatives such as the New England Clean Power Link in scale, which also consists of the new 500 kilovolt substation and expanding the existing Peace Canyon 500 kilovolt gas-insulated switchgear to incorporate the two new 500 kilovolt transmission line terminals.

Work to complete three other 500 kilovolt transmission lines that will span one kilometre between the Site C generating station and Site C substation, similar to milestones on the Maritime Link project, is still underway. This work is expected to be complete in 2023.


Related News

View more

BNEF Report: Wind and Solar Will Provide 50% of Electricity in 2050

BNEF 2019 New Energy Outlook projects surging renewable energy demand, aggressive decarbonization, wind and solar cost declines, battery storage growth, coal phase-out, and power market reform to meet Paris Agreement targets through 2050.


Key Points

Bloomberg's NEO 2019 forecasts power demand, renewables growth, and decarbonization pathways through 2050.

✅ Predicts wind/solar to ~50% of global electricity by 2050

✅ Foresees coal decline; Asia transitions slower than Europe

✅ Calls for power market reform and battery integration


In a report that examines the ways in which renewable energy demand is expected to increase, Bloomberg New Energy Finance (BNEF) finds that “aggressive decarbonization” will be required beyond 2030 to meet the temperature goals of the Paris Agreement on climate change.

Focusing on electricity, BNEF’s 2019 New Energy Outlook (NEO) predicts a 62% increase in global power demand, leading to global generating capacity tripling between now and 2050, when wind and solar are expected to make up almost 50% of world electricity, as wind and solar gains indicate, due to decreasing costs.

The report concludes that coal will collapse everywhere except Asia, and, by 2032, there will be more wind and solar electricity than coal-fired electricity. It forecasts that coal’s role in the global power mix will decrease from 37% today, as renewables surpass 30% globally, to 12% by 2050 with the virtual elimination of oil as a power-generating source.

Highlighting regional differences, the report finds that:

Western European economies are already on a strong decarbonization path due to carbon pricing and strong policy support, with offshore wind costs dropping bolstering progress;

by 2040, renewables will comprise 90% of the electricity mix in Europe, with wind and solar accounting for 80%;

the US, with low-priced natural gas, and China, with its coal-fired plants, will transition more slowly even as 30% from wind and solar becomes feasible; and

China’s power sector emissions will peak in 2026 and then fall by more than half over the next 20 years, as solar PV growth accelerates, with wind and solar increasing from 8% to 48% of total electricity generation by 2050.

Power markets must be reformed to ensure wind, solar and batteries are properly remunerated for their contributions to the grid.

The 2019 report finds that wind and solar now represent the cheapest option for adding new power-generating capacity in much of the world, amid record-setting momentum, which is expected to attract USD 13.3 trillion in new investment. While solar, wind, batteries and other renewables are expected to attract USD 10 trillion in investment by 2050, the report warns that curbing emissions will require other technologies as well.

Speaking about the report, Matthias Kimmel, NEO 2019 lead analyst, said solar photovoltaic modules, wind turbines and lithium-ion batteries are set to continue on aggressive cost reduction curves of 28%, 14% and 18%, respectively, for every doubling in global installed capacity. He explained that by 2030, energy generated or stored and dispatched by these technologies will undercut electricity generated by existing coal and gas plants.

To achieve this level of transition and decarbonization, the report stresses, power markets must be reformed to ensure wind, solar and batteries are “properly remunerated for their contributions to the grid.”

Additionally, the 2019 NEO includes a number of updates such as:

  • new scenarios on global warming of 2°C above preindustrial levels, electrified heat and road transport, and an updated coal phase-out scenario;
  • new sections on coal and gas power technology, the future grid, energy access, and costs related to decarbonization technology such as carbon capture and storage (CCS), biogas, hydrogen fuel cells, nuclear and solar thermal;
  • sub-national results for China;
  • the addition of commercial electric vehicles;
  • an expanded air-conditioning analysis; and
  • modeling of Brazil, Mexico, Chile, Turkey and Southeast Asia in greater detail.

Every year, the NEO compares the costs of competing energy technologies, informing projections like US renewables at one-fourth in the near term. The 2019 report brought together 65 market and technology experts from 12 countries to provide their views on how the market might evolve.


Related News

View more

Which of the cleaner states imports dirty electricity?

Hourly Electricity Emissions Tracking maps grid balancing areas, embodied emissions, and imports/exports, revealing carbon intensity shifts across PJM, ERCOT, and California ISO, and clarifying renewable energy versus coal impacts on health and climate.


Key Points

An hourly method tracing generation, flows, and embodied emissions to quantify carbon intensity across US balancing areas.

✅ Hourly traces of imports/exports and generation mix

✅ Consumption-based carbon intensity by balancing area

✅ Policy insights for renewables, coal, health costs


In the United States, electricity generation accounts for nearly 30% of our carbon emissions. Some states have responded to that by setting aggressive renewable energy standards; others are hoping to see coal propped up even as its economics get worse. Complicating matters further is the fact that many regional grids are integrated, and as America goes electric the stakes grow, meaning power generated in one location may be exported and used in a different state entirely.

Tracking these electricity exports is critical for understanding how to lower our national carbon emissions. In addition, power from a dirty source like coal has health and environment impacts where it's produced, and the costs of these aren't always paid by the parties using the electricity. Unfortunately, getting reliable figures on how electricity is produced and where it's used is challenging, even for consumers trying to find where their electricity comes from in the first place, leaving some of the best estimates with a time resolution of only a month.

Now, three Stanford researchers—Jacques A. de Chalendar, John Taggart, and Sally M. Benson—have greatly improved on that standard, and they have managed to track power generation and use on an hourly basis. The researchers found that, of the 66 grid balancing areas within the United States, only three have carbon emissions equivalent to our national average, and they have found that imports and exports of electricity have both seasonal and daily changes. de Chalendar et al. discovered that the net results can be substantial, with imported electricity increasing California's emissions/power by 20%.

Hour by hour
To figure out the US energy trading landscape, the researchers obtained 2016 data for grid features called balancing areas. The continental US has 66 of these, providing much better spatial resolution on the data than the larger grid subdivisions. This doesn't cover everything—several balancing areas in Canada and Mexico are tied in to the US grid—and some of these balancing areas are much larger than others. The PJM grid, serving Pennsylvania, New Jersey, and Maryland, for example, is more than twice as large as Texas' ERCOT, in a state that produces and consumes the most electricity in the US.

Despite these limitations, it's possible to get hourly figures on how much electricity was generated, what was used to produce it, and whether it was used locally or exported to another balancing area. Information on the generating sources allowed the researchers to attach an emissions figure to each unit of electricity produced. Coal, for example, produces double the emissions of natural gas, which in turn produces more than an order of magnitude more carbon dioxide than the manufacturing of solar, wind, or hydro facilities. These figures were turned into what the authors call "embodied emissions" that can be traced to where they're eventually used.

Similar figures were also generated for sulfur dioxide and nitrogen oxides. Released by the burning of fossil fuels, these can both influence the global climate and produce local health problems.

Huge variation
The results were striking. "The consumption-based carbon intensity of electricity varies by almost an order of magnitude across the different regions in the US electricity system," the authors conclude. The low is the Bonneville Power grid region, which is largely supplied by hydropower; it has typical emissions below 100kg of carbon dioxide per megawatt-hour. The highest emissions come in the Ohio Valley Electric region, where emissions clear 900kg/MW-hr. Only three regional grids match the overall grid emissions intensity, although that includes the very large PJM (where capacity auction payouts recently fell), ERCOT, and Southern Co balancing areas.

Most of the low-emissions power that's exported comes from the Pacific Northwest's abundant hydropower, while the Rocky Mountains area exports electricity with the highest associated emissions. That leads to some striking asymmetries. Local generation in the hydro-rich Idaho Power Company has embodied emissions of only 71kg/MW-hr, while its imports, coming primarily from Rocky Mountain states, have a carbon content of 625kg/MW-hr.

The reliance on hydropower also makes the asymmetry seasonal. Local generation is highest in the spring as snow melts, but imports become a larger source outside this time of year. As solar and wind can also have pronounced seasonal shifts, similar changes will likely be seen as these become larger contributors to many of these regional grids. Similar things occur daily, as both demand and solar production (and, to a lesser extent, wind) have distinct daily profiles.

The Golden State
California's CISO provides another instructive case. Imports represent less than 30% of its total electric use in 2016, yet California electricity imports provided 40% of its embodied emissions. Some of these, however, come internally from California, provided by the Los Angeles Department of Water and Power. The state itself, however, has only had limited tracking of imported emissions, lumping many of its sources as "other," and has been exporting its energy policies to Western states in ways that shape regional markets.

Overall, the 2016 inventory provides a narrow picture of the US grid, as plenty of trends are rapidly changing our country's emissions profile, including the rise of renewables and the widespread adoption of efficiency measures and other utility trends in 2017 that continue to evolve. The method developed here can, however, allow for annual updates, providing us with a much better picture of trends. That could be quite valuable to track things like how the rapid rise in solar power is altering the daily production of clean power.

More significantly, it provides a basis for more informed policymaking. States that wish to promote low-emissions power can use the information here to either alter the source of their imports or to encourage the sites where they're produced to adopt more renewable power. And those states that are exporting electricity produced primarily through fossil fuels could ensure that the locations where the power is used pay a price that includes the health costs of its production.


Related News

View more

Germany's Energy Crisis Deepens as Local Utilities Cry for Help

Germany energy liquidity crisis is straining municipal utilities as gas and power prices surge, margin calls rise, and Russian supply cuts bite, forcing state support, interventions, and emergency financing to stabilize households and businesses.


Key Points

A cash squeeze on German municipal utilities as soaring gas and power prices trigger margin calls and funding gaps.

✅ Margin calls and spot-market purchases strain cash flow

✅ State liquidity lines and EU collateral support proposed

✅ Gazprom cuts, Uniper distress heighten default risks


Germany’s fears that soaring power prices and gas prices could trigger a deeper crisis is starting to get real. 

Several hundred local utilities are coming under strain and need support, according to the head of Germany’s largest energy lobby group. The companies, generally owned by municipalities, supply households and small businesses directly and are a key part of the country’s power and gas network.

“The next step from the government and federal states must be to secure liquidity for these municipal companies,” Kerstin Andreae, chairwoman of the German Association of Energy and Water Industries, told Bloomberg in Berlin. “Prices are rising, and they have no more money to pay the suppliers. This is a big problem.”

Germany’s energy crunch intensified over the weekend after Russia’s Gazprom PJSC halted its key gas pipeline indefinitely, a stark wake-up call for policymakers to reduce fossil fuel dependence. European energy prices have surged again amid concerns over shortages this winter and fears of a worst-case energy scenario across the bloc. 

Many utilities are running into financial issues as they’re forced to cover missing Russian deliveries with expensive supplies on the spot market. German energy giant Uniper SE, which supplies local utilities, warned it will likely burn through a 7 billion-euro ($7 billion) government safety net and will need more help already this month.

Some German local utilities have already sought help, according to a government official, who asked not to be identified in line with briefing rules.  

With Europe’s largest economy already bracing for recession, Chancellor Olaf Scholz’s administration is battling on several fronts, testing the government’s financial capacity. The ruling coalition agreed Sunday on a relief plan worth about 65 billion euros -- part of an emerging energy shield package to contain the fallout of surging costs for households and businesses. 

Starting in October, local utilities will have to pay a levy for the gas acquired, which will further increase their financial burden, Andreae said.

Margin Calls
European gas prices are more than four times higher than usual for this time of year, underscoring why rolling back electricity prices is tougher than it appears for policymakers, as Russia cuts supplies in retaliation for sanctions related to its invasion of Ukraine. When prices peak, energy companies have to pay margin calls, extra collateral required to back their trades.

Read more: Energy Trade Risks Collapsing Over Margin Calls of $1.5 Trillion

The problem has hit local utilities in other countries as well. In Austria, the government approved a 2 billion-euro loan for Vienna’s municipal utility last month. 

The European Union is also planning help, floating gas price cap strategies among other tools. The bloc’s emergency measures will include support for electricity producers struggling to find enough cash to guarantee trades, according to European Commission President Ursula von der Leyen.

The situation has worsened in Germany as some of the country’s big gas importers are reluctant to sell more supplies to some of municipal companies amid fears they could default on payments, Andreae said. 


Related News

View more

Survivors of deadly tornadoes may go weeks without heat, water, electricity, Kentucky officials say

Kentucky Tornado Recovery details Mayfield damage, death toll, power outages, boil-water advisories, shelter operations, and emergency response across five states, as crews restore infrastructure, locate missing persons, and support displaced families in frigid temperatures.


Key Points

Overview of restoring utilities, repairing infrastructure, and sheltering survivors after Kentucky's tornado disaster.

✅ Power, water, and gas outages persist; boil-water advisories in effect.

✅ Mayfield hardest hit; factory casualties lower than first feared.

✅ Shelter provided in state park lodges; long-term recovery expected.


Residents of Kentucky counties where tornadoes killed several dozen people could be without heat, water or electricity in frigid temperatures for weeks or longer, state officials warned Monday, and experiences abroad like Kyiv's difficult winter underscore the risks as the toll of damage and deaths came into clearer focus in five states slammed by the swarm of twisters.

Authorities are still tallying the devastation from Friday's storms, though they believe the death toll will be lower than initially feared since it appeared many more people escaped a candle factory in Mayfield, Ky., than first thought.

At least 88 people — including 74 in Kentucky — were killed by the tornados which also destroyed a nursing home in Arkansas, heavily damaged an Amazon distribution centre in Illinois and spread their deadly effects into Tennessee and Missouri, while ongoing nuclear worker safety concerns highlighted vulnerabilities across critical facilities. Another 105 people were still unaccounted for in Kentucky as of Monday afternoon, Gov. Andy Beshear said.

As searches continued for those still missing, efforts also turned to repairing the power grid, downed line safety education, sheltering those whose homes were destroyed and delivering drinking water and other supplies.

"We're not going to let any of our families go homeless," Beshear said in announcing that lodges in state parks were being used to provide shelter.

In Bowling Green, Ky., 11 people died on the same street, including two infants found among the bodies of five relatives near a residence, Warren County coroner Kevin Kirby said. 

In Mayfield, one of the hardest hit towns, those who survived faced a high around 10 C and a low below freezing Monday without any utilities, and awareness of power strip fire risks is critical as residents turn to makeshift heating and power.

"Our infrastructure is so damaged. We have no running water. Our water tower was lost. Our waste water management was lost, and there's no natural gas to the city. So we have nothing to rely on there," Mayfield Mayor Kathy Stewart O'Nan said on CBS Mornings. "So that is purely survival at this point for so many of our people."

Across the state, about 26,000 homes and businesses were without electricity, according to poweroutage.us, including nearly all of those in Mayfield, and the U.S. grid warning during the pandemic underscored vulnerabilities in critical infrastructure.

More than 10,000 homes and businesses have no water, and another 17,000 are under boil-water advisories, Kentucky Emergency Management Director Michael Dossett told reporters.

Dossett warned that full recovery in the hardest-hit places could take not just months, but years, noting that utilities have at times contemplated on-site staffing to maintain operations during crises.

At least 74 people have been confirmed dead across Kentucky after tornadoes tore through the state, leaving some communities nearly totally destroyed and many residents wondering if they can afford to rebuild. 2:22
"This will go on for years to come," he said. 

Amid broader economic strain, recent debates over Kentucky miners' pay highlight ongoing financial vulnerabilities for workers affected by disasters as well.

Authorities are still trying to determine the total number of dead, and the storms made door-to-door searches impossible in some places. "There are no doors," said Beshear.

"We're going to have over 1,000 homes that are gone, just gone," he said.

Beshear had said Sunday morning that the state's toll could exceed 100. But he later said it might be as low as 50.

'Then he was gone'
Initially as many as 70 people were feared dead in the candle factory in Mayfield, but the company said Sunday that eight were confirmed dead and eight remained missing, while more than 90 others had been located.

"Many of the employees were gathered in the tornado shelter and after the storm was over they left the plant and went to their homes," said Bob Ferguson, a spokesman for the company. "With the power out and no landline they were hard to reach initially. We're hoping to find more of those eight unaccounted as we try their home residences."


Related News

View more

Sign Up for Electricity Forum’s Newsletter

Stay informed with our FREE Newsletter — get the latest news, breakthrough technologies, and expert insights, delivered straight to your inbox.

Electricity Today T&D Magazine Subscribe for FREE

Stay informed with the latest T&D policies and technologies.
  • Timely insights from industry experts
  • Practical solutions T&D engineers
  • Free access to every issue

Live Online & In-person Group Training

Advantages To Instructor-Led Training – Instructor-Led Course, Customized Training, Multiple Locations, Economical, CEU Credits, Course Discounts.

Request For Quotation

Whether you would prefer Live Online or In-Person instruction, our electrical training courses can be tailored to meet your company's specific requirements and delivered to your employees in one location or at various locations.