CSA Z463 Electrical Maintenance -
Our customized live online or in‑person group training can be delivered to your staff at your location.

- Live Online
- 6 hours Instructor-led
- Group Training Available
Regular Price:
$249
Coupon Price:
$199
Premiers Jean Charest and Dalton McGuinty emerged from an historic Quebec-Ontario joint cabinet meeting in Quebec City to announce a regional climate agreement, and other projects for joint co-operation.
As Jack Layton was quick to point out, the two governments moved to fill the leadership vacuum created when the Harper government decided to break Canada's international commitments on environmental protection, and adopt a "go slow" approach to global warming.
Notably, Ontario and Quebec adopted the "cap-and-trade" approach to reducing green house gas emissions, which has long been promoted by the federal NDP leader. The Quebec-Ontario decision to move ahead on cap-and-trade was taken as the U.S. Senate began its first debate on how that country should move to adopt this mechanism, which is already in place in Europe.
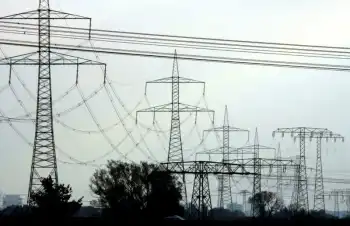
Central Canada has formed a new political alliance. On the surface the reasons are straightforward. Quebec and Ontario face similar problems and can work together on solutions. Ontario wants to withdraw its coal fired electricity facilities from production because they produce high levels of green house gases. At the joint press conference Quebec announced it wants Ontario to have access to its clean hydro-electricity, and the two governments agreed to move to establish the necessary power grid. Charest talked about selling to the neighbours as being good politics.
Federal government Environment Minister, John Baird, immediately denounced the Charest-McGuinty joint cabinet meeting, and its follow-up joint press conference as a photo-op. The good neighbour approach upsets the federal Conservative government, which has been following a divide and conquer political strategy in its pursuit of a majority government.
The Conservatives have chosen to attack the McGuinty Liberal government in the hopes the electorate will blame the provincial government for bad economic times in Ontario, while courting the Charest Liberals who have been following the neo-conservative market friendly policies favoured by the Harper government.
However McGuinty, despite constant attacks by the former provincial Conservatives, like Baird who sit on the Harper front bench, was able to win re-election, and is growing in political strength. Charest and his Liberal party, with a minority government, has been forced to abandon its ideological approach, and is experiencing a surprising popularity as a result. Meanwhile Charest's still very neo-conservative cousin, and rival for Harper's attention, Mario Dumont and his Action démocratique du Québec, is rapidly losing support.
Charest wants to beat the Parti Québécois, and judges that being able to play the good neighbour card with Ontario takes him where the sovereignists cannot go. For McGuinty, an alliance with Quebec on climate change puts Harper on the defensive on an issue where he is most out of step with Canadians.
The Canadian manufacturing heartland of Ontario and Quebec is in the throes of a serious economic slump: factories are being shut, and workers laid off. Even if it costs real money, both provincial governments recognize something must be done to address global warming. Both Charest and McGuinty recognize the need for an industrial strategy, and financial commitments from Ottawa, even if the Harper government refuses to go beyond tax cuts.
Confidence expressed by the federal Conservatives in the free trade agreement with the U.S. (which is 20 years old) as securing Canada's future sounds increasingly false as the slumping U.S. dollar creates economic reverses in Canada. Passport requirements for U.S. nationals returning from Canada, imposed by the Bush administration drastically slow down cross-border tourism, an important source of revenue for small business and the large central Canadian hospitality industry.
While the federal finance minister denies Canada faces a recession, it is rising prices for oil, gas and agricultural products that is driving Canadian growth. In the meantime, Ontario and Quebec have two-thirds of the Canadian population, no oil or gas production, and in northern regions industry is hurt badly because of falling prices for forestry products.
The divide and conquer strategy was used successfully by Brian Mulroney in the 1988 free trade election campaign. He attacked Ontario's Liberal government for wanting to deny the other provinces the prosperity the Auto Pact had brought to it. By aligning himself with Quebec, and reaching out to other jurisdictions ready to act on climate change, the McGuinty government has mounted a strong defence to the Harper version of divide and conquer, which is predicated on isolating Ontario, particularly urban Ontario.
While it is true the oil and gas producing provinces benefit from the very price hikes that are hurting Ontario and Quebec, it is false to assume that one group of Canadians gains precisely what the other loses. On global warming Harper has asked why Canada should move faster than other countries. Charest and McGuinty have responded. This is an issue that affects everyone, oil producer or not, and other Canadian governments need to take leadership, when the federal government is not willing to act.
Related News
Power Outages to Mitigate Wildfire Risks
Colorado Wildfire Power Shutoffs reduce ignition risk through PSPS, grid safety protocols, data-driven forecasts, and…
View more

New Orleans Levees Withstood Hurricane Ida as Electricity Failed
Hurricane Ida New Orleans Infrastructure faced a split outcome: levees and pumps protected against storm…
View more
Alberta gives $40M to help workers transition from coal power jobs
Alberta Coal Transition Support offers EI top-ups, 75% wage replacement, retraining, tuition vouchers, and on-site…
View more
Wind Denmark - Danish electricity generation sets a new green record
Denmark 2019 electricity CO2 intensity shows record-low emissions as renewable energy surges, wind power dominates,…
View more
IEA warns fall in global energy investment may lead to shortages
Global Energy Investment Decline risks future oil and electricity supply, says the IEA, as spending…
View more
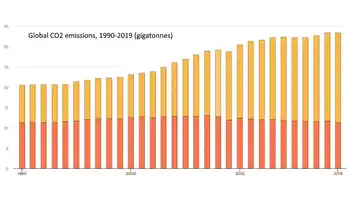
Global CO2 emissions 'flatlined' in 2019, says IEA
2019 Global CO2 Emissions stayed flat, IEA reports, as renewable energy growth, wind and solar…
View more
Sign Up for Electricity Forum’s Newsletter
Stay informed with our FREE Newsletter — get the latest news, breakthrough technologies, and expert insights, delivered straight to your inbox.
Electricity Today T&D Magazine Subscribe for FREE

Stay informed with the latest T&D policies and technologies.
- Timely insights from industry experts
- Practical solutions T&D engineers
- Free access to every issue

