Why the Texas grid causes the High Plains to turn off its wind turbines


wind power

CSA Z463 Electrical Maintenance

Our customized live online or in‑person group training can be delivered to your staff at your location.

  • Live Online
  • 6 hours Instructor-led
  • Group Training Available
Regular Price:
$249
Coupon Price:
$199
Reserve Your Seat Today

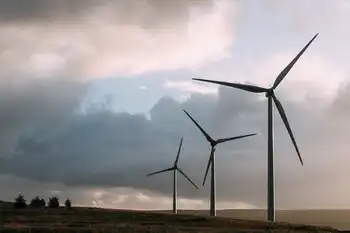
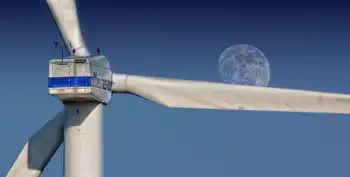
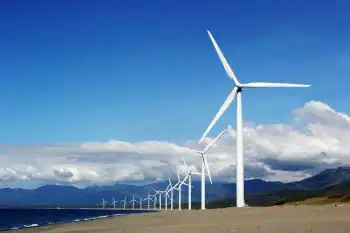
Texas High Plains Wind Energy faces ERCOT transmission congestion, limiting turbines in the Panhandle from stabilizing the grid as gas prices surge, while battery storage and solar could enhance reliability and lower power bills statewide.


Key Points

A major Panhandle wind resource constrained by ERCOT transmission, impacting grid reliability and electricity rates.

✅ Over 11,000 turbines can power 9M homes in peak conditions

✅ Transmission congestion prevents flow to major load centers

✅ Storage and solar can bolster reliability and reduce bills


Texas’s High Plains region, which covers 41 counties in the Texas Panhandle and West Texas, is home to more than 11,000 wind turbines — the most in any area of the state.

The region could generate enough wind energy to power at least 9 million homes. Experts say the additional energy could help provide much-needed stability to the electric grid during high energy-demand summers like this one, and even lower the power bills of Texans in other parts of the state.

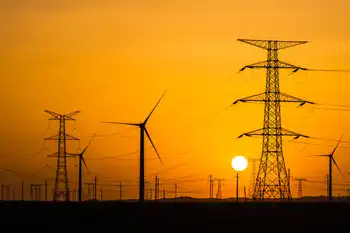
But a significant portion of the electricity produced in the High Plains stays there for a simple reason: It can’t be moved elsewhere. Despite the growing development of wind energy production in Texas, the state’s transmission network, reflecting broader grid integration challenges across the U.S., would need significant infrastructure upgrades to ship out the energy produced in the region.

“We’re at a moment when wind is at its peak production profile, but we see a lot of wind energy being curtailed or congested and not able to flow through to some of the higher-population areas,” said John Hensley, vice president for research and analytics at the American Clean Power Association. “Which is a loss for ratepayers and a loss for those energy consumers that now have to either face conserving energy or paying more for the energy they do use because they don’t have access to that lower-cost wind resource.”

And when the rest of the state is asked to conserve energy to help stabilize the grid, the High Plains has to turn off turbines to limit wind production it doesn’t need.

“Because there’s not enough transmission to move it where it’s needed, ERCOT has to throttle back the [wind] generators,” energy lawyer Michael Jewell said. “They actually tell the wind generators to stop generating electricity. It gets to the point where [wind farm operators] literally have to disengage the generators entirely and stop them from doing anything.”

Texans have already had a few energy scares this year amid scorching temperatures and high energy demand to keep homes cool. The Electric Reliability Council of Texas, which operates the state’s electrical grid, warned about drops in energy production twice last month and asked people across the state to lower their consumption to avoid an electricity emergency.

The energy supply issues have hit Texans’ wallets as well. Nearly half of Texas’ electricity is generated at power plants that run on the state’s most dominant energy source, natural gas, and its price has increased more than 200% since late February, causing elevated home utility bills.

Meanwhile, wind farms across the state account for nearly 21% of the state’s power generation. Combined with wind production near the Gulf of Mexico, Texas produced more than one-fourth of the nation’s wind-powered electric generation last year.

Wind energy is one of the lowest-priced energy sources because it is sold at fixed prices, turbines do not need fuel to run and the federal government provides subsidies. Texans who get their energy from wind farms in the High Plains region usually pay less for electricity than people in other areas of the state. But with the price of natural gas increasing from inflation, Jewell said areas where wind energy is not accessible have to depend on electricity that costs more.

“Other generation resources are more expensive than what [customers] would have gotten from the wind generators if they could move it,” Jewell said. “That is the definition of transmission congestion. Because you can’t move the cheaper electricity through the grid.”

A 2021 ERCOT report shows there have been increases in stability constraints for wind energy in recent years in both West and South Texas that have limited the long-distance transfer of power.

“The transmission constraints are such that energy can’t make it to the load centers. [High Plains wind power] might be able to make it to Lubbock, but it may not be able to make it to Dallas, Fort Worth, Houston or Austin,” Jewell said. “This is not an insignificant problem — it is costing Texans a lot of money.”

Some wind farms in the High Plains foresaw there would be a need for transmission. The Trent Wind Farm was one of the first in the region. Beginning operations in 2001, the wind farm is between Abilene and Sweetwater in West Texas and has about 100 wind turbines, which can supply power to 35,000 homes. Energy company American Electric Power built the site near a power transmission network and built a short transmission line, so the power generated there does go into the ERCOT system.

But Jewell said high energy demand and costs this summer show there’s a need to build additional transmission lines to move more wind energy produced in the High Plains to other areas of the state.

Jewell said the Public Utility Commission, which oversees the grid, is conducting tests to determine the economic benefits of adding transmission lines from the High Plains to the more than 52,000 miles of lines that already connect to the grid across the state. As of now, however, there is no official proposal to build new lines.

“It does take a lot of time to figure it out — you’re talking about a transmission line that’s going to be in service for 40 or 50 years, and it’s going to cost hundreds of millions of dollars,” Jewell said. “You want to be sure that the savings outweigh the costs, so it is a longer process. But we need more transmission in order to be able to move more energy. This state is growing by leaps and bounds.”

A report by the American Society of Civil Engineers released after the February 2021 winter storm stated that Texas has substantial and growing reliability and resilience problems with its electric system.

The report concluded that “the failures that caused overwhelming human and economic suffering during February will increase in frequency and duration due to legacy market design shortcomings, growing infrastructure interdependence, economic and population growth drivers, and aging equipment even if the frequency and severity of weather events remains unchanged.”

The report also stated that while transmission upgrades across the state have generally been made in a timely manner, it’s been challenging to add infrastructure where there has been rapid growth, like in the High Plains.

Despite some Texas lawmakers’ vocal opposition against wind and other forms of renewable energy, and policy shifts like a potential solar ITC extension can influence the wind market, the state has prime real estate for harnessing wind power because of its open plains, and farmers can put turbines on their land for financial relief.

This has led to a boom in wind farms, even with transmission issues, and nationwide renewable electricity surpassed coal in 2022 as deployment accelerated. Since 2010, wind energy generation in Texas has increased by 15%. This month, the Biden administration announced the Gulf of Mexico’s first offshore wind farms will be developed off the coasts of Texas and Louisiana and will produce enough energy to power around 3 million homes.

“Texas really does sort of stand head and shoulders above all other states when it comes to the actual amount of wind, solar and battery storage projects that are on the system,” Hensley said.

One of the issues often brought up with wind and solar farms is that they may not be able to produce as much energy as the state needs all of the time, though scientists are pursuing improvements to solar and wind to address variability. Earlier this month, when ERCOT asked consumers to conserve electricity, the agency listed low wind generation and cloud coverage in West Texas as factors contributing to a tight energy supply.

Hensley said this is where battery storage stations can help. According to the U.S. Energy Information Administration, utility-scale batteries tripled in capacity in 2021 and can now store up to 4.6 gigawatts of energy. Texas has been quickly developing storage projects, spurred by cheaper solar batteries, and in 2011, Texas had only 5 megawatts of battery storage capacity; by 2020, that had ballooned to 323.1 megawatts.

“Storage is the real game-changer because it can really help to mediate and control a lot of the intermittency issues that a lot of folks worry about when they think about wind and solar technology,” Hensley said. “So being able to capture a lot of that solar that comes right around noon to [1 p.m.] and move it to those evening periods when demand is at its highest, or even move strong wind resources from overnight to the early morning or afternoon hours.”

Storage technology can help, but Hensley said transmission is still the big factor to consider.

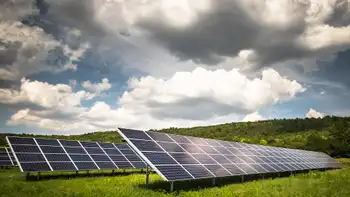
Solar is another resource that could help stabilize the grid. According to the Solar Energy Industries Association, Texas has about 13,947 megawatts of solar installed and more than 161,000 installations. That’s enough to power more than 1.6 million homes.

This month, the PUC formed a task force to develop a pilot program next year that would create a pathway for solar panels and batteries on small-scale systems, like homes and businesses, to add that energy to the grid, similar to a recent virtual power plant in Texas rollout. The program would make solar and batteries more accessible and affordable for customers, and it would pay customers to share their stored energy to the grid as well.

Hensley said Texas has the most clean-energy projects in the works that will likely continue to put the region above the rest when it comes to wind generation.

“So they’re already ahead, and it looks like they’re going to be even farther ahead six months or a year down the road,” he said.

Related News

GM Canada announces tentative deal for $1 billion electric vehicle plant in Ontario

GM Canada-Unifor EV Deal outlines a $1B plan to transform the CAMI plant in Ingersoll, Ontario, building BrightDrop EV600 delivery vans, boosting EV manufacturing, creating jobs, and securing future production with government-backed investment.


Key Points

A tentative $1B deal to retool CAMI for BrightDrop EV600 production, creating jobs and securing Canada's EV manufacturing.

✅ $1B to transform CAMI, Ingersoll, for BrightDrop EV600 vans

✅ Ratification vote set; Unifor Local 88 to review details

✅ Supports EV manufacturing, delivery logistics, and new jobs


GM Canada says it has reached a tentative deal with Unifor that if ratified will see it invest $1 billion to transform its CAMI plant in Ingersoll, Ont., to make commercial electric vehicles, aligning with GM's EV hiring plans across North America.

Unifor National President Jerry Dias says along with the significant investment the agreement will mean new products, new jobs amid Ontario's EV jobs boom and job security for workers.

Dias says in a statement that more details of the tentative deal will be presented to Unifor Local 88 members at an online ratification meeting scheduled for Sunday.

He says the results of the ratification vote are scheduled to be released on Monday.

Details of the agreement were not released Friday night.

A GM spokeswoman says in a statement that the plan is to build BrightDrop EV 600s -- an all-new GM business announced this week at the Consumer Electronics Show and part of EV assembly deals that put Canada in the race -- that will offer a cleaner way for delivery and logistics companies to move goods more efficiently.

Unifor said the contract, if ratified, will bring total investment negotiated by the union to nearly $6 billion after new agreements were ratified with General Motors, Ford, including Ford EV production plans, and Fiat Chrysler in 2020 that included support from the federal and Ontario governments, and parallel investments such as a Niagara Region battery plant bolstering the supply chain.

It said the Ford deal reached in September included $1.95 billion to bring battery electric vehicle production to Oakville via the Oakville EV deal and a new engine derivative to Windsor and the Fiat Chrysler agreement included more than $1.5 billion to build plug-in hybrid vehicles and battery electric vehicles.

Unifor said in November, General Motors agreed to a $1.3 billion dollar investment to bring 1,700 jobs to Oshawa, as Honda's Ontario battery investment signals wider sector momentum, plus more than $109 million to in-source new transmission work for the Corvette and support continued V8 engine production in St. Catharines.


Related News

View more

What the U.S. can learn from the U.K. about wind power

U.S. Offshore Wind Power Strategy leverages UK offshore wind lessons, contract auctions, and supply chains to scale renewable energy, build wind farms, cut emissions, create jobs, and modernize the grid to meet 2030 climate goals.


Key Points

U.S. plan to scale offshore wind via UK-style contracts, turbines, and supply chains to meet 2030 clean energy goals

✅ Contract-for-difference price guarantees de-risk projects

✅ Scale turbines and ports to cut LCOE and boost capacity

✅ Build coastal grids, transmission, and workforce by 2030


As President Joe Biden’s administration puts its muscle behind wind power with plans to develop large-scale wind farms along the entire United States coastline, the administration can look at how the windiest nation in Europe is transforming its energy grid for an example of how to proceed.

In the search for renewable sources of energy, the United Kingdom has embraced wind power. In 2020, the country generated as much as 24 percent of its electricity from wind power across the grid — enough to supply 18.5 million homes, according to government statistics. 

With usually reliable winds, the U.K. currently has the highest number of offshore turbines installed in the world, with China at a close second.

Experts and industry leaders say it offers valuable lessons on creating a viable market for wind power at the ambitious scale the Biden administration hopes to meet in order to confront climate change and help transition the U.S. economy to renewable energy.

“The U.S. is going to benefit hugely from the early investment that European governments have put into offshore wind,” said Oliver Metcalfe, a wind power analyst at BloombergNEF in London, an independent research group.

Big American plans
On Oct. 13, the White House announced ambitious offshore wind plans to lease federal waters off of the East and West Coasts and Gulf of Mexico to develop commercial wind farms.

The move is part of Biden’s goal to have 30,000 megawatts of offshore wind power produced in the United States by 2030, with projects such as New York's record-setting approval highlighting the momentum. The White House says that would generate enough electricity to power more than 10 million homes and in the process create 77,000 jobs. 

But there is a chasm between where the U.S. is now and where it wants to be within the next decade when it comes to offshore wind power.

“We’re the first generation to understand the science and implications of climate change and we’re the last generation to be able to do something about it.”

The U.S. is not new to wind power; onshore wind in states such as Texas, Oklahoma and Iowa supplied 8.2 percent of the country’s total electricity generation in 2020, according to the U.S. Department of Energy. 

But despite its long coastlines, offshore wind has been a largely untapped resource in the U.S. With a population of about 332 million people, the U.S. currently has just two operational offshore wind farms — off Rhode Island and Virginia — with the capacity to produce 42 megawatts of electricity between them, far from the 1 gigawatt on-grid milestone many are watching. 

In contrast, the U.K., with a population of 67 million people, has 2,297 offshore wind turbines with the capacity to produce 10,415 megawatts of electricity.

Power station or a park?
Just outside of central Glasgow, the host city for the U.N. climate change conference known as COP26, the fruits of years of effort to move away from fossil fuels can be seen and heard

International financiers, including the World Bank are helping developing countries scale wind projects to meet climate goals.

Whitelee Windfarm, the U.K.’s largest onshore wind farm, spreads across 30 square miles on the Eaglesham Moor and includes more than 80 miles of trails for walking, cycling and horseback riding.

With its 539 megawatt capacity, it generates enough electricity for 350,000 homes — more than half the population of Glasgow. 

On a recent gusty fall day, Ian and Fiona Gardner, both 71, were walking their dogs among the wind farm’s 360-foot-tall turbines  

“This is a major contribution to Scotland, to become independent from oil by 2035,” Ian Gardner, an accountant, said. 

Thanks to the rapid technological advances in turbine technology, this wind farm that was completed in 2009, is now practically old school. The latest crop of onshore turbines typically generate double the current capacity of Whitelee’s turbines.

“It took us 20 years to build 2 gigawatts of power. And we’re going to double that in five  years,” said McQuade, an economist. “We can do that because machines are big, efficient, cheap and the supply chain is there.” 

The biggest operational offshore wind farm in the world right now, Hornsea Project One, is about 75 miles off England’s Yorkshire coast in the North Sea.

Owned and operated by Orsted, a former Danish oil and gas giant, in partnership with Global Infrastructure Partners, its 174 turbines have the capacity to generate 1.2 gigawatts — enough to power over 1 million homes and roughly equivalent to a nuclear power plant. 

Benj Sykes, Vice President of U.K. Offshore Wind at Orsted, called Hornsea One a “game changer” in a recent phone interview, citing it as an example of how the industry has scaled up its output to compete with traditional power plants.

But massive projects like Hornsea One took decades to get up and running, as well as government help. According to Malte Jansen, a research associate at the Centre of Environmental Policy at Imperial College London, the British government helped facilitate a “paradigm shift” in renewable energy in 2013.

The electricity market reform policy set up a framework to incentivize investment in offshore wind farms by creating an auction system that guarantees electricity prices to developers in 15-year contracts, alongside new contract awards that add 10 GW to the U.K. grid. 

This means there is no upside in terms of market price fluctuation, but there is no downside either. The policy essentially “de-risked the investment,” Jansen said.

The state contracts allowed the industry to innovate and learn how to develop even larger and more efficient turbines with blades that stretch as long as 267 feet, about three-quarters the size of a U.S. football field. 

While this approach helped companies and investors, it will also have an unintended beneficiary — the U.S., Metcalfe from BloombergNEF said. 

Developers are “taking the lessons they’ve learned building projects in Europe, the cost reductions that they’ve achieved building projects in Europe and are now bringing those to the U.S. market,” he said.


Related News

View more

Prairie Provinces to lead Canada in renewable energy growth

Canada Renewable Power sees Prairie Provinces surge as Canada Energy Regulator projects rising wind, solar, and hydro capacity in Alberta, Saskatchewan, and Manitoba, replacing coal, expanding the grid, and lowering emissions through 2023.


Key Points

A CER outlook on Canada's grid: Prairie wind, solar, and hydro growth replacing coal and cutting emissions by 2023.

✅ Prairie wind, solar capacity surge by 2023

✅ Alberta, Saskatchewan shift from coal to renewables, gas

✅ Manitoba strengthens hydro leadership, low-carbon grid


Canada's Prairie Provinces will lead the country's growth in renewable energy capacity over the next three years, says a new report by the Canada Energy Regulator (CER).

The online report, titled Canada's Renewable Power, says decreased reliance on coal and substantial increases in wind and solar capacity will increase the amount of renewable energy added to the grid in Alberta and Saskatchewan. Meanwhile, Manitoba will strengthen its position as a prominent hydro producer in Canada. The pace of overall renewable energy growth is expected to slow at the national level between 2021 and 2023, in part due to lagging solar demand in some markets, but with strong growth in provinces with a large reliance on fossil fuel generation.

The report explores electricity generation in Canada and provides a short-term outlook for renewable electricity capacity in each province and territory to 2023. It also features a series of interactive visuals that allow for comparison between regions and highlights the diversity of electricity sources across Canada.

Electricity generation from renewable sources is expected to continue increasing as demand for electricity grows and the country continues its transition to a lower-carbon economy. Canada will see gradual declines in overall carbon emissions from electricity generation largely due to Saskatchewan, Alberta, Nova Scotia and New Brunswick replacing coal with renewables and natural gas. The pace of growth beyond 2023 in renewable power will depend on technological developments; consumer preferences; and government policies and programs.

Canada is a world leader in renewable power, generating almost two-thirds of its electricity from renewables with hydro as the dominant source, and the country ranks in the top 10 for hydropower jobs worldwide. Canada also has one of the world's lowest carbon intensities for electricity.

The CER produces neutral and fact-based energy analysis to inform the energy conversation in Canada. This report is part of a portfolio of publications on energy supply, demand and infrastructure that the CER publishes regularly as part of its ongoing market monitoring.

Report highlights

  • Wind capacity in Saskatchewan is projected to triple and nearly double in Alberta between 2020 and 2023 as wind power becomes more competitive in the market. Significant solar capacity growth is also projected, with Alberta adding 1,200 MW by 2023, as Canada approaches a 5 GW solar milestone by that time.
  • In Alberta, the share of renewables in the capacity mix is expected to increase from 16% in 2017 to 26% by 2023, with a renewable energy surge supporting thousands of jobs. Similarly, Saskatchewan's renewable share of capacity is expected to increase from 25% in 2018 to 33% in 2023.
  • Renewable capacity growth slows most notably in Ontario, where policy changes have scaled back growth projections. Between 2010 and 2017, renewable capacity grew 6.8% per year. Between 2018 and 2023, growth in Ontario slows to 0.4% per year as capacity grows by 466 MW over this period.
  • New large-scale hydro, wind, and solar projects will push the share of renewables in Canada's electricity mix from 67% of installed capacity in 2017 to 71% in 2023.
  • Hydro is the dominant source of electricity in Canada accounting for 55% of total installed capacity and 59% of generation, though Alberta's limited hydro stands as a notable exception, with B.C., Manitoba, Quebec, Newfoundland and Labrador, and Yukon deriving more than 90% of their power from hydro.
  • The jurisdictions with the highest percentage of non-hydro renewable electricity generation are PEI (100%), Nova Scotia (15.8%), and Ontario (10.5%).
  • In 2010, 62.8% of Canada's total electricity generation (364 681 GW‧h) was from renewable sources. By 2018, 66.2% (425 722 GW‧h) was from renewable sources and projected to be 71.0% by 2023.


Related News

View more

Canadian climate policy and its implications for electricity grids

Canada Electricity Decarbonization Costs indicate challenging greenhouse gas reductions across a fragmented grid, with wind, solar, nuclear, and natural gas tradeoffs, significant GDP impacts, and Net Zero targets constrained by intermittency and limited interties.


Key Points

Costs to cut power CO2 via wind, solar, gas, and nuclear, considering grid limits, intermittency, and GDP impacts.

✅ Alberta model: eliminate coal; add wind, solar, gas; 26-40% CO2 cuts

✅ Nuclear option enables >75% cuts at higher but feasible system costs

✅ National costs 1-2% GDP; reserves, transmission, land, and waste not included


Along with many western developed countries, Canada has pledged to reduce its greenhouse gas emissions by 40–45 percent by 2030 from 2005 emissions levels, and to achieve net-zero emissions by 2050.

This is a huge challenge that, when considered on a global scale, will do little to stop climate change because emissions by developing countries are rising faster than emissions are being reduced in developed countries. Even so, the potential for achieving emissions reduction targets is extremely challenging as there are questions as to how and whether targets can be met and at what cost. Because electricity can be produced from any source of energy, including wind, solar, geothermal, tidal, and any combustible material, climate change policies have focused especially on nations’ electricity grids, and in Canada cleaning up electricity is viewed as critical to meeting climate pledges.

Canada’s electricity grid consists of ten separate provincial grids that are weakly connected by transmission interties to adjacent grids and, in some cases, to electricity systems in the United States. At times, these interties are helpful in addressing small imbalances between electricity supply and demand so as to prevent brownouts or even blackouts, and are a source of export revenue for provinces that have abundant hydroelectricity, such as British Columbia, Manitoba, and Quebec.

Due to generally low intertie capacities between provinces, electricity trade is generally a very small proportion of total generation, though electricity has been a national climate success in recent years. Essentially, provincial grids are stand alone, generating electricity to meet domestic demand (known as load) from the lowest cost local resources.

Because climate change policies have focused on electricity (viz., wind and solar energy, electric vehicles), and Canada will need more electricity to hit net-zero according to the IEA, this study employs information from the Alberta electricity system to provide an estimate of the possible costs of reducing national CO2 emissions related to power generation. The Alberta system serves as an excellent case study for examining the potential for eliminating fossil-fuel generation because of its large coal fleet, favourable solar irradiance, exceptional wind regimes, and potential for utilizing BC’s reservoirs for storage.

Using a model of the Alberta electricity system, we find that it is infeasible to rely solely on renewable sources of energy for 100 percent of power generation—the costs are prohibitive. Under perfect conditions, however, CO2 emissions from the Alberta grid can be reduced by 26 to 40 percent by eliminating coal and replacing it with renewable energy such as wind and solar, and gas, but by more than 75 percent if nuclear power is permitted. The associated costs are estimated to be some $1.4 billion per year to reduce emissions by at most 40 percent, or $1.9 billion annually to reduce emissions by 75 percent or more using nuclear power (an option not considered feasible at this time).

Based on cost estimates from Alberta, and Ontario’s experience with subsidies to renewable energy, and warnings that the switch from fossil fuels to electricity could cost about $1.4 trillion, the costs of relying on changes to electricity generation (essentially eliminating coal and replacing it with renewable energy sources and gas) to reduce national CO2 emissions by about 7.4 percent range from some $16.8 to $33.7 billion annually. This constitutes some 1–2 percent of Canada’s GDP.

The national estimates provided here are conservative, however. They are based on removing coal-fired power from power grids throughout Canada. We could not account for scenarios where the scale of intermittency turned out worse than indicated in our dataset—available wind and solar energy might be lower than indicated by the available data. To take this into account, a reserve market is required, but the costs of operating such a capacity market were not included in the estimates provided in this study. Also ignored are the costs associated with the value of land in other alternative uses, the need for added transmission lines, environmental and human health costs, and the life-cycle costs of using intermittent renewable sources of energy, including costs related to the disposal of hazardous wastes from solar panels and wind turbines.


Related News

View more

UK sets new record for wind power generation

Britain Wind Generation Record underscores onshore and offshore wind momentum, as National Grid ESO reported 20.91 GW, boosting zero-carbon electricity, renewables share, and grid stability amid milder weather, falling gas prices, and net zero goals.


Key Points

The Britain wind generation record is 20.91 GW, set on 30 Dec, driven by onshore and offshore turbines.

✅ Set on 30 Dec 2022 with peak output of 20.91 GW.

✅ Zero-carbon sources hit 87.2% of grid supply.

✅ Driven by onshore and offshore wind; ESO reported stability.


Britain has set a new record for wind generation as power from onshore and offshore turbines helped boost clean energy supplies late last year.

National Grid’s electricity system operator (ESO), which handles Great Britain’s grid operations, said that a new record for wind generation was set on 30 December, when 20.91 gigawatts (GW) were produced by turbines.

This represented the third time Britain’s fleet of wind turbines set new generation records in 2022. In May, National Grid had to ask some turbines in the west of Scotland to shut down, as the network was unable to store such a large amount of electricity when a then record 19.9GW of power was produced – enough to boil 3.5m kettles.

The ESO said a new record was also set for the share of electricity on the grid coming from zero-carbon sources – renewables and nuclear – which supplied 87.2% of total power. These sources have accounted for about 55% to 59% of power over the past couple of years.

The surge in wind generation represents a remarkable reversal in fortunes as a cold snap that enveloped Britain and Europe quickly turned to milder weather.

Power prices had soared as the freezing weather forced Britons to increase their heating use, pushing up demand for energy despite high bills.

The cold weather came with a period of low wind, reducing the production of Britain’s windfarms to close to zero.

Emergency coal-fired power units at Drax in North Yorkshire were put on standby but ultimately not used, while gas-fired generation accounted for nearly 60% of the UK’s power output at times.

However, milder weather in the UK and Europe in recent days has led to a reduction in demand from consumers and a fall in wholesale gas prices. It has also reduced the risk of power cuts this winter, which National Grid had warned could be a possibility.

Wind generation is increasingly leading the power mix in Britain and is seen as a crucial part of Britain’s move towards net zero. The prime minister, Rishi Sunak, is expected to overturn a moratorium on new onshore wind projects with a consultation on the matter due to run until March.


Related News

View more

NREL’s Electric Vehicle Infrastructure Projection Tool Helps Utilities, Agencies, and Researchers Predict Hour-by-Hour Impact of Charging on the Grid

EVI-Pro Lite EV Load Forecasting helps utilities model EV charging infrastructure, grid load shapes, and resilient energy systems, factoring home, workplace, and public charging behavior to inform planning, capacity upgrades, and flexible demand strategies.


Key Points

A NREL tool projecting EV charging demand and load shapes to help utilities plan the grid and right-size infrastructure.

✅ Visualizes weekday/weekend EV load by charger type.

✅ Tests home, workplace, and public charging access scenarios.

✅ Supports utility planning, demand flexibility, and capacity upgrades.


As electric vehicles (EVs) continue to grow in popularity, utilities and community planners are increasingly focused on building resilient energy systems that can support the added electric load from EV charging, including a possible EV-driven demand increase across the grid.

But forecasting the best ways to adapt to increased EV charging can be a difficult task as EV adoption will challenge state power grids in diverse ways. Planners need to consider when consumers charge, how fast they charge, and where they charge, among other factors.

To support that effort, researchers at the National Renewable Energy Laboratory (NREL) have expanded the Electric Vehicle Infrastructure Projection (EVI-Pro) Lite tool with more analytic capabilities. EVI-Pro Lite is a simplified version of EVI-Pro, the more complex, original version of the tool developed by NREL and the California Energy Commission to inform detailed infrastructure requirements to support a growing EV fleet in California, where EVs bolster grid stability through coordinated planning.

EVI-Pro Lite’s estimated weekday electric load by charger type for El Paso, Texas, assuming a fleet of 10,000 plug-in electric vehicles, an average of 35 daily miles traveled, and 50% access to home charging, among other variables, as well as potential roles for vehicle-to-grid power in future scenarios. The order of the legend items matches the order of the series stacked in the chart.

Previously, the tool was limited to letting users estimate how many chargers and what kind of chargers a city, region, or state may need to support an influx of EVs. In the added online application, those same users can take it a step further to predict how that added EV charging will impact electricity demand, or load shapes, in their area at any given time and inform grid coordination for EV flexibility strategies.

“EV charging is going to look different across the country, depending on the prevalence of EVs, access to home charging, and the kind of chargers most used,” said Eric Wood, an NREL researcher who led model development. “Our expansion gives stakeholders—especially small- to medium-size electric utilities and co-ops—an easy way to analyze key factors for developing a flexible energy strategy that can respond to what’s happening on the ground.”

Tools to forecast EV loads have existed for some time, but Wood said that EVI-Pro Lite appeals to a wider audience, including planners tracking EVs' impact on utilities in many markets. The tool is a user-friendly, free online application that displays a clear graphic of daily projected electric loads from EV charging for regions across the country.

After selecting a U.S. metropolitan area and entering the number of EVs in the light-duty fleet, users can change a range of variables to see how they affect electricity demand on a typical weekday or weekend. Reducing access to home charging by half, for example, results in higher electric loads earlier in the day, although energy storage and mobile charging can help moderate peaks in some cases. That is because under such a scenario, EV owners might rely more on public or workplace charging instead of plugging in at home later in the evening or at night.

“Our goal with the lite version of EVI-Pro is to make estimating loads across thousands of scenarios fast and intuitive,” Wood said. “And if utilities or stakeholders want to take that analysis even deeper, our team at NREL can fill that gap through partnership agreements, too. The full version of EVI-Pro can be tailored to develop detailed studies for individual planners, agencies, or utilities.”


Related News

View more

Sign Up for Electricity Forum’s Newsletter

Stay informed with our FREE Newsletter — get the latest news, breakthrough technologies, and expert insights, delivered straight to your inbox.

Electricity Today T&D Magazine Subscribe for FREE

Stay informed with the latest T&D policies and technologies.
  • Timely insights from industry experts
  • Practical solutions T&D engineers
  • Free access to every issue

Live Online & In-person Group Training

Advantages To Instructor-Led Training – Instructor-Led Course, Customized Training, Multiple Locations, Economical, CEU Credits, Course Discounts.

Request For Quotation

Whether you would prefer Live Online or In-Person instruction, our electrical training courses can be tailored to meet your company's specific requirements and delivered to your employees in one location or at various locations.