CSA Z462 Arc Flash Training – Electrical Safety Compliance Course
Our customized live online or in‑person group training can be delivered to your staff at your location.

- Live Online
- 6 hours Instructor-led
- Group Training Available
Regular Price:
$249
Coupon Price:
$199
SAN FRANCISCO
—
California EV Adoption leads the U.S., with 37% of registered electric vehicles and 27% of charging locations, spanning Level 1, Level 2, and DC Fast stations, aligned with OCPI and boosted by CALeVIP funding.
How It All Fits Together
California EV adoption reflects the state's leading EV registrations and growth in private charging infrastructure.
Holds 37% of U.S. EVs and 27% of charging locations as of 2022.
Growth aided by CALeVIP funding and OCPI-aligned infrastructure data.
CA EVs rose from 247,400 to 1.1M; locations from 5,486 to 14,822 since 2016.
U.S. ratio hit 55 EVs per location in 2022; CA at 75, NJ leads with 100.
CA share of U.S. EVs fell from 48% to 37% as adoption broadened nationwide.
California has consistently been at the forefront of electric vehicle (EV) adoption, with EV sales topping 20% in California underscoring this trend, and the proliferation of EV charging stations in the United States, maintaining this position since 2016. According to recent estimates from our State Energy Data System (SEDS), California accounts for 37% of registered light-duty EVs in the U.S. and 27% of EV charging locations as of the end of 2022.
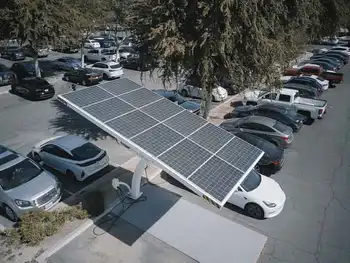
The vehicle stock data encompass all registered on-road, light-duty vehicles and exclude any previous vehicle sales no longer in operation. The data on EV charging locations include both private and public access stations for Legacy, Level 1, Level 2, and DC Fast charging ports, excluding EV chargers in single-family residences. There is a data series break between 2020 and 2021, when the U.S. Department of Energy updated its data to align with the Open Charge Point Interface (OCPI) international standard, reflecting changes in the U.S. charging infrastructure landscape.
In 2022, the number of registered EVs in the United States, with U.S. EV sales soaring into 2024 nationwide, surged to six times its 2016 figure, growing from 511,600 to 3.1 million, while the number of U.S. charging locations nearly tripled, rising from 19,178 to 55,015. Over the same period, California saw its registered EVs more than quadruple, jumping from 247,400 to 1.1 million, and its charging locations tripled, increasing from 5,486 to 14,822.
California's share of U.S. EV registrations has slightly decreased in recent years as EV adoption has spread across the country, with Arizona EV ownership relatively high as well. In 2016, California accounted for approximately 48% of light-duty EVs in the United States, which was approximately 12 times more than the state with the second-highest number of EVs, Georgia. By 2022, California's share had decreased to around 37%, which was still approximately six times more than the state with the second-most EVs, Florida.
On the other hand, California's share of U.S. EV charging locations has risen slightly in recent years, as charging networks compete amid federal electrification efforts and partly due to the California Electric Vehicle Infrastructure Project (CALeVIP), which provides funding for the installation of publicly available EV charging stations. In 2016, approximately 25% of U.S. EV charging locations were in California, over four times as many as the state with the second-highest number, Texas. In 2022, California maintained its position with over four times as many EV charging locations as the state with the second-most, New York.
The growth in the number of registered EVs has outpaced the growth of EV charging locations in the United States, and in 2021 plug-in vehicles traveled 19 billion electric miles nationwide, underscoring utilization. In 2016, there were approximately 27 EVs per charging location on average in the country. Alaska had the highest ratio, with 67 EVs per charging location, followed by California with 52 vehicles per location.
In 2022, the average ratio was 55 EVs per charging location in the United States, raising questions about whether the grid can power an ongoing American EV boom ahead. New Jersey had the highest ratio, with 100 EVs per charging location, followed by California with 75 EVs per location.
Related News
Invenergy and GE Renewable Energy complete largest wind project constructed in North America
North Central Energy Facilities deliver 1,484 MW of renewable power in Oklahoma, uniting Invenergy, GE…
View more

Vancouver seaplane airline completes first point-to-point flight with prototype electric aircraft
Harbour Air Electric Seaplane completes a point-to-point test flight, showcasing electric aircraft innovation, zero-emission short-haul…
View more
Canada set to hit 5 GW milestone
Canada Solar Capacity Outlook 2022-2050 projects 500 MW new PV in 2022 and 35 GW…
View more
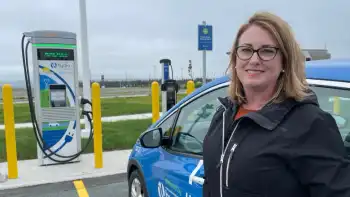
Completion of 1st fast-charging network 'just the beginning' for electric car owners in N.L.
Newfoundland EV Fast-Charging Network enables DC fast charging along the Trans-Canada Highway, from Port aux…
View more
YVR welcomes government funding for new Electric Vehicle Chargers
YVR EV Charging Infrastructure Funding backs new charging stations at Vancouver International Airport via ZEVIP…
View more

Wind, solar, batteries make up 82% of 2023 utility-scale US pipeline
US Renewable Energy Capacity 2023 leads new utility-scale additions, with solar, wind, and battery storage…
View more
Sign Up for Electricity Forum’s Newsletter
Stay informed with our FREE Newsletter — get the latest news, breakthrough technologies, and expert insights, delivered straight to your inbox.
Electricity Today T&D Magazine Subscribe for FREE

Stay informed with the latest T&D policies and technologies.
- Timely insights from industry experts
- Practical solutions T&D engineers
- Free access to every issue
