Ontario Energy Storage Procurement accelerates grid flexibility as IESO seeks lithium batteries, pumped storage, compressed air, and flywheels to balance renewables, support EV charging, and complement gas peakers during Pickering refits and rising electricity demand.
Key Points
Ontario's plan to procure 2,500 MW of storage to firm renewables, aid EV charging, and add flexible grid capacity.
✅ 2,500 MW storage plus 1,500 MW gas for 2025-2027 reliability
✅ Mix: lithium batteries, pumped storage, compressed air, flywheels
✅ Enables VPPs via EVs, demand response, and hybrid solar-storage
Ontario is staring down an electricity supply crunch and amid a rush to secure more power, it is plunging into the world of energy storage — a relatively unknown solution for the grid that experts say could also change energy use at home.
Beyond the sprawling nuclear plants and waterfalls that generate most of the province’s electricity sit the batteries, the underground caverns storing compressed air to generate electricity, and the spinning flywheels waiting to store energy at times of low demand and inject it back into the system when needed.
The province’s energy needs are quickly rising, with the proliferation of electric vehicles and growing Canada-U.S. collaboration on EV adoption, and increasing manufacturing demand for electricity on the horizon just as a large nuclear plant that supplies 14 per cent of Ontario’s electricity is set to be retired and other units are being refurbished.
The government is seeking to extend the life of the Pickering Nuclear Generating Station, planning an import agreement for power with Quebec, rolling out conservation programs, and — controversially — relying on more natural gas to fill the looming gap between demand and supply, amid Northern Ontario sustainability debates.
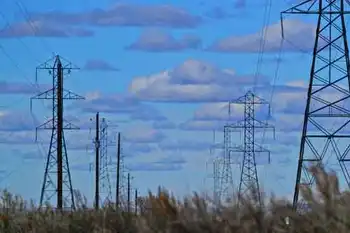
Officials with the Independent Electricity System Operator say a key advantage of natural gas generation is that it can quickly ramp up and down to meet changes in demand. Energy storage can provide that same flexibility, those in the industry say.
Energy Minister Todd Smith has directed the IESO to secure 1,500 megawatts of new natural gas capacity between 2025 and 2027, along with 2,500 megawatts of clean technology such as energy storage that can be deployed quickly, which together would be enough to power the city of Toronto.
It’s a far cry from the 54 megawatts of energy storage in use in Ontario’s grid right now.
Smith said in an interview that it’s the largest active procurement for energy storage in North America.
“The one thing that we want to ensure that we do is continue to add clean generation as much as possible, and affordable and clean generation that’s reliable,” he said.
Rupp Carriveau, director of the Environmental Energy Institute at the University of Windsor, said the timing is good.
“The space is there, the technology is there, and the willingness among private industry to respond is all there,” he said. “I know of a lot of companies that have been rubbing their hands together, looking at this potential to construct storage capacity.”
Justin Rangooni, the executive director of Energy Storage Canada, said because of the relatively tight timelines, the 2,500 megawatts is likely to be mostly lithium batteries. But there are many other ways to store energy, other than a simple battery.
“As we get to future procurements and as years pass, you’ll start to see possibly pump storage, compressed air, thermal storage, different battery chemistry,” he said.
Pump storage involves using electricity during off-peak periods to pump water into a reservoir and slowly releasing it to run a turbine and generate electricity when it’s needed. Compressed air works similarly, and old salt caverns in Goderich, Ont., are being used to store the compressed air.
In thermal storage, electricity is used to heat water when demand is low and when it’s needed, water stored in tanks can be used as heat or hot water.
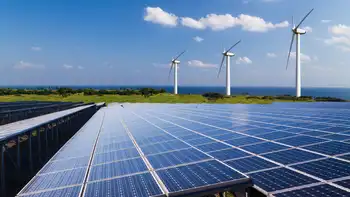
Flywheels are large spinning tops that can store kinetic energy, which can be used to power a turbine and produce electricity. A flywheel facility in Minto, Ont., also installed solar panels on its roof and became the first solar storage hybrid facility in Ontario, said a top IESO official.
Katherine Sparkes, the IESO’s director of innovation, research and development, said it’s exciting, from a grid perspective.
“As we kind of look to the future and we think about gas phase out and electrification, one of the big challenges that all power systems across North America and around the world are looking at is: how do you accommodate increasing amounts of variable, renewable resources and just make better use of your grid assets,” she said.
“Hybrids, storage generation pairings, gives you that opportunity to deal with the variability of renewables, so to store electricity when the sun isn’t shining, or the wind isn’t blowing, and use it when you need it to.”
The small amount of storage already in the system provides more fine tuning of the electricity system, whereas 2,500 megawatts will be a more “foundational” part of the toolkit, said Sparkes.
But what’s currently on the grid is far from the only storage in the province. Many commercial and industrial consumers, such as large manufacturing facilities or downtown office buildings, are using storage to manage their electricity usage, relying on battery energy when prices are high.
The IESO sees that as an opportunity and has changed market rules to allow those customers to sell electricity back to the grid when needed.
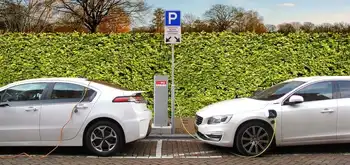
As well, the IESO has its eye on the thousands of mobile batteries in electric vehicles, a trend seen in California, that shuttle people around the province every day but sit unused for much of the time.
“If we can enable those batteries to work together in aggregation, or work with other types of technologies like solar or smart building systems in a configuration, like a group of technologies, that becomes a virtual power plant,” Sparkes said.
Peak Power, a company that seeks to “make power plants obsolete,” is running a pilot project with electric vehicles in three downtown Toronto office buildings in which the car batteries can provide electricity to reduce the facility’s overall demand during peak periods using vehicle-to-building charging with bidirectional chargers.
In that model, one vehicle can earn $8,000 per year, said cofounder and chief operating officer Matthew Sachs.
“Battery energy storage will change the energy industry in the same way and for the same reasons that refrigeration changed the milk industry,” he said.
“As you had refrigeration, you could store your commodity and that changed the distribution channels of it. So I believe that energy storage is going to radically change the distribution channels of energy.”
If every home has a solar panel, an electric vehicle and a residential battery, it becomes a generating station, a decentralization that’s not only more environmentally friendly, but also relies less on “monopolized utilities,” Sachs said.
In the next decade, energy demand from electric vehicles is projected to skyrocket, making vehicle-to-grid integration increasingly relevant, and Sachs said the grid can’t grow enough to accommodate a peak demand of hundreds of thousands of vehicles being plugged in to charge at the end of the workday commute. Authorities need to be looking at more incentives such as time-of-use pricing and price signals to ensure the demand is evened out, he said.
“It’s a big risk as much as it’s a big opportunity,” he said. “If we do it wrong, it will cost us billions to fix. If we do it right, it can save us billions.”
Jack Gibbons, the chair of the Ontario Clean Air Alliance, said the provincial and federal governments need to fund and install bidirectional chargers in order to fully take advantage of electric vehicles.
“This is a huge missed opportunity,” he said.
Related News