Maryland's reliability standards become law

By Associated Press


CSA Z462 Arc Flash Training - Electrical Safety Essentials

Our customized live online or in‑person group training can be delivered to your staff at your location.

  • Live Online
  • 6 hours Instructor-led
  • Group Training Available
Regular Price:
$249
Coupon Price:
$199
Reserve Your Seat Today
The governor of the US state of Maryland, Martin O'Malley and Maryland lawmakers have formally announced legislation to put utility reliability standards into the law.

The measure will require the Maryland Public Service Commission to adopt enhanced reliability standards by July 2012. The bill also will allow the PSC to fine utilities for poor performance. Fines would be directed back to affected ratepayers.

Pepco, a utility that serves customers in Washington, and Prince George's and Montgomery counties, has been widely criticized for long delays restoring power to thousands of customers.

Related News

U.S. Electricity Sales Projections Continue to Fall

US Electricity Demand Outlook examines EIA forecasts, GDP decoupling, energy efficiency, electrification, electric vehicles, grid load growth, and weather variability to frame long term demand trends and utility planning scenarios.


Key Points

An analysis of EIA projections showing demand decoupling from GDP, with EV adoption and efficiency shaping future grid load.

✅ EIA lowers load growth; demand decouples from GDP.

✅ Efficiency and sector shifts depress kWh sales.

✅ EV adoption could revive load and capacity needs.


Electricity producers and distributors are in an unusual business. The product they provide is available to all customers instantaneously, literally at the flip of a switch. But the large amount of equipment, both hardware and software to do this takes years to design, site and install.

From a long range planning perspective, just as important as a good engineering design is an accurate sales projections. For the US electric utility industry the most authoritative electricity demand projec-tions come from the Department of Energy’s Energy Information Administration (EIA). EIA's compre-hensive reports combine econometric analysis with judgment calls on social and economic trends like the adoption rate of new technologies that could affect future electricity demand, things like LED light-ing and battery powered cars, and the rise of renewables overtaking coal in generation.

Before the Great Recession almost a decade ago, the EIA projected annual growth in US electricity production at roughly 1.5 percent per year. After the Great Recession began, the EIA lowered its projections of US electricity consumption growth to below 1 percent. Actual growth has been closer to zero. While the EIA did not antici-pate the last recession or its aftermath, we cannot fault them on that.

After the event, though, the EIA also trimmed its estimates of economic growth. For the 2015-2030 period it now predicts 2.1 percent economic and 0.3 percent electricity growth, down from previously projections of 2.7 percent and 1.3 percent respectively. (See Figures 1 and 2.)


Table 1. EIA electric generation projections by year of forecast (kWh billions)


Table 2. EIA forecast of GDP by year of forecast (billion 2009 $)

Back in 2007, the EIA figured that every one percent increase in economic activity required a 0.48 percent in-crease in electric generation to support it. By 2017, the EIA calculated that a 1 percent growth in economic activity now only required a 0.14 percent increase in electric output. What accounts for such a downgrade or disconnect between electricity usage and economic growth? And what factors might turn the numbers 
around?

First, the US economy lost energy intensive heavy industry like smelting, steel mills and refineries; patterns in China's electricity sector highlight how industrial shifts can reshape power demand. A more service oriented economy (think health care) relies more heavily on the movement of data or information and uses far less power than a manufacturing-oriented economy.

A small volcano in Argentina is about to fuel the next tech boom – and a little known company is going to be right at the center. Early investors stand to gain incredible profits and you can too. Read the report.

Second, internet shopping has hurt so-called "brick and mortar" retailers. Despite the departure of heavy industry, in years past a burgeoning US commercial sector increased its demand and usage of electricity to offset the industrial decline. But not anymore. Energy efficiency measures as well as per-haps greater concern about global warming and greenhouse gas emissions and have cut into electricity sales. “Do more with less” has the right ring to it.

But there may be other components to the ongoing decline in electricity usage. Academic studies show that electricity usage seems to increase with income along an S curve, and flattens out after a certain income level. That is, if you earn $1 billion per year you do not (or cannot) use ten times a much electricity as someone earning only $100 million.

But people at typical, middle income levels increase or decrease electricity usage when incomes rise or fall. The squeeze on middle income families was discussed often in the late presidential campaign. In recent decades an increasing percentage of income has gone to a small percentage of the population at the top of the income scale. This trend probably accounts for some weakness in residential sales. This suggests that government policy addressing income inequality would also boost electricity sales.

Population growth affects demand for electricity as well as the economy as a whole. The EIA has made few changes in its projections, showing 0.7 percent per year population growth in 2015- 2030 in both the 2007 and 2017 forecasts. Recent studies, however, have shown a drop in the birth rate to record lows. More troubling, from a national health perspective is that the average age of death may have stopped rising. Those two factors point to lower population growth, especially if the government also restricts immi-gration. Thus, the US may be approaching a period of rather modest population growth.

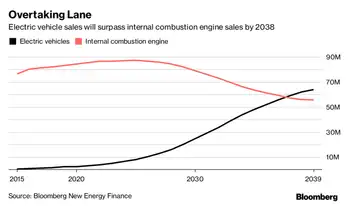
All of the above factors point to minimal sales growth for electricity producers in the US--perhaps even lower than the seemingly conservative EIA estimates. But the cloud on the horizon has a silver lining in the shape of an electric car. Both the United Kingdom and France have set dates to end of production of automobiles with internal combustion engines. Several European car makers have declared that 20 percent of their output will be electric vehicles by the early 2020s. If we adopt automobiles powered by electricity and not gasoline or diesel, electricity sales would increase by one third. For the power indus-try, electric vehicles represent the next big thing.

We don’t pretend to know how electric car sales will progress. But assume vehicle turnover rates re-main at the current 7 percent per year and electric cars account for 5 percent of sales in the first five years (as op-posed to 1 percent now), 20 percent in the next five years and 50 percent in the third five year period. Wildly optimistic assumptions? Maybe. By 2030, electric cars would constitute 28 percent of the vehicle fleet. They would add about 10 percent to kilowatt hour sales by that date, assuming that battery efficiencies do not improved by then. Those added sales would require increased electric generation output, with low-emissions sources expected to cover almost all the growth globally. They would also raise long term growth rates for 2015-2030 from the present 0.3 percent to 1.0 percent. The slow upturn in demand should give the electric companies time to gear up so to speak.

In the meantime, weather will continue to play a big role in electricity consumption. Record heat-induced demand peaks are being set here in the US even as surging global demand puts power systems under strain worldwide.

Can we discern a pattern in weather conditions 15 years out? Maybe we can, but that is one topic we don’t expect a government agency to tackle in public right now. Meantime, weather will affect sales more than anything else and we cannot predict the weather. Or can we?


Related News

View more

N.S. senior suspects smart meter to blame for shocking $666 power bill

Nova Scotia Power smart meter billing raises concerns amid estimated billing, catch-up bills, and COVID-19 meter reading delays, after seniors report doubled electricity usage and higher utility charges despite consistent consumption and on-time payments.


Key Points

Smart meter billing uses digital reads, limits estimates, and may trigger catch-up charges after reading suspensions.

✅ COVID-19 reading pause led to estimated bills and later catch-ups

✅ Smart meters reduce reliance on estimated billing errors

✅ Customers can seek payment plans and bill reviews


A Nova Scotia senior says she couldn't believe her eyes when she opened her most recent power bill. 

Gloria Chu was billed $666 -- more than double what she normally pays, and similar spikes such as rising electricity bills in Calgary have drawn attention.

As someone who always pays her bi-monthly Nova Scotia Power bill in full and on time, Chu couldn't believe it.

According to her bill, her electricity usage almost tripled during the month of May, compared to last year, and is even more than it was last winter, and with some utilities exploring seasonal power rates customers may see confusing swings.

She insists she and her husband aren't doing anything differently -- but one thing has changed.

"I have had a problem since they put the smart meter in," said Chu, who lives in Upper Gulf Shore, N.S.

Chu got a big bill right after the meter was installed in January, too. That one was more than $530.

She paid it, but couldn't understand why it was so high.

As for this bill, she says she just can't afford it, especially amid a recently approved 14% rate hike in Nova Scotia.

"That's all of my CPP," Chu said. "Actually, it's more than my CPP."

Chu says a neighbor up the road who also has a smart meter had her bill double, too. In nearby Pugwash, she says some residents have seen an increase of about $20-$30.

Nova Scotia Power had put a pause on installing smart meters because of the COVID-19 pandemic, but it has resumed as of June 1, with the goal of upgrading 500,000 meters by 2021, even as in other provinces customers have faced fees for refusing smart meters during similar rollouts.

In this case, the utility says it's not the meter that's the problem, and notes that in New Brunswick some old meters gave away free electricity even as the pandemic forced Nova Scotia Power to suspend meter readings for two months.

"As a result, every one of our customers in Nova Scotia received an estimated bill," said Jennifer parker, Nova Scotia Power's director of customer care.

The utility estimated Chu's bill at $182 -- less than she normally pays -- so her latest bill is considered a catch-up bill after meter readings resumed last month.

Parker admits how estimates are calculated isn't perfect.

"There would be a lot of customers who probably had a more accurate bill because of the way that we estimate, and that's actually one of things that smart meters will get rid of, is that we won't need to do estimated billing," Parker said.

Chu isn't quite convinced.

"It is pretty smart for the power company, but it's not smart for us," she said with a laugh.

Nova Scotia Power has put a hold on her bill and says it will work with Chu on an affordable solution, though the province cannot order the utility to lower rates which limits what can be offered.

She just hopes to never see a big bill like this again, while elsewhere in Newfoundland and Labrador a lump-sum electricity credit is being provided to help customers.


Related News

View more

Utility giant Electricite de France acquired 50pc stake in Irish offshore wind farm

Codling Bank Offshore Wind Project will deliver a 1.1 GW offshore wind farm off the Wicklow coast, as EDF Renewables and Fred Olsen Renewables invest billions to support Ireland's CAP 2030 and cut carbon emissions.


Key Points

A 1.1 GW offshore wind farm off Co Wicklow, led by EDF and Fred Olsen, advancing Ireland's CAP 2030 targets.

✅ Up to 1.1 GW capacity; hundreds of turbines off Co Wicklow

✅ EDF Renewables partners with Fred Olsen Renewables

✅ Investment well over €2bn, supporting 70% electricity by 2030


It’s been previously estimated that the entire Codling Bank project, which will eventually see hundreds of wind turbines, such as a huge offshore wind turbine now coming to market, erected about 13km off the Co Wicklow coast, could be worth as much as €100m. The site is set to generate up to 1.1 gigawatts of electricity when it’s eventually operational.

It’s likely to cost well over €2bn to develop, and with new pipelines abroad where Long Island offshore turbine proposals are advancing, scale economies are increasingly relevant.

The other half of the project is owned by Norway’s Fred Olsen Renewables, with tens of millions of euro already reportedly spent on surveys and other works associated with the scheme. Initial development work started in 2003.

Mr Barrett will now continue to focus on his non-Irish renewable projects, at a time when World Bank wind power support is accelerating in developing countries, said Hazel Shore, the company that sold the stake. It added that Johnny Ronan and Conor Ronan, the developer’s brother, will retain an equity interest in the Codling project.

“The Hazel Shore shareholders remain committed to continuing their renewable and forestry businesses,” noted the firm, whose directors include Paddy Teahon, a former secretary of the Department of the Taoiseach and chairman of the National Offshore Wind Association of Ireland.

The French group’s EDF Renewables subsidiary will now partner with the Norwegian firm to develop and build the Codling Bank project, in a sector widely projected to become a $1 trillion business over the coming decades.

EDF pointed out that the acquisition of the Codling Bank stake comes after the government committed to reducing carbon emissions. A Climate Action Plan launched last year will see renewable projects generating 70pc of Ireland’s electricity by 2030, with more than a third of Irish electricity to be green within four years according to recent analysis. Offshore wind is expected to deliver at least 3.5GW of power in support of the objective.

Bruno Bensasson, EDF Group senior executive vice-president of renewable energies and the CEO of EDF Renewables said the French group is “committed to contributing to the Irish government’s renewables goals”.

“This important project clearly strengthens our strong ambition to be a leading global player in the offshore wind industry,” he added. “This is consistent with the CAP 2030 strategy that aims to double EDF’s renewable energy generation by 2030 and increase it to 50GW net.”

Matthieu Hue, the CEO of EDF Renewables UK and Ireland said the firm already has an office in Dublin and is looking for further renewable projects, as New York's biggest offshore wind farm moves ahead, underscoring momentum.

Last November, the ESB teamed up with EDF in Scotland, reflecting how UK offshore wind is powering up, with the Irish utility buying a 50pc stake in the Neart na Gaoithe offshore wind project. The massive wind farm is expected to generate up to 450MW of electricity and will cost about €2.1bn to develop.

EDF said work on that project is “well under way”.


Related News

View more

Covid-19: Secrets of lockdown lifestyle laid bare in electricity data

Lockdown Electricity Demand Trends reveal later mornings, weaker afternoons, and delayed peaks as WFH, streaming, and video conferencing reshape energy demand curves, grid forecasting, and residential electricity usage across Europe, New York, Tokyo, and Singapore.


Key Points

Shifts in power use during lockdowns: later ramps, weaker afternoons, and higher, delayed evening peaks.

✅ Morning ramp starts later; midday demand dips

✅ Evening peak shifts 1-2 hours; higher late-night usage

✅ WFH and streaming raise residential load; industrial demand falls


Life in lockdown means getting up late, staying up till midnight and slacking off in the afternoons.

That’s what power market data in Europe show in the places where restrictions on activity have led to a widespread shift in daily routines of hundreds of millions of people.

It’s a similar story wherever lockdowns bite. In New York City electricity use has fallen as much as 18% from normal times at 8am. Tokyo and three nearby prefectures had a 5% drop in power use during weekdays after Japan declared a state of emergency on April 7, according to Tesla Asia Pacific, an energy forecaster.

Italy’s experience shows the trend most clearly since the curbs started there on March 5, before any other European country. Data from the grid operator Terna SpA gives a taste of what other places are also now starting to report, with global daily demand dips observed in many markets as well.


1. People are sleeping later

With no commute to the office people can sleep longer. Normally, electricity demand began to pick up between 6 a.m. and 8 a.m. Now in Germany, it’s clear coffee machines don’t go on until between 8 a.m. and 9 a.m., said Simon Rathjen, founder of the trading company MFT Energy A/S.

Germany, France and Italy -- which between them make up almost two thirds of the euro-zone economy -- all have furlough measures that allow workers to receive a salary while temporarily suspended from their jobs. The U.K. also has a support package. Many of these workers will be getting up later.

"Now I have quite a relaxed start to the morning,” said David Freeman, an analyst in financial services from London. "I don’t get up until about half an hour before I need to start work.”

2. Less productive afternoons

There is a deeper dip in electricity use in the afternoons. Previously, power use rose between 2pm and 5pm. Now it dips as people head out for a walk or some air, according to UK demand data from National Grid Plc

It’s "as though we are living through a month of Sundays”, said Iain Staffell, senior lecturer in sustainable energy at Imperial College London.

3. Evenings in

From 6pm electricity use begins to rise steeply as people finish work and start chores. Restrictions like work and home schooling that prevent much daytime TV watching lifts in the early evening. This following chart for Germany shows the evening peak for power use coming during later hours.

The evening is when electricity use is highest, with most people confined to their homes. Netflix Inc reported a record 15.8 million paid subscribers – almost double the figure forecast by Wall Street analysts. Video-streaming services like Netflix and YouTube have found a captive audience. The new Disney+ service surpassed 50 million subscribers in just five months, a faster pace than predicted.

Internet traffic is skyrocketing, with a surge in bandwidth-intensive applications like streaming services and Zoom. This may mean that monthly broadband consumption of as much as 600 gigabytes, about 35% higher than before, according to Bloomberg Intelligence.

In Singapore, electricity use has dropped off significantly since the country’s "circuit-breaker” efforts to keep people at home began April 7. Electricity use has fallen and stayed low during the day. But late at night is a different story, as power demand fell sharply immediately after the lockdown began, it has steadily crept back in the past two weeks, perhaps a sign that Tiger King and The Last Dance have been finding late-night fans in the city state.

In Ottawa, COVID-19 closures made it seem as if the city had fallen off the electricity grid, according to local reports.

4. Staying up late

We’re going to bed later too. Demand doesn’t start to drop off until 10pm to 12am, at least an hour later than before.

"My children are definitely going to bed later,” said Liz Stevens, a teaching assistant from London. "Our whole routine is out the window.”

It’s challenging for those that need to predict behaviour – power grids and electricity traders. Forecasting is based on historical data, and there isn’t anything to go into the models gauging use now.

The closest we can get is looking at big events like football World Championships when people are all sitting down at the same time, according to Rathjen at MFT.

"Forecasting demand right now is very tricky,” said Chris Kimmett, director of power grids at Reactive Technologies Ltd. "A global pandemic is uncharted territory."

What normal looks like when the crisis passes is also an open question. Different countries are set to unravel their measures in their own ways, and global power demand has already surged above pre-pandemic levels in some analyses, with Germany and Austria loosening restrictions first and Italy remaining under tight control. Some changes may be permanent, with both workers and employers becoming more comfortable with working from home.

5. Different sectors consume more

In China, which is further along recovering from the pandemic than Europe or the US, the sharp contraction in overall power output masks a shift in daily routines.

Eating habits have changed. Restaurants are expanding delivery and even offering grocery services as the preference for dining at home persists. Household electricity consumption in China probably increased from activities such as cooking and heating, according to IHS Markit, which said that residential demand rose by 2.4% in the first two months as people stayed in.

The increase in technology use also drove China’s power demand from the telecom and web-service sectors to rise by 27%, the consultancy said.

Overall, China power demand in the first quarter of the year fell 6.5% from the same period in 2019 to 1.57 trillion kilowatt-hours, China’s National Energy Administration said last week. Industry uses about 70% of the country’s electricity, while the commercial sector and households account for 14% each. – Bloomberg


Related News

View more

N.L. lags behind Canada in energy efficiency, but there's a silver lining to the stats

Newfoundland and Labrador Energy Efficiency faces low rankings yet signs of progress: heat pumps, EV charging networks, stricter building codes, electrification to tap Muskrat Falls power and cut greenhouse gas emissions and energy poverty.


Key Points

Policies and programs improving N.L.'s energy use via electrification, EVs, heat pumps, and stronger building codes.

✅ Ranks last provincially but showing policy momentum

✅ Heat pump grants and EV charging network underway

✅ Stronger building codes and electrification can cut emissions


Ah, another day, another depressing study that places Newfoundland and Labrador as lagging behind the rest of Canada.

We've been in this place before — least-fit kids, lowest birthrate — and now we can add a new dubious distinction to the pile: a ranking of the provinces according to energy efficiency placed Newfoundland and Labrador last.

Efficiency Canada released its first-ever provincial scorecard Nov. 20, comparing energy efficiency policies among the provinces. With energy efficiency a key part of reducing greenhouse gas emissions, Newfoundland and Labrador sat in 10th place, noted for its lack of policies on everything from promoting EV uptake in Atlantic Canada to improving efficient construction codes.

But before you click away to a happier story (about, say, a feline Instagram superstar) one of the scorecard's authors says there's a silver lining to the statistics.

"It's not that Newfoundland and Labrador is doing anything badly; it's just that it could do more," said Brendan Haley, the policy director at Efficiency Canada, a new think tank based at Carleton University.

"There's just a general lack of attention to implementing efficiency policies relative to other jurisdictions, including New Brunswick's EV rebate programs on transportation."

Looking at the scorecard and comparing N.L. with British Columbia, which snagged the No. 1 spot, isn't a great look. B.C. scored 56 points out of a possible 100, while N.L. got just 15.

Haley pointed out that B.C.'s provincial government is charting progress toward 2032, when all new builds will have to be net-zero energy ready; that is, buildings that can produce as much clean energy as they consume.  

While it might not be feasible to emulate that to a T here, Haley said the province could be mandating better energy efficiency standards for new, large building projects, and, at the same time, promote electrification of such projects as a way to soak up some of that surplus Muskrat Falls electricity.

Staring down Muskrat's 'extraordinary' pressure on N.L. electricity rates

It's impossible to talk about energy efficiency in N.L. without considering that dam dilemma. As Muskrat Falls comes online, likely at the end of 2020, customer power rates are set to rise in order to pay for it, and the province is still trying to figure out the headache that is rate mitigation.

"There is a strategic choice to be made in Newfoundland and Labrador," Haley told CBC Radio's On The Go.

While having more customers using Muskrat Falls power can help with rate mitigation, including through initiatives like N.L.'s EV push to grow demand, Haley noted simply using its excess electricity for the sake of it isn't a great goal.

"That should not be an excuse, I think, to almost have a policy of wasting energy on purpose, or saying that we don't need programs that help save electricity anymore," he said.

Energy poverty
Lots of N.L. homeowners are currently feeling a chill from the spectre of rising electricity rates.

Of course, that draft could be coming from a poorly insulated and heated house, as Efficiency Canada noted 38 per cent of all households in N.L. live in what it calls "energy poverty," where they spend more than six per cent of their after-tax income on energy — that's the second highest such rate in the country.

That poverty speaks for a need for N.L.to boost efficiency incentives for vulnerable populations, although Haley noted the government is making progress. The province recently expanded its home energy savings program, doubling in the last budget year to $2 million, which gives grants to low income households for upgrades like insulation.

Can you guess what products are selling like hotcakes as Muskrat Falls looms? Heat pumps

And since Efficiency Canada compiled its scorecard, the province has introduced a $1-million heat pump program, in which 1,000 homeowners could receive $1,000 toward the purchase of a heat pump. 

That program began accepting applications Oct. 15, and one month in, has had 682 people apply, according to the Department of Municipal Affairs and Environment, along with thousands of inquiries.

Heat pump popularity
Even without that program, heat pump sales have skyrocketed in the province since 2017. That popularity doesn't come as much of a surprise to Darren Brake, the president of KSAB Construction in Corner Brook.

With more than two decades in the home building business, he's been seeing consumer demand for home energy efficiency rise to the point where a year ago, his company transitioned into only building third-party certified energy efficient homes.

"Everybody's really concerned about the escalating power costs and energy costs, I assume because of Muskrat Falls," he said.

"It's evolving now, as we speak. Everybody is all about that monthly payment."

Brake uses spray foam installation in every house he builds, to seal up any potential leaks. Without sealing the building envelope, he says, a heat pump is far less efficient. (Lindsay Bird/CBC)
And in the weakest housing market in the province in half a century, Brake has been steadily moving his, building and selling seven in the last year.

Brake's houses include heat pumps, but he said the real savings come from their heavily insulated walls, roof and floors. Homeowners looking to install a heat pump in their leaky old house, he said, won't see lower power bills in quite the same way.

"They are energy efficient, but it's more about the building envelope to make a home efficient and easy to heat. You can put a heat pump in an older home that leaks a lot of air, and you won't get the same results," he said.

Charging network coming
The other big piece to the efficiency puzzle — in the scorecard's eyes — is electric vehicles. Those could, again, use some of that Muskrat Falls energy, as well as curtail gas guzzling, but Efficiency Canada pointed to a lack of policies and incentives surrounding electrifying transportation, such as Nova Scotia's vehicle-to-grid pilot that illustrates innovation elsewhere.

Unlike Quebec or B.C., the province doesn't offer a rebate for buying EVs, even as N.W.T. encourages EVs through targeted measures, and while electric vehicles got loud applause at the House of Assembly last week, it was absent of any policy or announcement beyond the province unveiling a EV licence plate design to be used in the near future.

Electric-vehicle charging network planned for N.L. in 2020

But since the scorecard was tallied, NL Hydro has unveiled plans for a Level 3 charging network for EVs across the island, dependent on funding, with N.L.'s first fast-charging network seen as just the beginning for local drivers.

NL Hydro says while its request for proposals for an island-wide charging network closed earlier in November, there is no progress update yet, even as N.B.'s fast-charging rollout advances along the Trans-Canada. (Credit: iStock/Getty Images)
That cash appears to still be in limbo, as "we are still progressing through the funding process," said an NL Hydro spokesperson in an email, with no "additional details to release at this time."

Still, the promise of a charging network — plus the swift uptake on the heat pump program — could boost N.L.'s energy efficiency scorecard next time it's tallied, said Haley.

"It is encouraging to see the province moving forward on smart and efficient electrification," he said.


Related News

View more

Report: Solar ITC Extension Would Be ‘Devastating’ for US Wind Market

Solar ITC Impact on U.S. Wind frames how a 30% solar investment tax credit could undercut wind PTC economics, shift corporate procurement, and, without transmission and storage, slow onshore builds despite offshore wind momentum.


Key Points

It is how a solar ITC extension may curb U.S. wind growth absent PTC parity, transmission, storage, and offshore backing.

✅ ITC at 30% risks shifting corporate procurement to solar.

✅ Post-PTC wind faces grid, transmission, and curtailment headwinds.

✅ Offshore wind, storage pairing, TOU demand could offset.


The booming U.S. wind industry, amid a wind power surge, faces an uncertain future in the 2020s. Few factors are more important than the fate of the solar ITC.

An extension of the solar investment tax credit (ITC) at its 30 percent value would be “devastating” to the future U.S. wind market, according to a new Wood Mackenzie report.

The U.S. is on track to add a record 14.6 gigawatts of new wind capacity in 2020, despite Covid-19 impacts, and nearly 39 gigawatts during a three-year installation boom from 2019 to 2021, according to Wood Mackenzie’s 2019 North America Wind Power Outlook.

But the market’s trajectory begins to look highly uncertain from the early 2020s onward, and solar is one of the main reasons why.

Since the dawn of the modern American renewables market, the wind and solar sectors have largely been allies on the national stage, benefiting from many of the same favorable government plans and sharing big-picture goals. Until recently, wind and solar companies rarely found themselves in direct competition.

But the picture is changing as solar catches up to wind on cost and the grid penetration of renewables surges. What was once a vague alliance between the two fastest growing renewables technologies could morph into a serious rivalry.

While many project developers are now active in both sectors, including NextEra Energy Resources, Invenergy and EDF, the country’s thriving base of wind manufacturers could face tougher days ahead.


The ITC's inherent advantage

At this point, wind remains solar’s bigger sibling in many ways.

The U.S. has nearly 100 gigawatts of installed wind capacity today, compared to around 67 gigawatts of solar. With their substantially higher capacity factors, wind farms generated four times more power for the U.S. grid last year than utility-scale solar plants, for a combined wind-solar share of 8.2 percent, according to government figures, even as renewables are projected to reach one-fourth of U.S. electricity generation. (Distributed PV systems further add to solar’s contribution.)

But it's long been clear that wind would lose its edge at some point. The annual solar market now regularly tops wind. The cost of solar energy is falling more rapidly, and appears to have more runway for further reduction. Solar’s inherent generation pattern is more valuable in many markets, delivering power during peak-demand hours, while the wind often blows strongest at night.


And then there’s the matter of the solar ITC.

In 2015, both wind and solar secured historic multi-year extensions to their main federal subsidies. The extensions gave both industries the longest period of policy clarity they’ve ever enjoyed, setting in motion a tidal wave of installations set to crest over the next few years.

Even back in 2015, however, it was clear that solar got the better deal in Washington, D.C.

While the wind production tax credit (PTC) began phasing down for new projects almost immediately, solar developers were given until the end of 2019 to qualify projects for the full ITC.

And critically, while the wind PTC drops to nothing after its sunset, commercially owned solar projects will remain eligible for a 10 percent ITC forever, based on the existing legislation. Over time, that amounts to a huge advantage for solar.

In another twist, the solar industry is now openly fighting for an extension of the 30 percent ITC, while the wind industry seemingly remains cooler on the prospect of pushing for a similar prolongation — having said the current PTC extension would be the last.


Plenty of tailwinds, too

Wood Mackenzie's report catalogues multiple factors that could work for or against the wind market in the "uncharted" post-PTC years, many of them, including the Covid-19 crisis, beyond the industry’s direct control.

If things go well, annual installations could bounce back to near-record levels by 2027 after a mid-decade contraction, the report says. But if they go badly, installations could remain depressed at 4 gigawatts or below from 2022 through most of the coming decade, and that includes an anticipated uplift from the offshore market.

An extension of the solar ITC without additional wind support would “severely compound” the wind market’s struggle to rebound in the 2020s, the report says. The already-evident shift in corporate renewables procurement from wind to solar could intensify dramatically.

The other big challenge for wind in the 2020s is the lack of progress on transmission infrastructure that would connect potentially massive low-cost wind farms in interior states with bigger population centers. A hoped-for national infrastructure package that might address the issue has not materialized.

Even so, many in the wind business remain cautiously optimistic about the post-PTC years, with a wind jobs forecast bolstering sentiment, and developers continue to build out longer-term project pipelines.

Turbine technology continues to improve. And an extension of the solar ITC is far from assured.

Other factors that could work in wind’s favor in the years ahead include:

The nascent offshore sector, which despite lingering regulatory uncertainty at the federal level looks set to blossom into a multi-gigawatt annual market by the mid-2020s, in line with an offshore wind forecast that highlights substantial growth potential. Lobbying efforts for an offshore wind ITC extension are gearing up, offering a potential area for cooperation between wind and solar.

The potential linkage of policy support for energy storage to wind projects, building on the current linkage with solar.

Growing electric vehicle sales and a shift toward time-of-use retail electricity billing, which could boost power demand during off-peak hours when wind generation is strong.

The land-use advantages wind farms have over solar in some agricultural regions.


Related News

View more

Sign Up for Electricity Forum’s Newsletter

Stay informed with our FREE Newsletter — get the latest news, breakthrough technologies, and expert insights, delivered straight to your inbox.

Electricity Today T&D Magazine Subscribe for FREE

Stay informed with the latest T&D policies and technologies.
  • Timely insights from industry experts
  • Practical solutions T&D engineers
  • Free access to every issue

Live Online & In-person Group Training

Advantages To Instructor-Led Training – Instructor-Led Course, Customized Training, Multiple Locations, Economical, CEU Credits, Course Discounts.

Request For Quotation

Whether you would prefer Live Online or In-Person instruction, our electrical training courses can be tailored to meet your company's specific requirements and delivered to your employees in one location or at various locations.