Hundreds jam power line hearing

By The Pocono Record


Substation Relay Protection Training

Our customized live online or in‑person group training can be delivered to your staff at your location.

  • Live Online
  • 12 hours Instructor-led
  • Group Training Available
Regular Price:
$699
Coupon Price:
$599
Reserve Your Seat Today
It was hard to miss the 190-foot-tall crane.

It was parked just outside the door of Top of the World in Saw Creek Estates, where the Pennsylvania Public Utility Commission held public hearings on a proposed transmission line through the development.

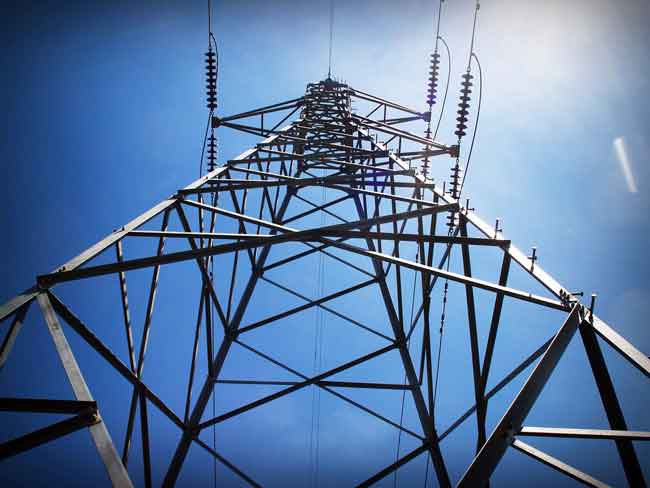
The crane was there to approximate the look of the 190-foot transmission towers proposed by PPL Electric Utilities. The towers would carry 730-kilovolts of electricity from the Berwick power plant through Luzerne, Lackawanna, Wayne, Pike and Monroe counties and on to a link-up in Roseland, N.J.

PPL says the project would improve reliability of the power grid, but residents along the line are fighting the proposal. Especially in Saw Creek, where PPL runs a smaller line already.

More than 300 people packed the 1 p.m. PUC hearing. Many, including a newborn baby, wore "Stop the Power Lines" buttons.

State Sen. Lisa Baker, R-20, was the first to testify. She said the health effects of high electromagnetic fields are still debated, and property values would suffer from the lines.

"The company must find an alternative route out of fairness to the public," Baker said. The audience erupted in applause after Baker and a few other like-minded speakers.

A few speakers questioned why more electric power should be generated when demand is down, the cost of coal is on the rise, and alternative energies such as wind and solar power would be more environmentally friendly.

"PJM still believes the (need) is going to increase. The line is being built for the future," said Paul Wirth, PPL spokesperson.

PJM Interconnection is a regional transmission organization that coordinates the movement of wholesale electricity in all or part of 13 states and the District of Columbia — an area stretching from Illinois to Pennsylvania south to North Carolina and Tennessee. They run the power grid.

With AIG bonuses fresh in the news, some speakers likened PPL to the companies that got government bailouts.

"This has nothing to do with need and everything to do with corporate greed," Saw Creek Estates Community Association President Peter Derrenbacher said.

Wirth disagreed with the greed angle.

"I don't get the connection. PPL did not propose to build the line, PJM did," Wirth said.

He also disagreed with the many speakers who said home values would drop if plan is approved. A Realtor testified that home buyers are already shunning Saw Creek because of the proposal and claimed home values could drop by 50 percent after the line is put in.

"I think the alarmist Web site and the alarmist newspaper ads are keeping people away at this time," Wirth said.

In his testimony, Lehman Township Supervisor Paul Menditto told the PUC, "One does not have to be a real estate expert to understand what will happen to property values. In these hard economic times, please don't let this happen."

Menditto also said the jobs PPL is promising through this project are temporary and will not likely go to local people.

It is worth noting that Saw Creek is served by Met Ed, not PPL. "Electric companies should be required to demonstrate a meaningful benefit to the area. The area shouild not have to pay more in cost than received in benifit just so the grid can be maintained somewhere else," testified Pike County Commissioner Harry Forbes.

Lehman Township Supervisor John Sivick echoed that. "The demand for electricity has gone down. It is not needed. PPL is not concerned about the cost because they will pass the cost on to the 13 states," Sivick said.

At the second hearing of the day, state Rep. John Siptroth, D-189, read a statement that was interrupted by applause several times. Siptroth questioned how thoroughly the other proposed routes were considered and also warned of setting an alarming precedent, smoothing the way for more extremely high-voltage lines across the nation.

"I anticipate that this is not the last time that a public hearing will be taking place in eastern Pennsylvania to review an application for a high-voltage transmission line passing through our communities to serve consumers in New York and New Jersey," Siptroth said in a statement released to the Pocono Record.

"If the Federal Energy Regulatory Commission and Congress get its way, there may be many more projects like this, but probably fewer hearings as a result of their increased authority and powers of eminent domain.

"I note with alarm that the Solar Energy Industries Association and the American Wind Energy Association have begun to call for "Green Power Superhighways" with as many as six parallel lines of towers linking energy generators to the west of us with energy consumers to the east of us. I would like to see the PUC taking a leading role in advocating for the placement of extremely high-voltage transmission lines underground starting with the Susquehanna-Roseland project being commented on today," Siptroth said.

"I believe that Pennsylvania should take the lead on this technology, and because Pennsylvania is likely to be impacted by many future proposals like PPL's, it is in the best interest of our state," he said.

Related News

Electric shock: China power demand drops as coronavirus shutters plants

China Industrial Power Demand 2020 highlights COVID-19 disruption to electricity consumption as factory output stalls; IHS Markit estimates losses equal to Chile's usage, impacting thermal coal, LNG, and Hubei's industrial load.


Key Points

An analysis of COVID-19's hit to China's electricity use, cutting industry demand and fuel needs for coal and LNG.

✅ 73 billion kWh loss equals Chile's annual power use

✅ Cuts translate to 30m tonnes coal or 9m tonnes LNG

✅ Hubei peak load 21 percent below plan amid shutdowns


China’s industrial power demand in 2020 may decline by as much as 73 billion kilowatt hours (kWh), according to IHS Markit, as the outbreak of the coronavirus has curtailed factory output and prevented some workers from returning to their jobs.

FILE PHOTO: Smoke is seen from a cooling tower of a China Energy ultra-low emission coal-fired power plant during a media tour, in Sanhe, Hebei province, China July 18, 2019. REUTERS/Shivani Singh
The cut represents about 1.5% of industrial power consumption in China. But, as the country is the world’s biggest electricity consumer and analyses of China's electricity appetite routinely underscore its scale, the loss is equal to the power used in the whole of Chile and it illustrates the scope of the disruption caused by the outbreak.

The reduction is the energy equivalent of about 30 million tonnes of thermal coal, at a time when China aims to reduce coal power production, or about 9 million tonnes of liquefied natural gas (LNG), IHS said. The coal figure is more than China’s average monthly imports last year while the LNG figure is a little more than one month of imports, based on customs data.

China has tried to curtail the spread of the coronavirus that has killed more than 1,400 and infected over 60,000 by extending the Lunar New Year holiday for an extra week and encouraging people to work from home, measures that contributed to a global dip in electricity demand as well.

Last year, industrial users consumed 4.85 trillion kWh electricity, accounting for 67% of the country’s total, even as India's electricity demand showed sharp declines in the region.

Xizhou Zhou, the global head of power and Renewables at IHS Markit, said that in a severe case where the epidemic goes on past March, China’s economic growth will be only 4.2% during 2020, down from an initial forecast of 5.8%, while power consumption will climb by only 3.1%, down from 4.1% initially, even as power cuts and blackouts raise concerns.

“The main uncertainty is still how fast the virus will be brought under control,” said Zhou, adding that the impact on the power sector will be relatively modest from a full-year picture in 2020, even though China's electric power woes are already clouding solar markets.

In Hubei province, the epicenter of the virus outbreak, the peak power load at the end of January was 21% less than planned, mirroring how Japan's power demand was hit during the outbreak, data from Wood Mackenzie showed.

Industrial operating rates point to a firm reduction in power consumption in China.

Utilization rates at plastic processors are between 30% and 60% and the low levels are expected to last for another two week, according to ICIS China.

Weaving machines at textile plants are operating at below 10% of capacity, the lowest in five years, ICIS data showed. China is the world’s biggest textile and garment exporter.


Related News

View more

Bomb Cyclone Leaves Half a Million Without Power in Western Washington

Western Washington Bomb Cyclone unleashed gale-force winds, torrential rain, and coastal flooding, causing massive power outages from Seattle to Tacoma; storm surge, downed trees, and blocked roads hindered emergency response and infrastructure repairs.


Key Points

A rapidly deepening storm with severe winds, rain, flooding, and major power outages across Western Washington.

✅ Rapid barometric pressure drop intensified the system

✅ Gale-force winds downed trees and power lines

✅ Coastal flooding and storm surge disrupted transport


A powerful "bomb cyclone" recently hit Western Washington, causing widespread destruction across the region. The intense storm left more than half a million residents without power, similar to B.C. bomb cyclone outages seen to the north, with outages affecting communities from Seattle to Olympia. This weather phenomenon, marked by a rapid drop in atmospheric pressure, unleashed severe wind gusts, heavy rain, and flooding, causing significant disruption to daily life.

The bomb cyclone, which is a rapidly intensifying storm, typically features a sharp drop in barometric pressure over a short period of time. This creates extreme weather conditions, including gale-force winds, torrential rain, and coastal flooding, as seen during California storm impacts earlier in the season. In Western Washington, the storm struck just as the region was beginning to prepare for the winter season, catching many off guard with its strength and unpredictability.

The storm's impact was immediately felt as high winds downed trees, power lines, and other infrastructure. By the time the worst of the storm had passed, utility companies had reported widespread power outages, with more than 500,000 customers losing electricity. The outages were particularly severe in areas like Seattle, Tacoma, and the surrounding communities. Crews worked tirelessly in difficult conditions to restore power, but many residents faced extended outages, underscoring US grid climate vulnerabilities that complicate recovery efforts, with some lasting for days due to the scope of the damage.

The power outages were accompanied by heavy rainfall, leading to localized flooding. Roads were inundated, making it difficult for first responders and repair crews to reach affected areas. Emergency services were stretched thin as they dealt with downed trees, blocked roads, and flooded neighborhoods. In some areas, floodwaters reached homes, forcing people to evacuate. In addition, several schools were closed, and public transportation services were temporarily halted, leaving commuters stranded and businesses unable to operate.

As the storm moved inland, its effects continued to be felt. Western Washington’s coastal regions were hammered by high waves and storm surges, further exacerbating the damage. The combination of wind and rain also led to hazardous driving conditions, prompting authorities to advise people to stay off the roads unless absolutely necessary.

While power companies worked around the clock to restore electricity, informed by grid resilience strategies that could help utilities prepare for future events, challenges persisted. Fallen trees and debris blocked access to repair sites, and the sheer number of outages made it difficult for crews to restore power quickly. Some customers were left in the dark for days, forced to rely on generators, candles, and other makeshift solutions. The storm's intensity left a trail of destruction, requiring significant resources to address the damages and rebuild critical infrastructure.

In addition to the immediate impacts on power and transportation, the bomb cyclone raised important concerns about climate change and the increasing frequency of extreme weather events. Experts note that storms like these are becoming more common, with rapid intensification leading to more severe consequences and compounding pressures such as extreme-heat electricity costs for households. As the planet warms, scientists predict that such weather systems will continue to grow in strength, posing greater challenges to cities and regions that are not always prepared for such extreme events.

In the aftermath of the storm, local governments and utility companies faced the daunting task of not only restoring services but also assessing the broader impact of the storm on communities. Many areas, especially those hit hardest by flooding and power outages, will require substantial recovery efforts. The devastation of the bomb cyclone highlighted the vulnerability of infrastructure in the face of rapidly changing weather patterns and water availability, as seen in BC Hydro drought adaptations nearby, and reinforced the need for greater resilience in the face of future storms.

The storm's impact on the Pacific Northwest is a reminder of the power of nature and the importance of preparedness. As Western Washington recovers, there is a renewed focus on strengthening infrastructure, including expanded renewable electricity to diversify supply, improving emergency response systems, and ensuring that communities are better equipped to handle the challenges posed by increasingly severe weather events. For now, residents remain hopeful that the worst is behind them and are working together to rebuild and prepare for whatever future storms may bring.

The bomb cyclone has left an indelible mark on Western Washington, but it also serves as a call to action for better preparedness, more robust infrastructure, and a greater focus on combating climate change to mitigate the impact of such extreme weather in the future.


Related News

View more

Clean, affordable electricity should be an issue in the Ontario election

Ontario Electricity Supply Gap threatens growth as demand from EVs, heat pumps, industry, and greenhouses surges, pressuring the grid and IESO to add nuclear, renewables, storage, transmission, and imports while meeting net-zero goals.


Key Points

The mismatch as Ontario's electricity demand outpaces supply, driven by electrification, EVs, and industrial growth.

✅ Demand growth from EVs, heat pumps, and electrified industry

✅ Capacity loss from Pickering retirement and Darlington refurb

✅ Options: SMRs, renewables, storage, conservation, imports


Ontario electricity demand is forecast to soon outstrip supply as it confronts a shortage in the coming years, a problem that needs attention in the upcoming provincial election.

Forecasters say Ontario will need to double its power supply by 2050 as industries ramp up demand for low-emission clean power options and consumers switch to electric vehicles and space heating. But while the Ford government has made a flurry of recent energy announcements, including a hydrogen project at Niagara Falls and an interprovincial agreement on small nuclear reactors, it has not laid out how it intends to bulk up the province’s power supply.

“Ontario is entering a period of widening electricity shortfalls,” says the Ontario Chamber of Commerce. “Having a plan to address those shortfalls is essential to ensure businesses can continue investing and growing in Ontario with confidence.”

The supply and demand mismatch is coming because of brisk economic growth combined with increasing electrification to balance demand and emissions and meet Canada’s goal to reduce CO2 emissions by 40 per cent by 2030 and to net-zero by 2050.

Hamilton’s ArcelorMittal Dofasco and Algoma Steel in Sault Ste. Marie are leaders on this transformation. They plan to replace their blast furnaces and basic oxygen furnaces later this decade with electric arc furnaces (EAFs), reducing annual CO2 emissions by three million tonnes each.


Dofasco, which operates an EAF that is already the single largest electricity user in Ontario, plans to build a second EAF and a gas-fired ironmaking furnace, which can also be powered with zero-carbon hydrogen produced from electricity, once it becomes available.

Other new projects in the agriculture, mining and manufacturing sectors are also expected to be big power users, including the recently announced $5 billion Stellantis-LG electric vehicle battery plant in Windsor. Five new transmission lines will be built to service the plant and the burgeoning greenhouse industry in southwestern Ontario. The greenhouses alone will require enough additional electricity to power a city the size of Ottawa.

On top of these demands, growing numbers of Ontario drivers are expected to switch to electric vehicles and many homeowners and business owners are expected to convert from gas heating to heat pumps and electric heating.

Ontario is recognized as one of the cleanest electricity systems in the world, with over 90 per cent of its capacity from low-emission nuclear, hydro, wind and other renewable generation. Only nine per cent comes from CO2-emitting gas plants. But that’s about to get dirtier according to analysts.

Annual electricity demand is expected to grow from 140 terawatt hours (a terawatt hour is one trillion watts for one hour) currently to about 200 terawatt hours in 2042, according to the Independent Electricity System Operator, the agency that manages Ontario’s grid.

Demand is expected to outstrip currently contracted supply in 2026, reaching a growing supply gap of about 80 terawatt hours by 2042. A big part of this gap is due to the scheduled retirement of the Pickering nuclear station in 2025 and the current refurbishment of the Darlington nuclear station reactors. While the IESO doesn’t expect blackouts or brownouts, it forecasts the province will need to sharply increase expensive power imports and triple the amount of CO2-polluting gas-fired generation.

Without cleaner, lower-cost alternatives, this will mean “a vastly dirtier and more expensive electricity system,” York University researchers Mark Winfield and Collen Kaiser said in a recent commentary.

The party that wins the provincial election will have to make hard decisions on renewable energy, including new wind and solar projects, energy conservation, battery storage, new hydro plants, small nuclear reactors, gas generation and power imports from the U.S. and Quebec. In addition, the federal government is pressing the provinces to meet a new net-zero clean electricity standard by 2035. These decisions will have huge impact on Ontario’s future, with greening the grid costs highlighted in some reports as potentially very high.

With so much at stake, Ontario’s political parties need to tell voters during the upcoming campaign how they would address these enormous challenges.


Related News

View more

U.S. Electricity Sales Projections Continue to Fall

US Electricity Demand Outlook examines EIA forecasts, GDP decoupling, energy efficiency, electrification, electric vehicles, grid load growth, and weather variability to frame long term demand trends and utility planning scenarios.


Key Points

An analysis of EIA projections showing demand decoupling from GDP, with EV adoption and efficiency shaping future grid load.

✅ EIA lowers load growth; demand decouples from GDP.

✅ Efficiency and sector shifts depress kWh sales.

✅ EV adoption could revive load and capacity needs.


Electricity producers and distributors are in an unusual business. The product they provide is available to all customers instantaneously, literally at the flip of a switch. But the large amount of equipment, both hardware and software to do this takes years to design, site and install.

From a long range planning perspective, just as important as a good engineering design is an accurate sales projections. For the US electric utility industry the most authoritative electricity demand projec-tions come from the Department of Energy’s Energy Information Administration (EIA). EIA's compre-hensive reports combine econometric analysis with judgment calls on social and economic trends like the adoption rate of new technologies that could affect future electricity demand, things like LED light-ing and battery powered cars, and the rise of renewables overtaking coal in generation.

Before the Great Recession almost a decade ago, the EIA projected annual growth in US electricity production at roughly 1.5 percent per year. After the Great Recession began, the EIA lowered its projections of US electricity consumption growth to below 1 percent. Actual growth has been closer to zero. While the EIA did not antici-pate the last recession or its aftermath, we cannot fault them on that.

After the event, though, the EIA also trimmed its estimates of economic growth. For the 2015-2030 period it now predicts 2.1 percent economic and 0.3 percent electricity growth, down from previously projections of 2.7 percent and 1.3 percent respectively. (See Figures 1 and 2.)


Table 1. EIA electric generation projections by year of forecast (kWh billions)


Table 2. EIA forecast of GDP by year of forecast (billion 2009 $)

Back in 2007, the EIA figured that every one percent increase in economic activity required a 0.48 percent in-crease in electric generation to support it. By 2017, the EIA calculated that a 1 percent growth in economic activity now only required a 0.14 percent increase in electric output. What accounts for such a downgrade or disconnect between electricity usage and economic growth? And what factors might turn the numbers 
around?

First, the US economy lost energy intensive heavy industry like smelting, steel mills and refineries; patterns in China's electricity sector highlight how industrial shifts can reshape power demand. A more service oriented economy (think health care) relies more heavily on the movement of data or information and uses far less power than a manufacturing-oriented economy.

A small volcano in Argentina is about to fuel the next tech boom – and a little known company is going to be right at the center. Early investors stand to gain incredible profits and you can too. Read the report.

Second, internet shopping has hurt so-called "brick and mortar" retailers. Despite the departure of heavy industry, in years past a burgeoning US commercial sector increased its demand and usage of electricity to offset the industrial decline. But not anymore. Energy efficiency measures as well as per-haps greater concern about global warming and greenhouse gas emissions and have cut into electricity sales. “Do more with less” has the right ring to it.

But there may be other components to the ongoing decline in electricity usage. Academic studies show that electricity usage seems to increase with income along an S curve, and flattens out after a certain income level. That is, if you earn $1 billion per year you do not (or cannot) use ten times a much electricity as someone earning only $100 million.

But people at typical, middle income levels increase or decrease electricity usage when incomes rise or fall. The squeeze on middle income families was discussed often in the late presidential campaign. In recent decades an increasing percentage of income has gone to a small percentage of the population at the top of the income scale. This trend probably accounts for some weakness in residential sales. This suggests that government policy addressing income inequality would also boost electricity sales.

Population growth affects demand for electricity as well as the economy as a whole. The EIA has made few changes in its projections, showing 0.7 percent per year population growth in 2015- 2030 in both the 2007 and 2017 forecasts. Recent studies, however, have shown a drop in the birth rate to record lows. More troubling, from a national health perspective is that the average age of death may have stopped rising. Those two factors point to lower population growth, especially if the government also restricts immi-gration. Thus, the US may be approaching a period of rather modest population growth.

All of the above factors point to minimal sales growth for electricity producers in the US--perhaps even lower than the seemingly conservative EIA estimates. But the cloud on the horizon has a silver lining in the shape of an electric car. Both the United Kingdom and France have set dates to end of production of automobiles with internal combustion engines. Several European car makers have declared that 20 percent of their output will be electric vehicles by the early 2020s. If we adopt automobiles powered by electricity and not gasoline or diesel, electricity sales would increase by one third. For the power indus-try, electric vehicles represent the next big thing.

We don’t pretend to know how electric car sales will progress. But assume vehicle turnover rates re-main at the current 7 percent per year and electric cars account for 5 percent of sales in the first five years (as op-posed to 1 percent now), 20 percent in the next five years and 50 percent in the third five year period. Wildly optimistic assumptions? Maybe. By 2030, electric cars would constitute 28 percent of the vehicle fleet. They would add about 10 percent to kilowatt hour sales by that date, assuming that battery efficiencies do not improved by then. Those added sales would require increased electric generation output, with low-emissions sources expected to cover almost all the growth globally. They would also raise long term growth rates for 2015-2030 from the present 0.3 percent to 1.0 percent. The slow upturn in demand should give the electric companies time to gear up so to speak.

In the meantime, weather will continue to play a big role in electricity consumption. Record heat-induced demand peaks are being set here in the US even as surging global demand puts power systems under strain worldwide.

Can we discern a pattern in weather conditions 15 years out? Maybe we can, but that is one topic we don’t expect a government agency to tackle in public right now. Meantime, weather will affect sales more than anything else and we cannot predict the weather. Or can we?


Related News

View more

Toronto Cleans Up After Severe Flooding

Toronto Flood Cleanup details the citywide response to storm damage after heavy rain, stressing drainage system upgrades, emergency services, transit disruptions, infrastructure repair, financial aid, insurance claims, and climate resilience planning for future weather.


Key Points

Toronto Flood Cleanup is the city's flood response, restoring infrastructure, aiding residents, and upgrading drainage.

✅ Emergency services and public works lead debris removal.

✅ Repairs to roads, bridges, transit, and utilities underway.

✅ Aid, insurance claims, and drainage upgrades prioritized.


Toronto is grappling with significant cleanup efforts following severe storms that unleashed heavy rains and caused widespread flooding across the city. The storms, which hit the area over the past week, have left a trail of damage and disruption, prompting both immediate response measures and longer-term recovery plans.

The intense rainfall began with a powerful storm system that moved through southern Ontario, with Sudbury Hydro crews working to reconnect service as the system pressed toward the GTA, delivering an unprecedented volume of water in a short period. The resulting downpours overwhelmed the city's drainage systems, leading to severe flooding in multiple neighborhoods. Streets, basements, and parks were inundated, with many areas experiencing water levels not seen in recent memory.

Emergency services were quickly mobilized to address the immediate impact of the floods. Toronto’s Fire Services, along with other first responders and skilled utility teams, as Ontario recently sent 200 workers to Florida to help restore power, were deployed to assist residents affected by the rising waters. Rescue operations were carried out to help people trapped in their homes or vehicles, and temporary shelters were set up for those displaced by the flooding.

The storm's impact was felt across various sectors of the city. Public transportation services were disrupted, as strong gusts led to significant power outages in parts of the region, with numerous subway stations and bus routes affected by the high water levels. Major roads were closed due to flooding, causing significant traffic delays and affecting daily commutes for many residents. Local businesses also faced challenges, with some forced to close their doors as a result of the water damage.

The city's infrastructure bore the brunt of the storm's fury. Several key infrastructure components, including roads, bridges, and utilities, suffered damage. The city's water treatment plants and sewage systems were stressed by the volume of water, raising concerns about potential contamination and the need for extensive maintenance and repair work.

In the wake of the flooding, the Toronto Municipal Government has launched a comprehensive cleanup and recovery effort. The city's Public Works Department is spearheading the operation, focusing on clearing debris, repairing damaged infrastructure, and restoring essential services, as Hydro One crews restore power to hundreds of thousands across Ontario. Teams of workers are diligently addressing the damage to roads and bridges, ensuring that they are safe for use and functioning properly.

Efforts are also underway to assist residents and businesses affected by the flooding. Financial aid and support programs are being implemented to help those who have suffered property damage or loss, including customers affected by Toronto power outages as repairs continue. The city is working closely with insurance companies to facilitate claims and provide relief to those in need.

In addition to the immediate cleanup, there is a heightened focus on evaluating and improving the city's flood management systems. The recent storms have highlighted vulnerabilities in Toronto’s infrastructure, prompting calls for enhanced flood prevention measures. City officials and urban planners are assessing the current drainage systems and exploring ways to bolster their capacity to handle future extreme weather events.

The storms have also sparked discussions about the broader implications of climate change and its impact on urban areas. Experts suggest that increasingly severe weather events, including heavy rainfall and flooding, may become more common, as seen with Houston's extended power outage after severe storms, as global temperatures rise. This has led to a call for more resilient and adaptable infrastructure to better withstand such events.

Community organizations and volunteers have played a vital role in the recovery process. Local groups have come together to support their neighbors, providing assistance with cleanup efforts, distributing supplies, and offering emotional support to those affected by the disaster. Their contributions underscore the importance of community solidarity in times of crisis.

As Toronto works towards recovery, there is a clear recognition of the need for a comprehensive strategy to address both the immediate and long-term challenges posed by severe weather events. The city’s response will involve not only repairing the damage caused by this storm but also investing in infrastructure improvements, drawing lessons from London power outage disruption cases to harden critical systems, and adopting measures to mitigate the impact of future floods.

In summary, the severe storms that recently struck Toronto have led to widespread flooding and significant disruption across the city. The immediate response has involved extensive cleanup efforts, damage assessment, and support for affected residents and businesses. Looking ahead, Toronto faces the challenge of enhancing its flood management systems and preparing for the potential impacts of climate change. The collective efforts of emergency services, city officials, and community members will be crucial in ensuring a swift recovery and building resilience against future storms.


Related News

View more

As peak wildfire season nears, SDG&E completes work on microgrid in Ramona

SDG&E Ramona Microgrid delivers renewable energy and battery storage for wildfire mitigation, grid resilience, and PSPS support, powering the Cal Fire Air Attack Base with a 500 kW, 2,000 kWh lithium-ion system during outages.


Key Points

A renewable, battery-backed microgrid powering Ramona's Air Attack Base, boosting wildfire response and PSPS resilience.

✅ 500 kW, 2,000 kWh lithium-ion storage replaces diesel

✅ Keeps Cal Fire and USFS aircraft operations powered

✅ Supports PSPS continuity and rural water reliability


It figures to be another dry year — with the potential to spark wildfires in the region. But San Diego Gas & Electric just completed a renewable energy upgrade to a microgrid in Ramona that will help firefighters and reduce the effects of power shutoffs to backcountry residents.

The microgrid will provide backup power to the Ramona Air Attack Base, helping keep the lights on during outages, home to Cal Fire and the U.S. Forest Service's fleet of aircrafts that can quickly douse fires before they get out of hand.

"It gives us peace of mind to have backup power for a critical facility like the Ramona Air Attack Base, especially given the fact that fire season in California has become year-round," Cal Fire/San Diego County Fire Chief Tony Mecham said in a statement.

The air attack base serves as a hub for fixed-wing aircraft assigned to put out fires. Cal Fire staffs the base throughout the year with one two airtankers and one tactical aircraft. The base also houses the Forest Service's Bell 205 A++ helicopter and crew to protect the Cleveland National Forest. Aircraft for both CalFire and the Forest Service can also be mobilized to help fight fires throughout the state.

This summer, the Ramona microgrid won't have to rely on diesel generation. Instead, the facility next to the town's airport will be powered by a 500 kilowatt and 2,000 kilowatt-hour lithium-ion battery storage system that won't generate any greenhouse gas emissions.

"What's great about it, besides that it's a renewable resource, is that it's a permanent installation," said Jonathan Woldemariam, SDG&E's director of wildfire mitigation and vegetation management. "In other words, we don't have to roll a portable generator out there. It's something that can be leveraged right there because it's already installed and ready to go."

Microgrids have taken on a larger profile across the state because they can operate independently of the larger electric grid, where repairing California's grid is an ongoing challenge, thus allowing small areas or communities to keep the power flowing for hours at a time during emergencies.

That can be crucial in wildfire-prone areas affected by Public Safety Power Shutoffs, or PSPS, the practice in which investor-owned utilities in California de-energize electrical power lines in a defined area when conditions are dry and windy in order to reduce the risk of a power line falling and igniting a wildfire, while power grid upgrades move forward statewide.

Rural and backcountry communities are particularly hard hit when the power is pre-emptively cut off because many homes rely on water from wells powered by electricity for their homes, horses and livestock.

In addition to Ramona, SDG&E has established microgrids in three other areas in High Fire Threat Districts:

The microgrids in Butterfield Ranch and Shelter Valley run on diesel power but the utility plans to complete solar and battery storage systems for each locale by the end of next year, as other regions develop new microgrid rules to guide deployment.

SDG&E has a fifth microgrid in operation — in Borrego Springs, which in 2013 became the first utility-scale microgrid in the country. It provides grid resiliency to the roughly 2,700 residents of the desert town and serves as a model for integrated microgrid projects elsewhere in delivering local electricity. While the Borrego Springs microgrid is not located in a High Fire Threat District, "when and if any power is turned off, especially the power transmission feed that goes to Borrego, we can support the customers using the microgrid out there," Woldemariam said.

Microgrid costs can be higher than conventional energy systems, even as projected energy storage revenue grows over the next decade, and the costs of the SDG&E projects are passed on to ratepayers. As per California Public Utilities Commission rules, the financial details for each of microgrid are kept confidential for at least three years.

SDG&E's microgrids are part of the utility's larger plan to reduce wildfire risk that SDG&E files with the utilities commission. In its wildfire plan for 2020 through 2022, SDG&E expected to spend $1.89 billion on mitigation measures.


Related News

View more

Sign Up for Electricity Forum’s Newsletter

Stay informed with our FREE Newsletter — get the latest news, breakthrough technologies, and expert insights, delivered straight to your inbox.

Electricity Today T&D Magazine Subscribe for FREE

Stay informed with the latest T&D policies and technologies.
  • Timely insights from industry experts
  • Practical solutions T&D engineers
  • Free access to every issue

Download the 2025 Electrical Training Catalog

Explore 50+ live, expert-led electrical training courses –

  • Interactive
  • Flexible
  • CEU-cerified