Tucson Electric Power Coal Phaseout advances an Integrated Resource Plan to exit Springerville coal by 2032, lift renewables past 70 percent by 2035, add wind, solar, battery storage, and cut carbon emissions 80 percent.
Key Points
A 2032 coal exit and 2035 plan to lift renewables above 70 percent, add wind, solar, storage, and cut CO2 80 percent.
✅ Coal purchases end at Springerville units by 2032
✅ Renewables exceed 70 percent of load by 2035
✅ 80 percent CO2 cut from 2005 baseline via wind, solar, storage
In a dramatic policy shift, Tucson Electric Power says it will stop using coal to generate electricity by 2032 and will increase renewable energy's share of its energy load to more than 70% by 2035.
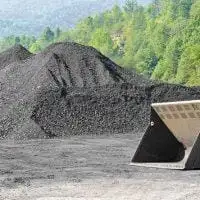
As part of that change, the utility will stop buying electricity from its two units at its coal-fired Springerville Generating Station by 2032. The plant, TEP's biggest power source, provides about 35% of its energy.
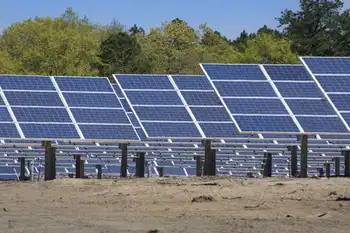
The utility already had planned to start up two New Mexico wind farms and a solar storage plant in the Tucson area by next year. The new plan calls for adding an additional 2,000 megawatts of renewable energy capacity by 2035.
The utility's switch from fossil fuels is spelled out in the plan, submitted to the Arizona Corporation Commission, amid shifts in federal power plant rules that could affect implementation. Called an Integrated Resource Plan, it would reduce TEP's carbon dioxide emissions 80% by 2035 compared with 2005 levels.
The plan drew generally positive reviews from a number of environmentalists and other representatives of an advisory committee that had worked with TEP for a year.
Two commissioners, Chairman Bob Burns and Tucsonan Lea Marquez Peterson, also generally praised the plan, although they held off on final judgment.
University of Arizona researchers said the plan would likely meet the utility's share of the worldwide goal of holding down global temperatures to less than 2 degrees Celsius, or about 3.6 degrees Fahrenheit, above pre-industrial levels, even as studies find that climate change threatens grid reliability in many regions.
But a representative of AARP and the Pima Council on Aging expressed concern because the plan would require 1% annual electric rate increases a year to put into effect.
Officials in the eastern Arizona town of Springerville aren't happy.
And Sierra Club official Sandy Bahr said the plan doesn't move fast enough to get TEP off coal. She listed 14 separate units of various Western coal-fired plants that are scheduled to shut down sooner than 2032, many in the 2020s.
But TEP says the plan best balances costs and environmental benefits compared with 24 others it reviewed.
"We know our customers want safe, reliable energy from resources that are both affordable and environmentally responsible. TEP's 2020 Integrated Resource Plan will help us maintain that delicate balance," TEP CEO David Hutchens wrote in the forward to the plan.
The plan isn't legally binding but is aimed at sending a signal to regulators and the public about TEP's future direction. TEP and other regulated Arizona utilities update such plans every three years.
TEP has been one of the West's more fossil-fuel-friendly utilities. It stuck with coal even as many other utilities were moving away from it, including Alliant Energy's carbon-neutral plan to cut emissions and costs, and as the Sierra Club called on utilities to move beyond what it termed a highly polluting energy source that emits large quantities of heat-trapping greenhouse gases linked by scientists to global warming.
Last year, TEP got 13% of its electricity from renewables such as wind farms and solar plants along with photovoltaic solar panels atop individual homes. Fossil fuels coal and natural gas supplied the rest, a University of Arizona study paid for by TEP found.
Economics, not just emissions, a big factor
TEP's previous resource plan, from 2017, called for boosting renewable use to 30% by 2030 and to cut coal to 38% of its electric load by then from 69% in 2017, reflecting broader 2017 utility trends across the industry.
A TEP official said last week the utility is heading in a different direction not only due to concerns about greenhouse gas emissions but because of changing economics.
"For the last several decades, coal was the most economical resource. It was the lowest-cost resource to supply energy for our customers, and it wasn't really close," said Jeff Yockey, TEP's resource planning director.
But over the past few years, first natural gas prices and more recently solar and wind energy prices have fallen dramatically, he said.
Their prices are projected to keep falling, along with the cost of battery-fueled storage of solar energy for use when the sun is down, he said.
"Coal just isn't the most economical resource" now, Yockey said.
Yet the utility still needs, for now, the extra energy capacity that coal provides, he said, even as other states outline ways to improve grid reliability through targeted investments.
"Being a utility with no nuclear or hydro(electric) energy, with coal, there is reliability, a fuel on the ground, 30 or 90 days supply," he said. "It's the only source not subject to disruption in the next hour. It's our only long-term, stable fuel supply. Over time, we will be able to overcome that."
UA researchers, community panel worked on plan
TEP paid the UA $100,000 to have three researchers prepare two reports, one comparing 24 different proposals and a second comparing TEP's fossil fuel/renewable split with those of other utilities.
Also, the utility appointed an advisory council representing environmental, business and government interests that met regularly to guide TEP in producing the plan. The utility chose a preferred energy "portfolio," Yockey said.
The goal "was very much about basically achieving significant emissions reductions as quickly as we can and as cost effectively as we can," he said. TEP wanted the biggest cumulative emission cut possible over 15 years.
"If it was just about cost, we wouldn't have selected the portfolio that we selected. It wasn't the lowest cost portfolio."
UA assistant research professors Ben McMahan and Will Holmgren said combined carbon dioxide emission reductions from TEP's new plan over 15 years would be expected to hit the Paris accord's 2-degree target.
"There is considerable uncertainty about what will happen between now and 2050, but the preferred portfolio's early start on reductions and lowest cumulative emissions is certainly a positive sign that well below 2C is achievable," the researchers said in an email.
Environmentalists pleased, but some want coal cut sooner
The Sierra Club, Western Resource Advocates, the Southwest Energy Efficiency Project and Pima County offered varying degrees of praise for the new TEP plan.
In a memo Friday, County Administrator Chuck Huckelberry congratulated TEP for "the comprehensive, inclusive and transparent process" used to develop the plan.
Because of UA's involvement, TEP's advisory council and the public "can feel confident that the utility is on track to make significant progress in curbing greenhouse gas emissions to combat climate change," Huckelberry wrote.
The TEP plan "is the most aggressive commitment to reducing emissions by a utility in Arizona," said Autumn Johnson of Western Resource Advocates in a news release.
"Adding clean energy generation and storage while accelerating the retirement of coal units will ensure a healthier and better future for Arizonans," said Johnson, an energy policy analyst in Phoenix.
The Sierra Club will have a technical expert review the plan and already wants more energy savings, said Bahr, director of the group's Grand Canyon chapter. But overall, this plan is a step in the right direction for TEP, she said.
By comparison, Arizona Public Service's new resource plan only calls for 45% renewable energy by 2030, Bahr noted, while California regulators consider more power plants to ensure reliability. APS committed to going coal-free by 2031.
A Sierra Club proposal that the UA reviewed called for TEP to quit coal by 2027.
But TEP analyzed that proposal and concluded it would require $300 million in investments and would reduce the utility's cumulative emissions by only 2.4 million tons, to 70.2 million tons by 2035, Yockey said.
The Sierra Club plan was the most expensive portfolio investigated, Yockey said.
"The difference is in the timing. We still have a fair amount of value in our coal plants which we need to depreciate, which we do over time," Yockey said. "Trying to replace the capacity that coal provides in the near term with storage and solar is very expensive, although those costs are declining."
Seniors on fixed incomes could be hurt, advocate says
Rene Pina, an advisory council member representing two senior citizen organizations, praised the plan's goals but was concerned about impacts of even 1% annual rate increases on elderly people on fixed incomes.
They can't always handle such an increase, he said.
One possible fix is that TEP could ease eligibility requirements for its low-income energy assistance program, aligning with equity-focused electricity regulation principles, to allow more seniors to benefit, said Pina, representing AARP and the Pima Council on Aging.
"The program is structured so it just barely disqualifies most of our seniors. Their social security pension is just barely over the low-income limit. It can easily be adjusted without any problems to the utility," Pina said.
Advisory council member Rob Lamb, an engineer with GHLN, an architecture-engineering firm, said he was very pleased with TEP's plan.
"One of the things a lot of people don't realize when they put together a plan like that, is they have to balance environment with 'Hey, what's the reliability of service? Are we going to be able to keep our rates for something that will work?'" Lamb said.
"This a very balanced and resilient portfolio."
Related News