Window closing on carbon-capture plan

By Toronto Star


Protective Relay Training - Basic

Our customized live online or in‑person group training can be delivered to your staff at your location.

  • Live Online
  • 12 hours Instructor-led
  • Group Training Available
Regular Price:
$699
Coupon Price:
$599
Reserve Your Seat Today
The International Energy Agency says countries aren't doing enough to develop and deploy systems that capture and store carbon dioxide emissions from power plants, even though such technologies are considered crucial in the battle against climate change.

Only four full-scale carbon-capture and storage projects are in operation around the world today, it said, and none of them involve coal-fired power plants, which are expected to remain a major source of greenhouse gas emissions in the coming decades.

Nobuo Tanaka, executive director of the energy agency, put it bluntly: "The window of opportunity is closing."

In Canada, Alberta and Saskatchewan are taking the lead on carbon capture and storage research, and while a handful of initiatives have been announced or are under discussion, even the most advanced project is seven years away, at best.

Meanwhile, G8 countries have said they will commit by 2010 to 20 large-scale demonstration projects with the goal of broad deployment by 2020. But rising costs, insufficient financing and a lack of regulatory support have created barriers to action and even led to some projects being cancelled.

"Current spending and activity levels are nowhere near enough to achieve these deployment goals," according to an agency report released yesterday at a conference in Paris. "If these demonstration projects do not materialize in the near future, it will be impossible for (the technology) to make any meaningful contribution to greenhouse-gas mitigation efforts by 2030."

Denise Heckbert, an energy analyst with New Energy Finance in London, said that where the Canadian government has fallen short with an investment of just $240 million toward a $1.4 billion "clean coal" project in Saskatchewan, the Alberta government is picking up the slack.

In July, Alberta Premier Ed Stelmach announced his government would devote $2 billion from budget surpluses this year toward major carbon capture and storage projects in the province. Most of those projects, however, are related to the capture of CO2 from oil-sands operations. The gas is liquefied and pumped underground as a way to extract even more oil.

"I think Canada is meeting its commitments through Alberta," said Heckbert, adding that this assumes the dramatic plunge in oil prices doesn't derail Stelmach's plan. "We'll have to see."

Capturing CO2 from coal-fired power plants, also known as "clean coal," is trickier because it requires a way to scrub the gas out of emissions, or remove it before combustion, so it can be collected in a concentrated form. It must then be transported through a pipeline to a geological formation, like a depleted oil field or a deep saline aquifer.

All of this is costly and untested, says the National Energy Board, which estimates that Canada's coal reserves are equivalent to its oil reserves. Currently about 13 per cent of power generation in the country comes from coal, but that number is expected to fall because of concerns over emissions.

Ontario, unlike Alberta and Saskatchewan, has decided to simply stop using coal instead of putting its faith in carbon-capture technology.

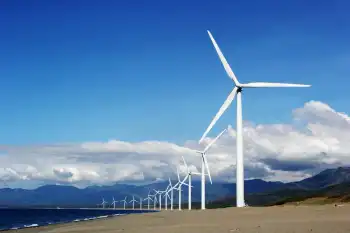
The need to move more quickly on climate change has the wind industry competing with fossil fuels for government support. The Canadian Wind Energy Association released its latest roadmap, which argues that the country "must ensure" wind energy supplies 20 per cent of national electricity demand by 2025.

Such a commitment, it said, would lead to $79 billion in investment, create 52,000 full-time jobs, and generate $165 million in annual revenues for Canadian municipalities. "What we now need is government to step up and come to the table with a regulatory environment that streamlines and aids the development process," said Robert Hornung, president of the association.

Heckbert said the plan for wind is ambitious and would require major investments in new power transmission and storage technologies. It's an investment the federal government might have made had Liberal leader Stéphane Dion, who announced plans to resign, won the election.

The re-election of Prime Minister Stephen Harper, Heckbert said, was "certainly a setback for emissions control" in Canada and puts more responsibility now on the provinces to act.

Related News

Residential electricity use -- and bills -- on the rise thanks to more working from home

Work From Home Energy Consumption is driving higher electricity bills as residential usage rises. Smart meter data, ISO-New-England trends, and COVID-19 telecommuting show stronger power demand and sensitivity to utility rates across regions.


Key Points

Higher household electricity use from telecommuting, shifting load to residences and raising utility bills.

✅ Smart meters show 5-22 percent residential usage increases.

✅ Commercial demand fell as home cooling and IT loads rose.

✅ Utility rates and AC use drive bill spikes during summer.


Don't be surprised if your electric bills are looking higher than usual, with a sizable increase in the amount of power that you have used.

Summer traditionally is a peak period for electricity usage because of folks' need to run fans and air-conditioners to cool their homes or run that pool pump. But the arrival of the coronavirus and people working from home is adding to amount of power people are using.

Under normal conditions, those who work in their employer's offices might not be cooling their homes as much during the middle of the day or using as much electricity for lights and running computers.

For many, that's changed.

Estimates on how much of an increase residential electric customers are seeing as result of working from home vary widely.

ISO-New England, the regional electric grid operator, has seen a 3 percent to 5 percent decrease in commercial and industrial power demand, even as the grid overseer issued pandemic warnings nationally. The expectation is that much of that decrease translates into a corresponding increase in residential electricity usage.

But other estimates put the increase in residential electricity usage much higher. A Washington state company that makes smart electric meters, Itron, estimates that American households are using 5 percent to 10 percent more electricity per month since March, when many people began working from home as part of an effort to prevent the spread of the coronavirus.

Another smart metering company, Cambridge, Mass.-based Sense, found that average home electricity usage increased 22 percent in April compared to the same period in 2019, a reflection of people using more electricity while they stayed home. Based on its analysis of data from 5,000 homes across 30 states, Sense officials said a typical customer's monthly electric bill increased by between $22 and $25, with a larger increase for consumers in states with higher electricity rates.

Connecticut-specfic data is harder to come by.

Officials with Orange-based United Illuminating declined to provide any customer usage data, though, like others in the power industry, they did acknowledge that residential customers are using more electricity. And the state's other large electric distribution utility, Eversource, was unable to provide any recent data on residential electric usage. The company did tell Connecticut utility regulators there was a 3 percent increase in residential power usage for the week of March 21 compared to the week before.

Over the same time period, Eversource officials saw a 3 percent decrease in power usage by commercial and industrial customers.

Separately, nuclear plant workers raised concerns about pandemic precautions at some facilities, reflecting operational strains.

Alan Behm of Cheshire said he normally uses 597 kilowatt hours of electricity during an average month. But in April of this year, the amount of electricity he used rose by nearly 51 percent.

With many offices closed, the expense of heating, cooking and lighting is being shifted from employer to employee, and some utilities such as Manitoba Hydro have pursued unpaid days off to trim costs during the pandemic. And one remote work expert believes some companies are recognizing the burden those added costs are placing on workers -- and are trying to do something about it.

Technology giant Google announced in late May that it was giving employees who work from home $1,000 allowances to cover equipment costs and other expenses associated with establishing a home office.

Moe Vela, chief transparency officer for the New York City-based computer software company TransparentBusiness, said the move by Google executives is a savvy one.

"Google is very smart to have figured this out," Vela said. "This is what employees want, especially millenials. People are so much happier to be working remotely, getting those two to three hours back per day that some people spend getting to and from work is so much more important than a stipend."

Vela predicted that even after a vaccine is found for the corona virus, one of the key worklife changes is likely to be a broader acceptance of telework and working from home.

Beyond the immediate shifts, more young Canadians would work in electricity if awareness improved, pointing to future talent pipelines.

"I think that's where we're headed," he said. "I think it will make an employer more attractive as they try to attract talent from around the world."

Vela said employers save an average of $11,000 per year for each employee they have working from home.

"It would be a brilliant move if a company were to share some of that amount with employees," he said. "I wouldn't do it if it's going to cause a company to not be there (in business) though."

The idea of a company sharing whatever savings it achieves by having employees work from home wasn't well received by many Connecticut residents who responded to questions posed via social media by Hearst Connecticut Media. More than 100 people responded and an overwhelming number of people spoke out against the idea.

"You are saving on gas and other travel related expenses, so the small increase in your electric bill shouldn't really be a concern," said Kathleen Bennett Charest of Wallingford.

Jim Krupp, also of Wallingford, said, "to suggest that the employers compensate the employees makes as much sense as suggesting that the employees should take a pay cut due to their reduced expenses for travel, day care, and eating lunch at work."

"Employers must still maintain their offices and incur all of the fixed expenses involved, including basic utilities, taxes and insurance," Krupp said. "The cost savings (for employers) that are realized are also offset by increased costs of creating and maintaining IT networks that allow employees to access their work sites from home and the costs of monitoring and managing the work force."

Kiki Nichols Nugent of Cheshire said she was against the idea of an employee trying to get their employer to pay for the increased electricity costs associated with working from home.

"I would not nickle and dime," Nugent said. "If companies are saving on electricity now, maybe employers will give better raises next year."

New Haven resident Chris Smith said he is "just happy to have a job where I am able to telecommute."

"When teleworking becomes more the norm, either now or in the future, we may see increased wages for teleworkers either for the lower cost to the employer or for the increase in productivity it brings," Smith said.


Related News

View more

Maritime Electric team works on cleanup in Turks and Caicos

Maritime Electric Hurricane Irma Response details utility crews aiding Turks and Caicos with power restoration, storm recovery, debris removal, and essential services, coordinated with Fortis Inc., despite limited equipment, heat, and over 1,000 downed poles.


Key Points

A utility mission restoring power and essential services in Turks and Caicos after Irma, led by Maritime Electric.

✅ Over 1,000 poles down; crews climbing without bucket trucks

✅ Restoring hospitals, water, and communications first

✅ Fortis Inc. coordination; 2-3 week deployment with follow-on crews


Maritime Electric has sent a crew to help in the clean up and power restoration of Turks and Caicos after the Caribbean island was hit by Hurricane Irma, a storm that also saw FPL's massive response across Florida.

They arrived earlier this week and are working on removing debris and equipment so when supplies arrive, power can be brought back online, and similar mutual aid deployments, including Canadian crews to Florida, have been underway as well.

Fortis Inc., the parent company for Maritime Electric operates a utility in Turks and Caicos.

Kim Griffin, spokesperson for Maritime Electric, said there are over 1000 poles that were brought down by the storm, mirroring Florida restoration timelines reported elsewhere.

"It's really an intense storm recovery," she said. 'Good spirits'

The crew is working with less heavy equipment than they are used to, climbing poles instead of using bucket trucks, in hot and humid weather.

Griffin said their focus is getting essential services restored as quckly as possible, similar to progress in Puerto Rico's restoration efforts following recent hurricanes.

The crew will be there for two or three weeks and Griffin said Maritime Electric may send another group, as seen with Ontario's deployment to Florida, to continue the job.

She said the team has been well received and is in "good spirits."

"The people around them have been very positive that they're there," she said.

"They've said it's just been overwhelming how kind and generous the people have been to them."


Related News

View more

Rising Solar and Wind Curtailments in California

California Renewable Energy Curtailment highlights grid congestion, midday solar peaks, limited battery storage, and market constraints, with WEIM participation and demand response programs proposed to balance supply-demand and reduce wasted solar and wind generation.


Key Points

It is the deliberate reduction of solar and wind output when grid limits or low demand prevent full integration.

✅ Grid congestion restricts transmission capacity

✅ Midday solar peaks exceed demand, causing surplus

✅ Storage, WEIM, and demand response mitigate curtailment


California has long been a leader in renewable energy adoption, achieving a near-100% renewable milestone in recent years, particularly in solar and wind power. However, as the state continues to expand its renewable energy capacity, it faces a growing challenge: the curtailment of excess solar and wind energy. Curtailment refers to the deliberate reduction of power output from renewable sources when the supply exceeds demand or when the grid cannot accommodate the additional electricity.

Increasing Curtailment Trends

Recent data from the U.S. Energy Information Administration (EIA) highlights a concerning upward trend in curtailments in California. In 2024, the state curtailed a total of 3,102 gigawatt-hours (GWh) of electricity generated from solar and wind sources, surpassing the 2023 total of 2,660 GWh. This represents a 32.4% increase from the previous year. Specifically, 2,892 GWh were from solar, and 210 GWh were from wind, marking increases of 31.2% and 51.1%, respectively, compared to the first nine months of 2023.

Causes of Increased Curtailment

Several factors contribute to the rising levels of curtailment:

  1. Grid Congestion: California's transmission infrastructure has struggled to keep pace with the rapid growth of renewable energy sources. This congestion limits the ability to transport electricity from generation sites to demand centers, leading to curtailment.

  2. Midday Solar Peaks: Amid California's solar boom, solar energy production typically peaks during the midday when electricity demand is lower. This mismatch between supply and demand results in excess energy that cannot be utilized, necessitating curtailment.

  3. Limited Energy Storage: While battery storage technologies are advancing, California's current storage capacity is insufficient to absorb and store excess renewable energy for later use. This limitation exacerbates curtailment issues.

  4. Regulatory and Market Constraints: Existing market structures and regulatory frameworks may not fully accommodate the rapid influx of renewable energy, leading to inefficiencies and increased curtailment.

Economic and Environmental Implications

Curtailment has significant economic and environmental consequences. For renewable energy producers, curtailed energy represents lost revenue and undermines the economic viability of new projects. Environmentally, curtailment means that clean, renewable energy is wasted, and the grid may rely more heavily on fossil fuels to meet demand, counteracting the benefits of renewable energy adoption.

Mitigation Strategies

To address the rising curtailment levels, California is exploring several strategies aligned with broader decarbonization goals across the U.S.:

  • Grid Modernization: Investing in and upgrading transmission infrastructure to alleviate congestion and improve the integration of renewable energy sources.

  • Energy Storage Expansion: Increasing the deployment of battery storage systems to store excess energy during peak production times and release it during periods of high demand.

  • Market Reforms: Participating in the Western Energy Imbalance Market (WEIM), a real-time energy market that allows for the balancing of supply and demand across a broader region, helping to reduce curtailment.

  • Demand Response Programs: Implementing programs that encourage consumers to adjust their energy usage patterns, such as shifting electricity use to times when renewable energy is abundant.

Looking Ahead

As California continues to expand its renewable energy capacity, addressing curtailment will be crucial to ensuring the effectiveness and sustainability of its energy transition. By investing in grid infrastructure, energy storage, and market reforms, the state can reduce curtailment levels and make better use of its renewable energy resources, while managing challenges like wildfire smoke impacts on solar output. These efforts will not only enhance the economic viability of renewable energy projects but also contribute to California's 100% clean energy targets by maximizing the use of clean energy and reducing reliance on fossil fuels.

While California's renewable energy sector faces challenges related to curtailment, proactive measures and strategic investments can mitigate these issues, as scientists continue to improve solar and wind power through innovation, paving the way for a more sustainable and efficient energy future.


Related News

View more

Ireland and France will connect their electricity grids - here's how

Celtic Interconnector, a subsea electricity link between Ireland and France, connects EU grids via a high-voltage submarine cable, boosting security of supply, renewable integration, and cross-border trade with 700 MW capacity by 2026.


Key Points

A 700 MW subsea link between Ireland and France, boosting security, enabling trade, and supporting renewables.

✅ Approx. 600 km subsea cable from East Cork to Brittany

✅ 700 MW capacity; powers about 450,000 homes

✅ Financed by EIB, banks, CEF; Siemens Energy and Nexans


France and Ireland signed contracts on Friday to advance the Celtic Interconnector, a subsea electricity link to allow the exchange of electricity between the two EU countries. It will be the first interconnector between continental Europe and Ireland, as similar UK interconnector plans move forward in parallel. 

Representatives for Ireland’s electricity grid operator EirGrid and France’s grid operator RTE signed financial and technical agreements for the high-voltage submarine cable, mirroring developments like Maine’s approved transmission line in North America for cross-border power. The countries’ respective energy ministers witnessed the signing.

European commissioner for energy Kadri Simson said:

In the current energy market situation, marked by electricity price volatility, and the need to move away from imports of Russian fossil fuels, European energy infrastructure has become more important than ever.

The Celtic Interconnector is of paramount importance as it will end Ireland’s isolation from the Union’s power system, with parallels to Cyprus joining the electricity highway in the region, and ensure a reliable high-capacity link improving the security of electricity supply and supporting the development of renewables in both Ireland and France.

EirGrid and RTE signed €800 million ($827 million) worth of financing agreements with Barclays, BNP Paribas, Danske Bank, and the European Investment Bank, similar to the Lake Erie Connector investment that blends public and private capital.

In 2019, the project was awarded a Connecting Europe Facility (CEF) grant worth €530.7 million to support construction works and align with a broader push for electrification in Europe under climate strategies. The CEF program also provided €8.3 million for the Celtic Interconnector’s feasibility study and initial design and pre-consultation.

Siemens Energy will build converter stations in both countries, and Paris-based global cable company Nexans will design and install a 575-km-long cable for the project.

The cable will run between East Cork, on Ireland’s southern coast, and northwestern France’s Brittany coast and will connect into substations at Knockraha in Ireland and La Martyre in France.

The Celtic Interconnector, which is expected to be operational by 2026, will be approximately 600 km (373 miles) long and have a capacity of 700 MW, similar to cross-border initiatives such as Quebec-to-New York power exports expected in 2025, which is enough to power 450,000 households.


Related News

View more

Here are 3 ways to find out where your electricity comes from

US energy mix shows how the electric grid blends renewables, fossil fuels, nuclear, and hydro, varying by ISO/RTO markets, utilities, and state policies, affecting carbon emissions, pricing, reliability, and access.


Key Points

The US energy mix is the grid's source breakdown by region: fossil fuels, renewables, nuclear, and hydro.

✅ Check ISO or RTO dashboards for real-time generation by fuel source.

✅ Utilities may offer green power plans or RECs at modest premiums.

✅ Energy mix shifts with policy, pricing, and grid reliability needs.


There are few resources more important than energy. Sure, you may die if you don't eat for days. But your phone will die if you go too long without charging it. Energy feeds tech, the internet, city infrastructure, refrigerators, lights, and has evolved throughout U.S. history in profound ways. You get the idea. Yet unlike our other common needs, such as food, energy sources aren't exactly front of mind for most people. 

"I think a lot of people don't put a lot of bandwidth into thinking about this part of their lives," said Richard McMahon, the SVP of energy supply and finance at Edison Electric Institute, a trade group that represents investor-owned electric companies in the US. 

It makes sense. For most Americans, electricity is always there, and in many locations, there's not much of a choice involved, even as electricity demand is flat across the U.S. today. You sign up with a utility when you move into a new residence and pay your bills when they're due. 

But there's an important reality that indifference eschews: In 2018, a third of the energy-related carbon-dioxide emissions in the US came from the electric power sector, according to the US Energy Information Administration (EIA). 

A good chunk of that is from the residential sector, which consistently uses more energy than commercial customers, per EIA data.

Just as many people exercise choice when they eat, you typically also have a choice when it comes to your energy supply. That's not to say your current offering isn't what you want, or that switching will be easy or affordable, but "if you're a customer and want power with a certain attribute," McMahon said, "you can pretty much get it wherever you are." 

But first, you need to know the energy mix you have right now. As it turns out, it's not so straightforward. At all.

This brief guide may help. 

For some utility providers, you can find out if it publishes the energy mix online. Dominion Energy, which serves Idaho, North Carolina, Ohio, South Carolina, Utah, Virginia, West Virginia, and Wyoming, provides this information in a colored graphic. 

"Once you figure out who your utility is you can figure out what mix of resources they use," said Heidi Ratz, an electricity markets researcher at the World Resources Institute.

But not all utilities publish this information.

It has to do with their role in the grid and reflects utility industry trends in structure and markets. Some utility companies are vertically integrated; they generate power through nuclear plants or wind farms and distribute those electrons directly to their customers. Other utilities just distribute the power that different companies produce. 

Consider Consolidated Edison, or Con Ed, which distributes energy to parts of New York City. While reporting this story, Business Insider could not find information about the utility's energy mix online. When reached for comment, a spokesperson said, "we're indifferent to where it comes from."

That's because, in New York, distribution utilities like Con Ed often buy energy through a wholesale marketplace.

Take a look at this map. If you live in one of the colored regions, your electricity is sold on a wholesale market regulated by an organization called a regional transmission organization (RTO) or independent system operator (ISO). Distribution utilities like Con Ed often buy their energy through these markets, based on availability and cost, while raising questions about future utility revenue models as prices shift. 

Still, it's pretty easy to figure out where your energy comes from. Just look up the ISO or RTO website (such as NYISO or CAISO). Usually, these organizations will provide energy supply information in near-real time. 

That's exactly what Con Edison (which buys energy on the NYISO marketplace) suggested. As of Friday morning, roughly 40% of the energy on the market place was natural gas or other fossil fuels, 34% was nuclear, and about 22% was hydro. 

If you live in another region governed by an ISO or RTO, such as in most of California, you can do the same thing. Like NYISO, CAISO has a dashboard that shows (again, as of Friday morning) about 36% of the energy on the market comes from natural gas and more than 20% comes from renewables. 

In the map linked above, you'll notice that some of the ISOs and RTOs like MISO encompass enormous regions. That means that even if you figure out where the energy in your market comes from, it's not going to be geographically specific. But there are a couple of ways to drill down even further. 

The Environmental Protection Agency has a straightforward tool called Power Profiler. You can enter your zip code to see the fuel mix in your area. But it's not perfect. The data are from 2016 and, in some regions of the country like the upper Midwest, they aren't much more localized, and some import dirty electricity due to regional trading. 

The World Resources Institute also has a tool that allows you to see the electricity mix by state, based on 2017 data from EIA. These numbers represent power generation, not the electricity actually flowing into your sockets, but they offer a rough idea of what energy resources are operating in your state. 

One option is to check with your utility to see if it has a "green power" offering. Over 600 utilities across the country have one, according to the Climate Reality Project, though they often come at a slightly higher cost. It's typically on the scale of just a few more cents per kilowatt-hour. 

There are also independent, consumer-facing companies like Arcadia and Green Mountain Energy that allow you to source renewable energy, by virtually connecting you to community solar projects or purchasing Renewable Energy Certificates, or RECs, on your behalf, as America goes electric and more options emerge. 

"RECs measure an investment in a clean energy resource," Ratz said, in an email. "The goal of putting that resource on the grid is to push out the need for dirtier resources."

The good news: Even if you do nothing, your energy mix will get cleaner. Coal production has fallen to lows not seen since the 1980s, amid disruptions in coal and nuclear sectors that affect reliability and costs, while renewable electricity generation has doubled since 2008. So whether you like it or not, you'll be roped into the clean energy boom one way or another. 


Related News

View more

UK low-carbon electricity generation stalls in 2019

UK low-carbon electricity 2019 saw stalled growth as renewables rose slightly, wind expanded, nuclear output fell, coal hit record lows, and net-zero targets demand faster deployment to cut CO2 intensity below 100gCO2/kWh.


Key Points

Low-carbon sources supplied 54% of UK power in 2019, up just 1TWh; wind grew, nuclear fell, and coal dropped to 2%.

✅ Wind up 8TWh; nuclear down 9TWh amid outages

✅ Fossil fuels 43% of generation; coal at 2%

✅ Net-zero needs 15TWh per year added to 2030


The amount of electricity generated by low-carbon sources in the UK stalled in 2019, Carbon Brief analysis shows.

Low-carbon electricity output from wind, solar, nuclear, hydro and biomass rose by just 1 terawatt hour (TWh, less than 1%) in 2019. It represents the smallest annual increase in a decade, where annual growth averaged 9TWh. This growth will need to double in the 2020s to meet UK climate targets while replacing old nuclear plants as they retire.

Some 54% of UK electricity generation in 2019 came from low-carbon sources, including 37% from renewables and 20% from wind alone, underscoring wind's leading role in the power mix during key periods. A record-low 43% was from fossil fuels, with 41% from gas and just 2% from coal, also a record low. In 2010, fossil fuels generated 75% of the total.

Carbon Brief’s analysis of UK electricity generation in 2019 is based on figures from BM Reports and the Department for Business, Energy and Industrial Strategy (BEIS). See the methodology at the end for more on how the analysis was conducted.

The numbers differ from those published earlier in January by National Grid, which were for electricity supplied in Great Britain only (England, Wales and Scotland, but excluding Northern Ireland), including via imports from other countries.

Low-carbon low
In 2019, the UK became the first major economy to target net-zero greenhouse gas emissions by 2050, increasing the ambition of its legally binding Climate Change Act.

To date, the country has cut its emissions by around two-fifths since 1990, with almost all of its recent progress coming from the electricity sector.

Emissions from electricity generation have fallen rapidly in the decade since 2010 as coal power has been almost phased out and even gas output has declined. Fossil fuels have been displaced by falling demand and by renewables, such as wind, solar and biomass.

But Carbon Brief’s annual analysis of UK electricity generation shows progress stalled in 2019, with the output from low-carbon sources barely increasing compared to a year earlier.

The chart below shows low-carbon generation in each year since 2010 (grey bars) and the estimated level in 2019 (red). The pale grey bars show the estimated future output of existing low-carbon sources after old nuclear plants retire and the pale red bars show the amount of new generation needed to keep electricity sector emissions to less than 100 grammes of CO2 per kilowatt hour (gCO2/kWh), the UK’s nominal target for the sector.

 Annual electricity generation in the UK by fuel, terawatt hours, 2010-2019. Top panel: fuel by fuel. Bottom panel: cumulative total generation from all sources. Source: BEIS energy trends, BM Reports and Carbon Brief analysis. Chart by Carbon Brief using Highcharts.
As the chart shows, the UK will require significantly more low-carbon electricity over the next decade as part of meeting its legally binding climate goals.

The nominal 100gCO2/kWh target for 2030 was set in the context of the UK’s less ambitious goal of cutting emissions to 80% below 1990 levels by 2050. Now that the country is aiming to cut emissions to net-zero by 2050, that 100gCO2/kWh indicator is likely to be the bare minimum.

Even so, it would require a rapid step up in the pace of low-carbon expansion, compared to the increases seen over the past decade. On average, low-carbon generation has risen by 9TWh each year in the decade since 2010 – including a rise of just 1TWh in 2019.

Given scheduled nuclear retirements and rising demand expected by the Committee on Climate Change (CCC) – with some electrification of transport and heating – low-carbon generation would need to increase by 15TWh each year until 2030, just to meet the benchmark of 100gCO2/kWh.

For context, the 3.2 gigawatt (GW) Hinkley C new nuclear plant being built in Somerset will generate around 25TWh once completed around 2026. The world’s largest offshore windfarm, the 1.2GW Hornsea One scheme off the Yorkshire coast, will generate around 5TWh each year.

The new Conservative government is targeting 40GW of offshore wind by 2030, up from today’s figure of around 8GW. If policies are put in place to meet this goal, then it could keep power sector emissions below 100gCO2/kWh, depending on the actual performance of the windfarms built.

However, new onshore wind and solar, further new nuclear or other low-carbon generation, such as gas with carbon capture and storage (CCS), is likely to be needed if demand is higher than expected, or if the 100gCO2/kWh benchmark is too weak in the context of net-zero by 2050.

The CCC says it is “likely” to “reflect the need for more rapid deployment” of low-carbon towards net-zero emissions in its advice on the sixth UK carbon budget for 2033-2037, due in September.

Trading places
Looking more closely at UK electricity generation in 2019, Carbon Brief’s analysis shows why there was so little growth for low-carbon sources compared to the previous year.

There was another increase for wind power in 2019 (up 8TWh, 14%), with record wind generation as several large new windfarms were completed including the 1.2GW Hornsea One project in October and the 0.6GW Beatrice offshore windfarm in Q2 of 2019. But this was offset by a decline for nuclear (down 9TWh, 14%), due to ongoing outages for reactors at Hunterston in Scotland and Dungeness in Kent.

(Analysis of data held by trade organisation RenewableUK suggests some 0.6GW of onshore wind capacity also started operating in 2019, including the 0.2GW Dorenell scheme in Moray, Scotland.)

As a result of these movements, the UK’s windfarms overtook nuclear for the first time ever in 2019, becoming the country’s second-largest source of electricity generation, and earlier, wind and solar together surpassed nuclear in the UK as momentum built. This is shown in the figure below, with wind (green line, top panel) trading places with nuclear (purple) and gas (dark blue) down around 25% since 2010 but remaining the single-largest source.

 Annual electricity generation in the UK by fuel, terawatt hours, 2010-2019. Top panel: fuel by fuel. Bottom panel: cumulative total generation from all sources. Source: BEIS energy trends, BM Reports and Carbon Brief analysis. Chart by Carbon Brief using Highcharts.
The UK’s currently suspended nuclear plants are due to return to service in January and March, according to operator EDF, the French state-backed utility firm. However, as noted above, most of the UK’s nuclear fleet is set to retire during the 2020s, with only Sizewell B in Suffolk due to still be operating by 2030. Hunterston is scheduled to retire by 2023 and Dungeness by 2028.

Set against these losses, the UK has a pipeline of offshore windfarms, secured via “contracts for difference” with the government, at a series of auctions. The most recent auction, in September 2019, saw prices below £40 per megawatt hour – similar to current wholesale electricity prices.

However, the capacity contracted so far is not sufficient to meet the government’s target of 40GW by 2030, meaning further auctions – or some other policy mechanism – will be required.

Coal zero
As well as the switch between wind and nuclear, 2019 also saw coal fall below solar for the first time across a full year, echoing the 2016 moment when wind outgenerated coal across the UK, after it suffered another 60% reduction in electricity output. Just six coal plants remain in the UK, with Aberthaw B in Wales and Fiddlers Ferry in Cheshire closing in March.

Coal accounted for just 2% of UK generation in 2019, a record-low coal share since centralised electricity supplies started to operate in 1882. The fuel met 40% of UK needs as recently as 2012, but has plummeted thanks to falling demand, rising renewables, cheaper gas and higher CO2 prices.

The reduction in average coal generation hides the fact that the fuel is now often not required at all to meet the UK’s electricity needs. The chart below shows the number of days each year when coal output was zero in 2019 (red line) and the two previous years (blue).

 Cumulative number of days when UK electricity generation from renewable sources has been higher than that from fossil fuels. Source: BEIS energy trends, BM Reports and Carbon Brief analysis. Chart by Carbon Brief using Highcharts.
The 83 days in 2019 with zero coal generation amount to nearly a quarter of the year and include the record-breaking 18-day stretch without the fuel.

Great Britain has been running for a record TWO WEEKS without using coal to generate electricity – the first time this has happened since 1882.

The country’s grid has been coal-free for 45% of hours in 2019 so far.https://www.carbonbrief.org/countdown-to-2025-tracking-the-uk-coal-phase-out …

Coal generation was set for significant reductions around the world in 2019 – including a 20% reduction for the EU as a whole – according to analysis published by Carbon Brief in November.

Notably, overall UK electricity generation fell by another 9TWh in 2019 (3%), bringing the total decline to 58TWh since 2010. This is equivalent to more than twice the output from the Hinkley C scheme being built in Somerset. As Carbon Brief explained last year, falling demand has had a similar impact on electricity-sector CO2 emissions as the increase in output from renewables.

This is illustrated by the fact that the 9TWh reduction in overall generation translated into a 9TWh (6%) cut in fossil-fuel generation during 2019, with coal falling by 10TWh and gas rising marginally.

Increasingly renewable
As fossil-fuel output and overall generation have declined, the UK’s renewable sources of electricity have continued to increase. Their output has risen nearly five-fold in the past decade and their share of the UK total has increased from 7% in 2010 to 37% in 2019.

As a result, the UK’s increasingly renewable grid is seeing more minutes, hours and days during which the likes of wind, solar and biomass collectively outpace all fossil fuels put together, and on some days wind is the main source as well.

The chart below shows the number of days during each year when renewables generated more electricity than fossil fuels in 2019 (red line) and each of the previous four years (blue lines). In total, nearly two-fifths of days in 2019 crossed this threshold.

 Cumulative number of days when the UK has not generated any electricity from coal. Source: BEIS energy trends, BM Reports and Carbon Brief analysis. Chart by Carbon Brief using Highcharts.
There were also four months in 2019 when renewables generated more of the UK’s electricity than fossil fuels: March, August, September and December. The first ever such month came in September 2018 and more are certain to follow.

National Grid, which manages Great Britain’s high-voltage electricity transmission network, is aiming to be able to run the system without fossil fuels by 2025, at least for short periods. At present, it sometimes has to ask windfarm operators to switch off and gas plants to start running in order to keep the electricity grid stable.

Note that biomass accounted for 11% of UK electricity generation in 2019, nearly a third of the total from all renewables. Some two-thirds of the biomass output is from “plant biomass”, primarily wood pellets burnt at Lynemouth in Northumberland and the Drax plant in Yorkshire. The remainder was from an array of smaller sites based on landfill gas, sewage gas or anaerobic digestion.

The CCC says the UK should “move away” from large-scale biomass power plants, once existing subsidy contracts for Drax and Lynemouth expire in 2027.

Using biomass to generate electricity is not zero-carbon and in some circumstances could lead to higher emissions than from fossil fuels. Moreover, there are more valuable uses for the world’s limited supply of biomass feedstock, the CCC says, including carbon sequestration and hard-to-abate sectors with few alternatives.

Methodology
The figures in the article are from Carbon Brief analysis of data from BEIS Energy Trends chapter 5 and chapter 6, as well as from BM Reports. The figures from BM Reports are for electricity supplied to the grid in Great Britain only and are adjusted to include Northern Ireland.

In Carbon Brief’s analysis, the BM Reports numbers are also adjusted to account for electricity used by power plants on site and for generation by plants not connected to the high-voltage national grid. This includes many onshore windfarms, as well as industrial gas combined heat and power plants and those burning landfill gas, waste or sewage gas.

By design, the Carbon Brief analysis is intended to align as closely as possible to the official government figures on electricity generated in the UK, reported in BEIS Energy Trends table 5.1.

Briefly, the raw data for each fuel is in most cases adjusted with a multiplier, derived from the ratio between the reported BEIS numbers and unadjusted figures for previous quarters.

Carbon Brief’s method of analysis has been verified against published BEIS figures using “hindcasting”. This shows the estimates for total electricity generation from fossil fuels or renewables to have been within ±3% of the BEIS number in each quarter since Q4 2017. (Data before then is not sufficient to carry out the Carbon Brief analysis.)

For example, in the second quarter of 2019, a Carbon Brief hindcast estimates gas generation at 33.1TWh, whereas the published BEIS figure was 34.0TWh. Similarly, it produces an estimate of 27.4TWh for renewables, against a BEIS figure of 27.1TWh.

National Grid recently shared its own analysis for electricity in Great Britain during 2019 via its energy dashboard, which differs from Carbon Brief’s figures.


Related News

View more

Sign Up for Electricity Forum’s Newsletter

Stay informed with our FREE Newsletter — get the latest news, breakthrough technologies, and expert insights, delivered straight to your inbox.

Electricity Today T&D Magazine Subscribe for FREE

Stay informed with the latest T&D policies and technologies.
  • Timely insights from industry experts
  • Practical solutions T&D engineers
  • Free access to every issue

Live Online & In-person Group Training

Advantages To Instructor-Led Training – Instructor-Led Course, Customized Training, Multiple Locations, Economical, CEU Credits, Course Discounts.

Request For Quotation

Whether you would prefer Live Online or In-Person instruction, our electrical training courses can be tailored to meet your company's specific requirements and delivered to your employees in one location or at various locations.