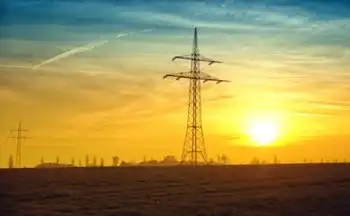
Region faces energy quandary

By Missoulian


NFPA 70e Training

Our customized live online or in‑person group training can be delivered to your staff at your location.

  • Live Online
  • 6 hours Instructor-led
  • Group Training Available
Regular Price:
$199
Coupon Price:
$149
Reserve Your Seat Today
Analysts have long held that electricity consumers would save money by meeting more of the Pacific Northwest's future energy needs through conservation and wind generators, rather than traditional coal or gas.

Now, they say that plan also could significantly mitigate the region's growing contribution of carbon dioxide into the global atmosphere. But, they warn, reaching proposed CO2 emission goals will not be easy, especially given current energy demand.

A new report from the Northwest Power and Conservation Council “highlights the challenges facing the region in trying to control CO2 emissions from the power system,” said council Chairman Tom Karier. “It will be a tremendous challenge just to keep CO2 emissions at current levels,” let alone reduce those emissions.

That challenge must be met head-on, though, as state and federal regulators increasingly eye controls on carbon dioxide, a greenhouse gas widely understood to be a major contributor to climate change.

According to the Sept. 13 council report, about 85 percent of the carbon dioxide produced by regional power generation comes from coal-fired plants, which supply about 14 percent of the region's power.

Some proposed policies would reduce CO2 emissions to 2005 - or even 1990 - levels, a move that would require replacing coal plants with cleaner alternatives.

But meeting those goals will prove difficult at best, Karier warned, due to the region's complex mix of energy sources.

That's why the council - a multistate agency charged with balancing the need for power against the needs of fish and wildlife - crafted a number of scenarios to see what obstacles might limit potential pollution gains.

For example, if the region's power producers actually met new state standards for renewable energy, and if they boosted hydropower generation by eliminating summer spill at federal dams, they still would not reduce carbon dioxide emissions to historical levels. Instead, they would simply cut in half the projected CO2 increase over the coming decades.

And achieving the council's own “aggressive” goals for conservation and wind power still means CO2 production would increase slightly, not decrease to previous levels.

Not implementing the council's plan, however, is not an option.

Should the region achieve only 70 percent of the conservation target, gas and coal would be called upon to make up the difference, resulting in an additional 6.3 million tons per year of carbon dioxide emissions. That, the report said, is equivalent to nearly 10 percent of the region's entire CO2 production.

It is, Karier said, an environmental balancing act. Courts have ordered summer spills at hydroelectric dams to assist threatened fish, but those spills mean less power generation as water bypasses turbines. Again, coal and gas must make up the difference, adding an estimated 1.8 million tons of CO2 per year, he said.

Some have proposed breaching dams to assist fisheries and aquatic systems, but the council report warns toppling just four dams on the Lower Snake River would result in an additional 5.4 million tons of CO2 per year, as thermal plants fire up to cover the hydroelectric losses.

The various scenarios, each viewed in light of potential greenhouse gas restrictions, are available for public comment through October 19.

Related News

Texas produces and consumes the most electricity in the US

Texas ERCOT Power Grid leads U.S. wind generation yet faces isolated interconnection, FERC exemption, and high industrial energy use, with distinct electricity and natural gas prices managed by a single balancing authority.


Key Points

The state-run interconnection that balances Texas electricity, isolated from FERC oversight and other U.S. grids.

✅ Largest U.S. wind power producer, high industrial demand

✅ Operates one balancing authority, independent interconnection

✅ Pays lower electricity, higher natural gas vs national average


For nearly two decades, the Lone Star State has generated more wind-sourced electricity than any other state in the U.S., according to the Energy Information Administration, or EIA.

In 2022, EIA reported Texas produced more electricity than any other state and generated twice as much as second-place Florida.

However, Texas also leads the country in another category. According to EIA, Texas is the largest energy-consuming state in the nation across all sectors with more than half of the state’s energy being used by the industrial sector.

As of May 2023, Texas residents paid 43% more for natural gas and around 10% less for electricity compared to the national average, according to EIA, and in competitive areas shopping for electricity is getting cheaper as well. Commercial and industrial sectors on average for the same month paid 25% less for electricity compared to the national average.


U.S. electric system compared to Texas
The U.S. electric system is essentially split into three regions called interconnections and are managed by a total of 74 entities called balancing authorities that ensure that power supply and demand are balanced throughout the region to prevent the possibility of blackouts, according to EIA.

The three regions (Interconnections):

Eastern Interconnection: Covers all U.S. states east of the Rocky Mountains, a portion of northern Texas, and consists of 36 balancing authorities.
Western Interconnection: Covers all U.S. states west of the Rockies and consists of 37 balancing authorities.
ERCOT: Covers the majority of Texas and consists of one balancing authority (itself).

During the 2021 winter storm, Texas electric cooperatives were credited with helping maintain service in many communities.

“ERCOT is unique in that the balancing authority, interconnection, and the regional transmission organization are all the same entity and physical system,” according to EIA, a structure often discussed in analyses of Texas power grid challenges today.

With this being the case, Texas is the only state in the U.S. that balances itself, the only state that is not subject to the jurisdiction of the Federal Energy Regulatory Commission, or FERC, and the only state that is not synchronously interconnected to the grid in the rest of the United States in the event of tight grid conditions, highlighting ongoing discussions about improving Texas grid reliability before peak seasons, according to EIA.

Every other state in the U.S. is connected to a web of multiple balancing authorities that contribute to ensuring power supply and demand are met.

California, for example, was the fourth largest electricity producer and the third largest electricity consumer in the nation in 2022, according to EIA, and California imports the most electricity from other states while Pennsylvania exports the most.

Although California produces significantly less electricity than Texas, it has the ability to connect with more than 10 neighboring balancing authorities within the Western Interconnection to interchange electricity, a dynamic that can see clean states importing dirty electricity under certain market conditions. ERCOT being independent only has electricity interchange with two balancing authorities, one of which is in Mexico.

Regardless of Texas’ unique power structure compared to the rest of the nation, the vast majority of the U.S. risked electricity supplies during this summer’s high heat, as outlined in severe heat blackout risks reports, according to EIA.


Related News

View more

Solar + Wind = 10% of US Electricity Generation in 1st Half of 2018

US Electricity Generation H1 2018 saw wind and solar gains but hydro declines, as natural gas led the grid mix and coal fell; renewables' share, GWh, emissions, and capacity additions shaped the power sector.


Key Points

It is the H1 2018 US power mix, where natural gas led, coal declined, and wind and solar grew while hydro fell.

✅ Natural gas reached 32% of generation, highest share

✅ Coal fell; renewables roughly tied nuclear at ~20%

✅ Wind and solar up; hydro output down vs 2017


To complement our revival of US electricity capacity reports, here’s a revival of our reports on US electricity generation.

As with the fresh new capacity report, things are not looking too bright when it comes to electricity generation. There’s still a lot of grey — in the bar charts below, in the skies near fossil fuel power plants, and in the human and planetary outlook based on how slowly we are cutting fossil fuel electricity generation.

As you can see in the charts above, wind and solar energy generation increased notably from the first half of 2017 to the first half of 2018, and the EIA expected larger summer solar and wind generation in subsequent months, reinforcing that momentum.

A large positive when it comes to the environment and human health is that coal generation dropped a great deal year over year — by even more than renewables increased, though the EIA later noted an increase in coal-fired generation in a subsequent year, complicating the trend. However, on the down side, natural gas soared as it became the #1 source of electricity generation in the United States (32% of US electricity). Furthermore, coal was still solidly in the #2 position (27% of US electricity). Renewables and nuclear were essentially in a tie at 19.8% of generation, with renewables just a tad above nuclear.

Actually, combined with an increase in nuclear power generation, natural gas electricity production increased so much that the renewable energy share of electricity generation actually dropped in the first half of 2018 versus the first half of 2017, even amid declining electricity use in some periods. It was 19.8% this year and 20% last year.

Again, solar and wind saw a significant growth in its market share, from 9% to 9.9%, but hydro brought the whole category down due to a decrease from 9% to 8%.

The visuals above are probably the best way to examine it all. The H1 2018 chart was still dominated by fossil fuels, which together accounted for approximately 60% of electricity generation, even though by 2021 non-fossil sources supplied about 40% of U.S. electricity, highlighting the longer-term shift. In H1 2017, the figure was 59.7%. Furthermore, if you switch to the “Change H1 2018 vs H1 2017 (GWh)” chart, you can watch a giant grey bar representing natural gas take over the top of the chart. It almost looks like it’s part of the border of the chart. The biggest glimmer of positivity in that chart is seeing the decline in coal at the bottom.

What will the second half of the year bring? Well, the gigantic US electricity generation market shifts slowly, even as monthly figures can swing, as January generation jumped 9.3% year over year according to the EIA, reminding us about volatility. There is so much base capacity, and power plants last so long, that it takes a special kind of magic to create a rapid transition to renewable energy. As you know from reading this quarter’s US renewable energy capacity report, only 43% of new US power capacity in the first half of the year was from renewables. The majority of it was from natural gas. Along with other portions of the calculation, that means that electricity generation from natural gas is likely to increase more than electricity generation from renewables.

Jump into the numbers below and let us know if you have any more thoughts.


Related News

View more

Vancouver's Reversal on Gas Appliances

Vancouver Natural Gas Ban Reversal spotlights energy policy, electrification tradeoffs, heat pumps, emissions, grid reliability, and affordability, reshaping building codes and decarbonization pathways while inviting stakeholders to weigh practical constraints and climate goals.


Key Points

Vancouver ending its ban on natural gas in new homes to balance climate goals with reliability, costs, and technology.

✅ Balances emissions goals with reliability and affordability

✅ Impacts builders, homeowners, and energy infrastructure

✅ Spurs debate on electrification, heat pumps, and grid capacity


In a significant policy shift, Vancouver has decided to lift its ban on natural gas appliances in new homes, a move that marks a pivotal moment in the city's energy policy and environmental strategy. This decision, announced recently and following the city's Clean Energy Champion recognition for Bloedel upgrades, has sparked a broader conversation about the future of energy systems and the balance between environmental goals and practical energy needs. Stewart Muir, CEO of Resource Works, argues that this reversal should catalyze a necessary dialogue on energy choices, highlighting both the benefits and challenges of such a policy change.

Vancouver's original ban on natural gas appliances was part of a broader initiative aimed at reducing greenhouse gas emissions and promoting sustainability, including progress toward phasing out fossil fuels where feasible over time. The city had adopted stringent regulations to encourage the use of electric heat pumps and other low-carbon technologies in new residential buildings. This move was aligned with Vancouver’s ambitious climate goals, which include achieving carbon neutrality by 2050 and significantly cutting down on fossil fuel use.

However, the recent decision to reverse the ban reflects a growing recognition of the complexities involved in transitioning to entirely new energy systems. The city's administration acknowledged that while electric alternatives offer environmental benefits, they also come with challenges that can affect homeowners, builders, and the broader energy infrastructure, including options for bridging the electricity gap with Alberta to enhance regional reliability.

Stewart Muir argues that Vancouver’s policy shift is not just about natural gas appliances but represents a larger conversation about energy system choices and their implications. He suggests that the reversal of the ban provides an opportunity to address key issues related to energy reliability, affordability, and the practicalities of integrating new technologies, including electrified LNG options for industry within the province into existing systems.

One of the primary reasons behind the reversal is the recognition of the practical limitations and costs associated with transitioning to electric-only systems. For many homeowners and builders, natural gas appliances have long been a reliable and cost-effective option. The initial ban on these appliances led to concerns about increased construction costs and potential disruptions for homeowners who were accustomed to natural gas heating and cooking.

In addition to cost considerations, there are concerns about the reliability and efficiency of electric alternatives. Natural gas has been praised for its stable energy supply and efficient performance, especially in colder climates where electric heating systems might struggle to maintain consistent temperatures or fully utilize Site C's electricity under peak demand. By reversing the ban, Vancouver acknowledges that a one-size-fits-all approach may not be suitable for every situation, particularly when considering diverse housing needs and energy demands.

Muir emphasizes that the reversal of the ban should prompt a broader discussion about how to balance environmental goals with practical energy needs. He argues that rather than enforcing a blanket ban on specific technologies, it is crucial to explore a range of solutions that can effectively address climate objectives while accommodating the diverse requirements of different communities and households.

The debate also touches on the role of technological innovation in achieving sustainability goals. As energy technologies continue to evolve, renewable electricity is coming on strong and new solutions and advancements could potentially offer more efficient and environmentally friendly alternatives. The conversation should include exploring these innovations and considering how they can be integrated into existing energy systems to support long-term sustainability.

Moreover, Muir advocates for a more inclusive approach to energy policy that involves engaging various stakeholders, including residents, businesses, and energy experts. A collaborative approach can help identify practical solutions that address both environmental concerns and the realities of everyday energy use.

In the broader context, Vancouver’s decision reflects a growing trend in cities and regions grappling with energy transitions. Many urban centers are evaluating their energy policies and considering adjustments based on new information and emerging technologies. The key is to find a balance that supports climate goals such as 2050 greenhouse gas targets while ensuring that energy systems remain reliable, affordable, and adaptable to changing needs.

As Vancouver moves forward with its revised policy, it will be important to monitor the outcomes and assess the impacts on both the environment and the community. The reversal of the natural gas ban could serve as a case study for other cities facing similar challenges and could provide valuable insights into how to navigate the complexities of energy transitions.

In conclusion, Vancouver’s decision to reverse its ban on natural gas appliances in new homes is a significant development that opens the door for a critical dialogue about energy system choices. Stewart Muir’s call for a broader conversation emphasizes the need to balance environmental ambitions with practical considerations, such as cost, reliability, and technological advancements. As cities continue to navigate their energy futures, finding a pragmatic and inclusive approach will be essential in achieving both sustainability and functionality in energy systems.


Related News

View more

German renewables deliver more electricity than coal and nuclear power for the first time

Germany renewable energy milestone 2019 saw wind, solar, hydropower, and biomass outproduce coal and nuclear, as low gas prices and high CO2 costs under the EU ETS reshaped the electricity mix, per Fraunhofer ISE.


Key Points

It marks H1 2019 when renewables supplied 47.3% of Germany's electricity, surpassing coal and nuclear.

✅ Driven by high CO2 prices and cheap natural gas

✅ Wind and solar output rose; coal generation declined sharply

✅ Flexible gas plants outcompeted inflexible coal units


In Lippendorf, Saxony, the energy supplier EnBW is temporarily taking part of a coal-fired power plant offline. Not because someone ordered it — it simply wasn't paying off. Gas prices are low, CO2 prices are high, and with many hours of sunshine and wind, renewable methods are producing a great deal of electricity as part of Germany's energy transition now reshaping operations. And in the first half of the year there was plenty of sun and wind.

The result was a six-month period in which renewable energy sources, a trend echoed by the EU wind and solar record across the bloc, produced more electricity than coal and nuclear power plants together. For the first time 47.3% of the electricity consumers used came from renewable sources, while 43.4% came from coal-fired and nuclear power plants.

In addition to solar and wind power, renewable sources also include hydropower and biomass. Gas supplied 9.3%, reflecting how renewables are crowding out gas across European power markets, while the remaining 0.4% came from other sources, such as oil, according to figures published by the Fraunhofer Institute for Solar Energy Systems in July.

Fabian Hein from the think tank Agora Energiewende stresses that the situation is only a snapshot in time, with grid expansion woes still shaping outcomes. For example, the first half of 2019 was particularly windy and wind power production rose by around 20% compared to the first half of 2018.

Electricity production from solar panels rose by 6%, natural gas by 10%, while the share of nuclear power in German electricity consumption has remained virtually unchanged despite a nuclear option debate in climate policy.

Coal, on the other hand, declined. Black coal energy production fell by 30% compared to the first half of 2018, lignite fell by 20%. Some coal-fired power plants were even taken off the grid, even as coal still provides about a third of Germany's electricity. It is difficult to say whether this was an effect of the current market situation or whether this is simply part of long-term planning, says Hein.


Activists storm German mine in anti-coal protest

It is clear, however, that an increased CO2 price has made the ongoing generation of electricity from coal more expensive. Gas-fired power plants also emit CO2, but less than coal-fired power plants. They are also more efficient and that's why gas-fired power plants are not so strongly affected by the CO2 price

The price is determined at a European level and covers power plants and energy intensive industries in Europe. Other areas, such as heating or transport are not covered by the CO2 price scheme. Since a reform of CO2 emissions trading in 2017, the price has risen sharply. Whereas in September 2016 it was just over €5 ($5.6), by the end of June 2019 it had climbed to over €26.


Ups and downs

Gas as a raw material is generally more expensive than coal. But coal-fired power plants are more expensive to build. This is why operators want to run them continuously. In times of high demand, and therefore high prices, gas-fired power plants are generally started up, as seen when European power demand hit records during recent heatwaves, since it is worth it at these times.

Gas-fired power plants can be flexibly ramped up and down. Coal-fired power plants take 11 hours or longer to get going. That's why they can't be switched on quickly for short periods when prices are high, like gas-fired power plants. In the first half of the year, however, coal-fired power plants were also ramped up and down more often because it was not always worthwhile to let the power plant run around the clock.

Because gas prices were particularly low in the first half of 2019, some gas-fired power plants were more profitable than coal-fired plants. On June 29, 2019, the gas price at the Dutch trading point TTF was around €10 per megawatt hour. A year earlier, it had been almost €20. This is partly due to the relatively mild winter, as there is still a lot of gas in reserve, confirmed a spokesman for the Federal Association of the Energy and Water Industries (BDEW). There are also several new export terminals for liquefied natural gas. Additionally, weaker growth and trade wars are slowing demand for gas. A lot of gas comes to Europe, where prices are still comparatively high, reported the Handelsblatt newspaper.

The increase in wind and solar power and the decline in nuclear power have also reduced CO2 emissions. In the first half of 2019, electricity generation emitted around 15% less CO2 than in the same period last year, reported BDEW. However, the association demands that the further expansion of renewable energies should not be hampered. The target of 65% renewable energy can only be achieved if the further expansion of renewable energy sources is accelerated.


Related News

View more

Ontario introduces new fixed COVID-19 hydro rate

Ontario Electricity COVID-19 Recovery Rate sets a fixed price of 12.8 cents/kWh, replacing time-of-use billing and aligning costs across off-peak, mid-peak, and on-peak periods per Ontario Energy Board guidance through Oct. 31.


Key Points

A flat 12.8 cents/kWh electricity price in Ontario that temporarily replaces time-of-use rates from June 1 to Oct. 31.

✅ Fixed 12.8 cents/kWh, all hours, June 1 to Oct. 31

✅ Higher than off-peak 10.1, lower than mid/on-peak

✅ Based on Ontario Energy Board average cost


Ontario residents will now have to pay a fixed electricity price that is higher than the off-peak hydro rate many in the province have been allowed to pay so far due to the pandemic. 

The announcement, which was made in a news release on Saturday, comes after the Ontario government suspended the normal “time-of-use” billing system on March 24 and as electricity rates are about to change across Ontario. 

The government moved all customers onto the lowest winter rate in response to the pandemic as emergency measures meant more people would be at home during the middle of the day when electricity costs are the highest. 

Now, the government has introduced a new “COVID-19 recovery rate” of 12.8 cents per kilowatt hour at all times of the day. The fixed price will be in place from June 1 to Oct. 31. 

The fixed price is higher than the winter off-peak price, which stood at 10.1 per kilowatt hour. However, it is lower than the mid-peak rate of 14.4 per kilowatt hour and the high-peak rate of 20.8 per kilowatt hour, even though typical bills may rise as fixed pricing ends for many households. 

“Since March 24, 2020, we have invested just over $175 million to deliver emergency rate relief to residential, farm and small business electricity consumers by suspending time-of-use electricity pricing,” Greg Rickford, the minister of energy, northern development and mines, said in a news release. 

“This investment was made to protect the people of Ontario from a marked increase in electricity rates as they did their part by staying home to prevent the further spread of the virus.”

Rickford said that the COVID-19 recovery rate is based on the average cost of electricity set by the Ontario Energy Board. 

“This fixed rate will continue to suspend time-of-use prices in a fiscally responsible manner,” he said. "Consumers will have greater flexibility to use electricity when they need it without paying on-peak and mid-peak prices, and some may benefit from ultra-low electricity rates under new time-of-use options."


Related News

View more

Some old dams are being given a new power: generating clean electricity

Hydroelectric retrofits for unpowered dams leverage turbines to add renewable capacity, bolster grid reliability, and enable low-impact energy storage, supporting U.S. and Canada decarbonization goals with lower costs, minimal habitat disruption, and climate resilience.


Key Points

They add turbines to existing dams to make clean power, stabilize the grid, and offer low-impact storage at lower cost.

✅ Lower capex than new dams; minimal habitat disruption

✅ Adds firming and storage to support wind and solar

✅ New low-head turbines unlock more retrofit sites


As countries race to get their power grids off fossil fuels to fight climate change, there's a big push in the U.S. to upgrade dams built for purposes such as water management or navigation with a feature they never had before — hydroelectric turbines. 

And the strategy is being used in parts of Canada, too, with growing interest in hydropower from Canada supplying New York and New England.

The U.S. Energy Information Administration says only three per cent of 90,000 U.S. dams currently generate electricity. A 2012 report from the U.S. Department of Energy found that those dams have 12,000 megawatts (MW) of potential hydroelectric generation capacity. (According to the National Hydropower Association, 1 MW can power 750 to 1,000 homes. That means 12,000 MW should be able to power more than nine million homes.)

As of May 2019, there were projects planned to convert 32 unpowered dams to add 330 MW to the grid over the next several years.

One that was recently completed was the Red Rock Hydroelectric Project, a 60-year-old flood control dam on the Des Moines River in Iowa that was retrofitted in 2014 to generate 36.4 MW at normal reservoir levels, and up to 55 MW at high reservoir levels and flows. It started feeding power to the grid this spring, and is expected to generate enough annually to supply power to 18,000 homes.

It's an approach that advocates say can convert more of the grid from fossil fuels to clean energy, often with a lower cost and environmental impact than building new dams.

Hydroelectric facilities can also be used for energy storage, complementing intermittent clean energy sources such as wind and solar with pumped storage to help maintain a more reliable, resilient grid.

The Nature Conservancy and the World Wildlife Fund are two environmental groups that oppose new hydro dams because they can block fish migration, harm water quality, damage surrounding ecosystems and release methane and CO2, and in some regions, Western Canada drought has reduced hydropower output as reservoirs run low. But they say adding turbines to non-powered dams can be part of a shift toward low-impact hydro projects that can support expansion of solar and wind power.

Paul Norris, president of the Ontario Waterpower Association, said there's typically widespread community support for such projects in his province amid ongoing debate over whether Ontario is embracing clean power in its future plans. "Any time that you can better use existing assets, I think that's a good thing."

New turbine technology means water doesn't need to fall from as great a height to generate power, providing opportunities at sites that weren't commercially viable in the past, Norris said, with recent investments such as new turbines in Manitoba showing what is possible.

In Ontario, about 1,000 unpowered dams are owned by various levels of government. "With the appropriate policy framework, many of these assets have the potential to be retrofitted for small hydro," Norris wrote in a letter to Ontario's Independent Electricity System Operator this year as part of a discussion on small-scale local energy generation resources.

He told CBC that several such projects are already in operation, such as a 950 kW retrofit of the McLeod Dam at the Moira River in Belleville, Ont., in 2008. 

Four hydro stations were going to be added during dam refurbishment on the Trent-Severn Waterway, but they were among 758 renewable energy projects cancelled by Premier Doug Ford's government after his election in 2018, a move examined in an analysis of Ontario's dirtier electricity outlook and its implications.

Patrick Bateman, senior vice-president of Waterpower Canada, said such dam retrofit projects are uncommon in most provinces. "I don't see it being a large part of the future electricity generation capacity."

He said there has been less movement on retrofitting unpowered dams in Canada compared to the U.S., because:

There are a lot more opportunities in Canada to refurbish large, existing hydro-generating stations to boost capacity on a bigger scale.

There's less growth in demand for clean energy, because more of Canada's grid is already non-carbon-emitting (80 per cent) compared to the U.S. (40 per cent).

Even so, Norris thinks Canadians should be looking at all opportunities and options when it comes to transitioning the grid away from fossil fuels, including retrofitting non-powered dams, especially as a recent report highlights Canada's looming power problem over the coming decades.

"If we're going to be serious about addressing the inevitable challenges associated with climate change targets and net zero, it really is an all-of-the-above approach."


Related News

View more

Sign Up for Electricity Forum’s Newsletter

Stay informed with our FREE Newsletter — get the latest news, breakthrough technologies, and expert insights, delivered straight to your inbox.

Electricity Today T&D Magazine Subscribe for FREE

Stay informed with the latest T&D policies and technologies.
  • Timely insights from industry experts
  • Practical solutions T&D engineers
  • Free access to every issue

Live Online & In-person Group Training

Advantages To Instructor-Led Training – Instructor-Led Course, Customized Training, Multiple Locations, Economical, CEU Credits, Course Discounts.

Request For Quotation

Whether you would prefer Live Online or In-Person instruction, our electrical training courses can be tailored to meet your company's specific requirements and delivered to your employees in one location or at various locations.