New England Solar Interconnection Costs highlight distributed generation strains, transmission charges, distribution upgrades, and DAF fees as National Grid maps hosting capacity, driving queue delays and FERC disputes in Rhode Island and Massachusetts.
Key Points
Rising upfront grid upgrade and DAF charges for distributed solar in RI and MA, including some transmission costs.
✅ Upfront grid upgrades shifted to project developers
✅ DAF and transmission charges increase per MW costs
✅ Queue delays tied to hosting capacity and cluster studies
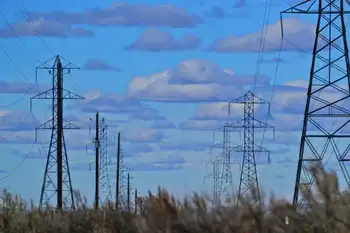
Solar developers in Rhode Island and Massachusetts say soaring charges to interconnect with the electric grid are threatening the viability of projects.
As more large-scale solar projects line up for connections, developers are being charged upfront for the full cost of the infrastructure upgrades required, a long-common practice that they say is now becoming untenable amid debates over a new solar customer charge in Nova Scotia.
“It is a huge issue that reflects an under-invested grid that is not ready for the volume of distributed generation that we’re seeing and that we need, particularly solar,” said Jeremy McDiarmid, vice president for policy and government affairs at the Northeast Clean Energy Council, a nonprofit business organization.
Connecting solar and wind systems to the grid often requires upgrades to the distribution system to prevent problems, such as voltage fluctuations and reliability risks highlighted by Australian distributors in their networks. Costs can vary considerably from place to place, depending on the amount of distributed generation coming online and the level of capacity planning by regulators, said David Feldman, a senior financial analyst at the National Renewable Energy Laboratory.
“Certainly the Northeast often has more distribution challenges than much of the rest of the country just because it’s more populous and often the infrastructure is older,” he said. “But it’s not unique to the Northeast — in the Midwest, for example, there’s a significant amount of wind projects in the queues and significant delays.”
In Rhode Island and Massachusetts, where strong incentive programs are driving solar development, the level of solar coming online is “exposing the under-investment in the distribution system that is causing these massive costs that National Grid is assigning to particular projects or particular groups of projects,” McDiarmid said. “It is going to be a limiting factor for how much clean energy we can develop and bring online.”
Frank Epps, chief executive officer at Energy Development Partners, has been developing solar projects in Rhode Island since 2010. In that time, he said, interconnection charges on his projects have grown from about $80,000-$120,000 per megawatt to more than $400,000 per megawatt. He attributed the increase to a lack of investment in the distribution network by National Grid over the last decade.
He and other developers say the utility is now adding further to their costs by passing along not just the cost of improving the distribution system — the equivalent of the city street of the grid that brings power directly to customers — but also costs for modifying the transmission system — the interstate highway that moves bulk power over long distances to substations.
Solar developers who are only requesting to hook into the distribution system, and not applying for transmission service, say they should not be charged for those additional upgrades under state interconnection rules unless they are properly authorized under the federal law that governs the transmission system.
A Rhode Island solar and wind developer filed a complaint with the Federal Energy Regulatory Commission in February over transmission system improvement charges for its four proposed solar projects. Green Development said National Grid subsidiaries Narragansett Electric and New England Power Company want to charge the company more than $500,000 a year in operating and maintenance expenses assessed as so-called direct assignment facility charges.
“This amount nearly doubles the interconnection costs associated with the projects,” which total 38.4 megawatts in North Smithfield, the company says in its complaint. “Crucially, these charges are linked to recovering costs associated with providing transmission service — even though no such transmission service is being provided to Green Development.”
But Ted Kresse, a spokesperson for National Grid, said the direct assignment facility, or DAF, construct has been in place for decades and has been applied to any customer affecting the need for transmission upgrades.
“It is the result of the high penetration and continued high volume of distributed generation interconnections that has recently prompted the need for transmission upgrades, and subsequently the pass-through of the associated DAF charges,” he said.
Several complaints before the Rhode Island Public Utilities Commission object to these DAF and other transmission charges.
One petition for dispute resolution concerns four solar projects totaling 40 MW being developed by Energy Development Partners in a former gravel pit in North Kingstown. Brown University has agreed to purchase the power.
The developer signed interconnection service agreements with Narragansett Electric in 2019 requiring payment of $21.6 million for costs associated with connecting the projects at a new Wickford Junction substation. Last summer, Narragansett sought to replace those agreements with new ones that reclassified a portion of the costs as transmission-level costs, through New England Power, National Grid’s transmission subsidiary.
That shift would result in additional operational and maintenance charges of $835,000 per year for the estimated 35-year life of the projects, the complaint says.
“This came as a complete shock to us,” Epps said. “We’re not just paying for the maintenance of a new substation. We are paying a share of the total cost that the system owner has to own and operate the transmission system. So all of the sudden, it makes it even tougher for distributed energy resources to be viable.”
In its response to the petition, National Grid argues that the charges are justified because the solar projects will require transmission-level upgrades at the new substation. The company argues that the developer should be responsible for the costs rather than ratepayers, “who are already supporting renewable energy development through their electric rates.”
Seth Handy, one of the lawyers representing Green Development in the FERC complaint, argues that putting transmission system costs on distribution assets is unfair because the distributed resources are “actually reducing the need to move electricity long distances. We’ve been fighting these fights a long time over the underestimating of the value of distributed energy in reducing system costs.”
Handy is also representing the Episcopal Diocese of Rhode Island before the state Supreme Court in its appeal of an April 2020 public utilities commission order upholding similar charges for a proposed 2.2-megawatt solar project at the diocese’s conference center and camp in Glocester.
Todd Bianco, principal policy associate at the utilities commission, said neither he nor the chairperson can comment on the pending dockets contesting these charges. But he noted that some of these issues are under discussion in another docket examining National Grid’s standards for connecting distributed generation. Among the proposals being considered is the appointment of an independent ombudsperson to resolve interconnection disputes.
Separately, legislation pending before the Rhode Island General Assembly would remove responsibility for administering the interconnection of renewable energy from utilities, and put it under the authority of the Rhode Island Infrastructure Bank, a financing agency.
Handy, who recently testified in support of the bill, said he believes National Grid has too many conflicting interests to administer interconnecting charges in a timely, transparent and fair fashion, and pointed to utility moves such as changes to solar compensation in other states as examples. In particular, he noted the company’s interests in expanding natural gas infrastructure.
“There are all kinds of economic interests that they have that conflict with our state policy to provide lower-cost renewable energy and more secure energy solutions,” Handy said.
In testimony submitted to the House Committee on Corporations opposing the legislation, National Grid said such powers are well beyond the purpose and scope of the infrastructure bank. And it cited figures showing Rhode Island is third in the country for the most installed solar per square mile (behind New Jersey and Massachusetts).
Nadav Enbar, program manager at the Electric Power Research Institute, a nonprofit research organization for the utility industry, said interconnection delays and higher costs are becoming more common due to “the incredible uptake” in distributed renewable energy, particularly solar.
That’s impacting hosting capacity, the room available to connect all resources to a circuit without causing adverse harm to reliability and safety.
“As hosting capacity is being reduced, it’s causing an increasing number of situations where utilities need to study their systems to guarantee interconnection without compromising their systems,” he said. “And that is the reason why you’re starting to see some delays, and it has translated into some greater costs because of the need for upgrades to infrastructure.”
The cost depends on the age or absence of infrastructure, projected load growth, the number of renewable energy projects in the queue, and other factors, he said. As utilities come under increasing pressure to meet state renewable goals, and as some states pilot incentives like a distributed energy rebate in Illinois to drive utility innovation, some (including National Grid) are beginning to provide hosting capacity maps that provide detailed information to developers and policymakers about the amount of distributed energy that can be accommodated at various locations on the grid, he said.
In addition, the coming availability of high-tech “smart inverters” should help ease some of these problems because they provide the grid with more flexibility when it comes to connecting and communicating with distributed energy resources, Enbar said.
In Massachusetts, the Department of Public Utilities has opened a docket to explore ways to better plan for and share the cost of upgrading distribution infrastructure to accommodate solar and other renewable energy sources as part of a grid overhaul for renewables nationwide. National Grid has been conducting “cluster studies” there that attempt to analyze the transmission impacts of a group of solar projects and the corresponding interconnection cost to each developer.
Kresse, of National Grid, said the company favors cost-sharing methodologies under consideration that would “provide a pathway to spread cost over the total enabled capacity from the upgrade, as opposed to spreading the cost over only those customers in the queue today.”
Solar developers want regulators to take an even broader approach that factors in how the deployment of renewables and the resulting infrastructure upgrades benefit not just the interconnecting generator, but all customers.
“Right now, if your project is the one that causes a multimillion-dollar upgrade, you are assigned that cost even though that upgrade is going to benefit a lot of other projects, as well as make the grid stronger,” said McDiarmid, of the clean energy council. “What we’re asking for is a way of allocating those costs among a variety of developers, as well as to the grid itself, meaning ratepayers. There’s a societal benefit to increasing the modernization of the grid, and improving the resilience of the grid.”
In the meantime, BlueHub Capital, a Boston-based solar developer focused on serving affordable housing developments, recently learned from National Grid that, as a part of one of the area studies, it will be required to pay $5.8 million in transmission and distribution upgrades to interconnect a 2-megawatt solar-plus-storage project that leverages cheaper batteries to enhance resilience, approved for a brownfield site in Gardner, Massachusetts.
According to testimony submitted to the department, the sum is supposed to be paid within the next year, even though the project will have to wait to be interconnected until April 2027, when a new transmission line is completed. In addition, BlueHub will be responsible for DAF charges totaling $3.4 million over the 20-year life of the project.
“We’re being asked to pay a fortune to provide solar that the state wants,” said DeWitt Jones, BlueHub’s president. “It’s so expensive that the upgrades are driving everyone out of the interconnection queue. The costs stay the same, but they fall on fewer projects. We need a process of grid design and modernization to guide this.”
Related News