BC Tidal Energy Micro-Grids harness predictable tidal currents to replace diesel in remote Indigenous coastal communities, integrating marine renewables, storage, and demand management for resilient off-grid power along Vancouver Island and Haida Gwaii.
Key Points
Community-run tidal turbines and storage deliver reliable, diesel-free electricity to remote B.C. coastal communities.
✅ Predictable power from tidal currents reduces diesel dependence
✅ Integrates storage, demand management, and microgrid controls
✅ Local jobs via marine supply chains and community ownership
Many remote West Coast communities are reliant on diesel for electricity generation, which poses a number of negative economic and environmental effects.
But some sites along B.C.’s extensive coastline are ideal for tidal energy micro-grids that may well be the answer for off-grid communities to generate clean power, suggested experts at a COAST (Centre for Ocean Applied Sustainable Technologies) virtual event Wednesday.
There are 40 isolated coastal communities, many Indigenous communities, and 32 of them are primarily reliant on diesel for electricity generation, said Ben Whitby, program manager at PRIMED, a marine renewable energy research lab at the University of Victoria (UVic).
Besides being a costly and unreliable source of energy, there are environmental and community health considerations associated with shipping diesel to remote communities and running generators, Whitby said.
“It's not purely an economic question,” he said.
“You've got the emissions associated with diesel generation. There's also the risks of transporting diesel … and sometimes in a lot of remote communities on Vancouver Island, when deliveries of diesel don't come through, they end up with no power for three or four days at a time.”
The Heiltsuk First Nation, which suffered a 110,000-litre diesel spill in its territorial waters in 2016, is an unfortunate case study for the potential environmental, social, and cultural risks remote coastal communities face from the transport of fossil fuels along the rough shoreline.
A U.S. barge hauling fuel for coastal communities in Alaska ran aground in Gale Pass, fouling a sacred and primary Heiltsuk food-harvesting area.
There are a number of potential tidal energy sites near off-grid communities along the mainland, on both sides of Vancouver Island, and in the Haida Gwaii region, Whitby said.
Tidal energy exploits the natural ebb and flow of the coast’s tidal water using technologies like underwater kite turbines to capture currents, and is a highly predictable source of renewable energy, he said.
Micro-grids are self-reliant energy systems drawing on renewables from ocean, wave power resources, wind, solar, small hydro, and geothermal sources.
The community, rather than a public utility like BC Hydro, is responsible for demand management, storage, and generation with the power systems running independently or alongside backup fuel generators — offering the operators a measure of energy sovereignty.
Depending on proximity, cost, and renewable solutions, tidal energy isn’t necessarily the solution for every community, Whitby noted, adding that in comparison to hydro, tidal energy is still more expensive.
However, the best candidates for tidal energy are small, off-grid communities largely dependent on costly fossil fuels, Whitby said.
“That's really why the focus in B.C. is at a smaller scale,” he said.
“The time it would take (these communities) to recoup any capital investment is a lot shorter.
“And the cost is actually on a par because they're already paying a significant amount of money for that diesel-generated power.”
Lisa Kalynchuk, vice-president of research and innovation at UVic, said she was excited by the possibilities associated with tidal power, not only in B.C., but for all of Canada’s coasts.
“Canada has approximately 40,000 megawatts available on our three coastlines,” Kalynchuk said.
“Of course, not all this power can be realized, but it does exist, so that leads us to the hard part — tapping into this available energy and delivering it to those remote communities that need it.”
Challenges to establishing tidal power include the added cost and complexity of construction in remote communities, the storage of intermittent power for later use, the economic model, though B.C.’s streamlined regulatory process may ease approvals, the costs associated with tidal power installations, and financing for small communities, she said.
But smaller tidal energy projects can potentially set a track record for more nascent marine renewables, as groups like Marine Renewables Canada pivot to offshore wind development, at a lower cost and without facing the same social or regulatory resistance a large-scale project might face.
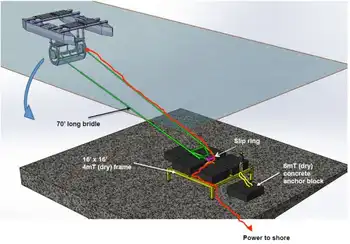
A successful tidal energy demo project was set up using a MAVI tidal turbine in Blind Channel to power a private resort on West Thurlow Island, part of the outer Discovery Islands chain wedged between Vancouver Island and the mainland, Whitby said.
The channel’s strong tidal currents, which routinely reach six knots and are close to the marina, proved a good site to test the small-scale turbine and associated micro-grid system that could be replicated to power remote communities, he said.
The mooring system, cable, and turbine were installed fairly rapidly and ran through the summer of 2017. The system is no longer active as provincial and federal funding for the project came to an end.
“But as a proof of concept, we think it was very successful,” Whitby said, adding micro-grid tidal power is still in the early stages of development.
Ideally, the project will be revived with new funding, so it can continue to act as a test site for marine renewable energy and to showcase the system to remote coastal communities that might want to consider tidal power, he said.
In addition to harnessing a local, renewable energy source and increasing energy independence, tidal energy micro-grids can fuel employment and new business opportunities, said Whitby.
The Blind Channel project was installed using the local supply chain out of nearby Campbell River, he said.
“Most of the vessels and support came from that area, so it was all really locally sourced.”
Funding from senior levels of government would likely need to be provided to set up a permanent tidal energy demonstration site, with recent tidal energy investments in Nova Scotia offering a model, or to help a community do case studies and finance a project, Whitby said.
Both the federal and provincial governments have established funding streams to transition remote communities away from relying on diesel.
But remote community projects funded federally or provincially to date have focused on more established renewables, such as hydro, solar, biomass, or wind.
The goal of B.C.’s Remote Community Energy Strategy, part of the CleanBC plan and aligned with zero-emissions electricity by 2035 targets across Canada, is to reduce diesel use for electricity 80 per cent by 2030 by targeting 22 of the largest diesel locations in the province, many of which fall along the coast.
The province has announced a number of significant investments to shift Indigenous coastal communities away from diesel-generated electricity, but they predominantly involve solar or hydro projects.
A situation that’s not likely to change, as the funding application guide in 2020 deemed tidal projects as ineligible for cash.
Yet, the potential for establishing tidal energy micro-grids in B.C. is good, Kalynchuk said, noting UVic is a hub for significant research expertise and several local companies, including ocean and river power innovators working in the region, are employing and developing related service technologies to install and maintain the systems.
“It also addresses our growing need to find alternative sources of energy in the face of the current climate crisis,” she said.
“The path forward is complex and layered, but one essential component in combating climate change is a move away from fossil fuels to other sources of energy that are renewable and environmentally friendly.”
Related News