San Carlos program aims to increase solar power use

By Knight Ridder Tribune


High Voltage Maintenance Training Online

Our customized live online or in‑person group training can be delivered to your staff at your location.

  • Live Online
  • 12 hours Instructor-led
  • Group Training Available
Regular Price:
$599
Coupon Price:
$499
Reserve Your Seat Today
San Carlos wants residents and business owners to get some sun this summer - and protect the environment in the process.

The city has partnered with Foster City-based SolarCity, a company that installs solar power systems at homes and businesses, to get people to sign up for such installations by August 27.

SolarCity officials said the goal in San Carlos is to get at least 15 to 20 homes to go solar by offering a discount of up to 20 percent on the installation price. The goal is based on market studies that take into account demographics and SolarCity's past sales history for the San Carlos area. Those who sign up early will be entered into a drawing to receive an additional $3,000 discount on the price.

City officials saw how similar programs have worked in other Bay Area communities and wanted to try it in San Carlos, Mayor Tom Davids said.

"It is for the environment as well as (people's) own pocketbooks," Davids said. Solar power is a renewable energy source, and it reduces global warming, SolarCity CEO Lyndon Rive said.

"It's more efficient," said Sy Tong, a contractor who builds custom homes around the Bay Area. One of his latest projects is a home in Los Altos Hills that is using SolarCity to install a solar system. "It's trendy. Everyone wants to put solar panels in," Tong said.

In a similar program in Mountain View, SolarCity's goal was to get 40 homeowners to switch to solar power. It ended up installing solar systems on 120 homes, Rive said.

In San Jose, the goal was 40 homes, and now with two weeks left in that city's program, 52 homeowners have signed up. SolarCity has also offered similar programs in Menlo Park, Portola Valley, Atherton and Woodside. "We have been very effective in other cities," Rive said. Financing solar systems makes the most sense, Rive said.

If someone pays cash for a system, which can cost $15,000 to $25,000 with the incentives, it would take nine to 12 years to recoup the costs, but if someone finances it, he or she would break even because of how much money solar power saves. The incentives include a tax credit for businesses of up to 30 percent of a solar system's cost and a 25 percent rebate on the system's installation for residents.

Related News

U.S. Residents Averaged Fewer Power Outages in 2022

2022 U.S. Power Outage Statistics show lower SAIDI as fewer major events hit, with SAIFI trends, electric reliability, outage duration and frequency shaped by hurricanes, winter storms, vegetation, and utility practices across states.


Key Points

They report SAIDI and SAIFI for 2022, showing outage duration, frequency, and impacts of major weather events.

✅ 2022 SAIDI averaged 5.6 hours; SAIFI averaged 1.4 interruptions.

✅ Fewer major events lowered outage duration versus 2021.

✅ Hurricanes and winter storms drove long outages in several states.


In 2022, U.S. electricity consumers on average experienced about 5.5 hours of power disruptions, a decrease from nearly two hours compared to 2021. This information comes from the latest Annual Electric Power Industry Report. The reduction in yearly power interruptions primarily resulted from fewer significant events in 2022 compared to the previous year, and utility disaster planning continues to support grid resilience as severe weather persists.

Since 2013, excluding major events, the annual average duration of power interruptions has consistently hovered around two hours. Factors contributing to major power disruptions include weather-related incidents, vegetation interference near power lines, and specific utility practices, while pandemic-related grid operations influenced workforce planning more than outage frequency. To assess the reliability of U.S. electric utilities, two key indexes are utilized:

  • The System Average Interruption Duration Index (SAIDI) calculates the total length (in hours) an average customer endures non-brief power interruptions over a year.
  • The System Average Interruption Frequency Index (SAIFI) tracks the number of times interruptions occur.

The influence of major events on electrical reliability is gauged by comparing affected states' SAIDI and SAIFI values against the U.S. average, which was 5.6 hours of outages and 1.4 outages per customer in 2022. The year witnessed 18 weather-related disasters in the U.S., each resulting in over $1 billion in damages, and COVID-19 grid assessments indicated the electricity system was largely safe from pandemic impacts. Noteworthy major events include:

  • Hurricane Ian in September 2022, leaving over 2.6 million Floridian customers without electricity, with restoration in some areas taking weeks rather than days.
  • Hurricane Nicole in November 2022, causing over 300,000 Florida customers to lose power.
  • Winter Storm Elliott in December 2022, affecting over 1.5 million customers in multiple states including Texas where utilities struggled after Hurricane Harvey to restore service, and Florida, and bringing up to four feet of snow in parts of New York.

In 2022, states like Florida, West Virginia, Maine, Vermont, and New Hampshire experienced the most prolonged power interruptions, with New Hampshire averaging 10.3 hours and Florida 19.1 hours, and FPL's Irma storm response illustrates how restoration can take days or weeks in severe cases. Conversely, the District of Columbia, Delaware, Rhode Island, Nebraska, and Iowa had the shortest total interruptions, with the District of Columbia averaging just 34 minutes and Iowa 85 minutes.

The frequency of outages, unlike their duration, is more often linked to non-major events. Across the nation, Alaska recorded the highest number of power disruptions per customer (averaging 3.5), followed by several heavily forested states like Tennessee and Maine. Power outages due to falling tree branches are common, particularly during winter storms that burden tree limbs and power lines, as seen in a North Seattle outage affecting 13,000 customers. The District of Columbia stood out with the shortest and fewest outages per customer.


Related News

View more

Alberta's electricity rebate program extended until December

Alberta Electricity Rebate Extension provides $50 monthly credits, utility bill relief, and an natural gas rebate, supporting homes, farms, and small businesses with energy costs through December 2022, capped at 250 MWh per year.


Key Points

A provincial program extending $50 credits and energy relief, with a natural gas rebate for eligible consumers in 2022.

✅ Up to $300 in bill credits; auto-applied to eligible accounts

✅ Applies to whole bill; limit 250 MWh/year consumption

✅ Natural gas rebate triggers above $6.50/GJ Oct-Mar 2023


Alberta's electricity rebate program has been extended by three months amid an electricity price spike in Alberta, and will now be in effect until the end of December, the government said.

The program was originally to provide more than 1.9 million homes, farms and small businesses with $50 monthly credits on their electricity bills, complementing a consumer price cap on power bills, for July, August and September. It will now also cover the final three months of 2022.

Those eligible for the rebate could receive up to $300 in credits until the end of December, a relief for Alberta ratepayers facing deferral costs.

The program, designed to provide relief to Albertans hit hard by high utility bills and soaring energy prices, will cost the Alberta government $600 million.

Albertans who have consumed electricity within the past calendar year, up to a maximum of 250 megawatt hours per year, are eligible for the rebates, which will be automatically applied to consumer bills, as seen in Ontario electricity bill support initiatives.

The rebates will apply to the entire bill, similar to a lump-sum credit in Newfoundland and Labrador, not just the energy portion, the government said. The rebates will be automatic and no application will be needed.

Starting October, the government will enact a natural gas rebate program until March 2023 that will kick in when prices exceed $6.50 per gigajoule, and Alberta's consumer price cap on electricity will remain in place.


Related News

View more

Annual U.S. coal-fired electricity generation will increase for the first time since 2014

U.S. coal-fired generation 2021 rose as higher natural gas prices, stable coal costs, and a recovering power sector shifted the generation mix; capacity factors rebounded despite low coal stocks and ongoing plant retirements.


Key Points

Coal output rose 22% on high gas prices and higher capacity factors; a 5% decline is expected in 2022.

✅ Natural gas delivered cost averaged $4.93/MMBtu, more than double 2020

✅ Coal capacity factor rose to ~51% from 40% in 2020

✅ 2022 coal generation forecast to fall about 5%


We expect 22% more U.S. coal-fired generation in 2021 than in 2020, according to our latest Short-Term Energy Outlook (STEO). The U.S. electric power sector has been generating more electricity from coal-fired power plants this year as a result of significantly higher natural gas prices and relatively stable coal prices, even as non-fossil sources reached 40% of total generation. This year, 2021, will yield the first year-over-year increase in coal generation in the United States since 2014, highlighted by a January power generation jump earlier in the year.

Coal and natural gas have been the two largest sources of electricity generation in the United States. In many areas of the country, these two fuels compete to supply electricity based on their relative costs and sensitivity to policies and gas prices as well. U.S. natural gas prices have been more volatile than coal prices, so the cost of natural gas often determines the relative share of generation provided by natural gas and coal.

Because natural gas-fired power plants convert fuel to electricity more efficiently than coal-fired plants, record natural gas generation has at times underscored that advantage, and natural gas-fired generation can have an economic advantage even if natural gas prices are slightly higher than coal prices. Between 2015 and 2020, the cost of natural gas delivered to electric generators remained relatively low and stable. This year, however, natural gas prices have been much higher than in recent years. The year-to-date delivered cost of natural gas to U.S. power plants has averaged $4.93 per million British thermal units (Btu), more than double last year’s price.

The overall decline in electricity demand in 2020 and record-low natural gas prices led coal plants to significantly reduce the percentage of time that they generated power. In 2020, the utilization rate (known as the capacity factor) of U.S. coal-fired generators averaged 40%. Before 2010, coal capacity factors routinely averaged 70% or more. This year’s higher natural gas prices have increased the average coal capacity factor to about 51%, which is almost the 2018 average, a year when wind and solar reached 10% nationally.

Although rising natural gas prices have resulted in more U.S. coal-fired generation than last year, this increase in coal generation will most likely not continue as solar and wind expand in the generation mix. The electric power sector has retired about 30% of its generating capacity at coal plants since 2010, and no new coal-fired capacity has come online in the United States since 2013. In addition, coal stocks at U.S. power plants are relatively low, and production at operating coal mines has not been increasing as rapidly as the recent increase in coal demand. For 2022, we forecast that U.S. coal-fired generation will decline about 5% in response to continuing retirements of generating capacity at coal power plants and slightly lower natural gas prices.


Related News

View more

Utilities see benefits in energy storage, even without mandates

Utility Battery Storage Rankings measure grid-connected capacity, not ownership, highlighting MW, MWh, and watts per customer across PJM, MISO, and California IOUs, featuring Duke Energy, IPL, ancillary services, and frequency regulation benefits.


Key Points

Rankings that track energy storage connected to utility grids, comparing MW, MWh, and W/customer rather than ownership.

✅ Ranks by MW, MWh, and watts per customer, not asset ownership

✅ Highlights PJM, MISO cases and California IOUs' deployments

✅ Examples: Duke Energy, IPL, IID; ancillary services, frequency response


The rankings do not tally how much energy storage a utility built or owns, but how much was connected to their system. So while IPL built and owns the storage facility in its territory, Duke does not own the 16 MW of storage that connected to its system in 2016. Similarly, while California’s utilities are permitted to own some energy storage assets, they do not necessarily own all the storage facilities connected to their systems.

Measured by energy (MWh), IPL ranked fourth with 20 MWh, and Duke Energy Ohio ranked eighth with 6.1 MWh.

Ranked by energy storage watts per customer, IPL and Duke actually beat the California utilities, ranking fifth and sixth with 42 W/customer and 23 W/customer, respectively.

Duke ready for next step

Given Duke’s plans, including projects in Florida that are moving ahead, the utility is likely to stay high in the rankings and be more of a driving force in development. “Battery technology has matured, and we are ready to take the next step,” Duke spokesman Randy Wheeless told Utility Dive. “We can go to regulators and say this makes economic sense.”

Duke began exploring energy storage in 2012, and until now most of its energy storage efforts were focused on commercial projects in competitive markets where it was possible to earn revenues. Those included its 36 MW Notrees battery storage project developed in partnership with the Department of Energy in 2012 that provides frequency regulation for the Electric Reliability Council of Texas market and two 2 MW storage projects at its retired W.C. Beckjord plant in New Richmond, Ohio, that sells ancillary services into the PJM Interconnection market.

On the regulated side, most of Duke’s storage projects have had “an R&D slant to them,” Wheeless said, but “we are moving beyond the R&D concept in our regulated territory and are looking at storage more as a regulated asset.”

“We have done the demos, and they have proved out,” Wheeless said. Storage may not be ready for prime time everywhere, he said, but in certain locations, especially where it can it can be used to do more than one thing, it can make sense.

Wheeless said Duke would be making “a number of energy storage announcements in the next few months in our regulated states.” He could not provide details on those projects.

More flexible resources
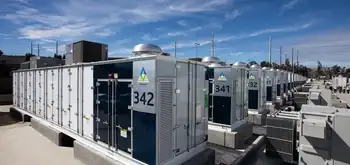
Location can be a determining factor when building a storage facility. For IPL, serving the wholesale market was a driving factor in the rationale to build its 20 MW, 20 MWh storage facility in Indianapolis.

IPL built the project to address a need for more flexible resources in light of “recent changes in our resource mix,” including decreasing coal-fired generation and increasing renewables and natural gas-fired generation, as other regions plan to rely on battery storage to meet rising demand, Joan Soller, IPL’s director of resource planning, told Utility Dive in an email. The storage facility is used to provide primary frequency response necessary for grid stability.

The Harding Street storage facility in May. It was the first energy storage project in the Midcontinent ISO. But the regulatory path in MISO is not as clear as it is in PJM, whereas initiatives such as Ontario storage framework are clarifying participation. In November, IPL with the Federal Energy Regulatory Commission, asking the regulator to find that MISO’s rules for energy storage are deficient and should be revised.

Soller said IPL has “no imminent plans to install energy storage in the future but will continue to monitor battery costs and capabilities as potential resources in future Integrated Resource Plans.”

California legislative and regulatory push

In California, energy storage did not have to wait for regulations to catch up with technology. With legislative and regulatory mandates, including CEC long-duration storage funding announced recently, as a push, California’s IOUs took high places in SEPA’s rankings.

Southern California Edison and San Diego Gas & Electric were first and fourth (63.2 MW and 17.2 MW), respectively, in terms of capacity. SoCal Ed and SDG&E were first and second (104 MWh and 28.4 MWh), respectively, and Pacific Gas and Electric was fifth (17 MWh) in terms of energy.

But a public power utility, the Imperial Irrigation District (IID), ended up high in the rankings – second in capacity (30 MW) and third  in energy (20 MWh) – even though as a public power entity it is not subject to the state’s energy storage mandates.

But while IID was not under state mandate, it had a compelling regulatory reason to build the storage project. It was part of a settlement reached with FERC over a September 2011 outage, IID spokeswoman Marion Champion said.

IID agreed to a $12 million fine as part of the settlement, of which $9 million was applied to physical improvements of IID’s system.

IID ended up building a 30 MW, 20 MWh lithium-ion battery storage system at its El Centro generating station. The system went into service in October 2016 and in May, IID used the system’s 44 MW combined-cycle natural gas turbine at the generating station.

Passing savings to customers
The cost of the storage system was about $31 million, and based on its experience with the El Centro project, Champion said IID plans to add to the existing batteries. “We are continuing to see real savings and are passing those savings on to our customers,” she said.

Champion said the battery system gives IID the ability to provide ancillary services without having to run its larger generation units, such as El Centro Unit 4, at its minimum output. With gas prices at $3.59 per million British thermal units, it costs about $26,880 a day to run Unit 4, she said.

IID’s territory is in southeastern California, an area with a lot of renewable resources. IID is also not part of the California ISO and acts as its own balancing authority. The battery system gives the utility greater operational flexibility, in addition to the ability to use more of the surrounding renewable resources, Champion said.

In May, IID’s board gave the utility’s staff approval to enter into contract negotiations for a 7 MW, 4 MWh expansion of its El Centro storage facility. The negotiations are ongoing, but approval could come in the next couple months, Champion said.

The heart of the issue, though, is “the ability of the battery system to lower costs for our ratepayers,” Champion said. “Our planning section will continue to utilize the battery, and we are looking forward to its expansion,” she said.” I expect it will play an even more important role as we continue to increase our percentage of renewables.”


Related News

View more

Japanese utilities buy into vast offshore wind farm in UK

Japan Offshore Wind Investment signals Japanese utilities entering UK offshore wind, as J-Power and Kansai Electric buy into Innogy's Triton Knoll, leveraging North Sea expertise, 9.5MW turbines, and 15-year fixed-rate contracts.


Key Points

Japanese utilities buying UK offshore wind stakes to import expertise, as J-Power and Kansai join Innogy's Triton Knoll.

✅ $900M deal: J-Power 25%, Kansai Electric ~16% in Innogy unit

✅ Triton Knoll: 860MW, up to 90 9.5MW turbines, 15-year fixed PPA

✅ Goal: Transfer North Sea expertise to develop Japan offshore wind


Two of Japan's biggest power companies will buy around 40% of a German-owned developer of offshore wind farms in the U.K., seeking to learn from Britain's lead in this sector, as highlighted by a UK offshore wind milestone this week, and bring the know-how back home.

Tokyo-based Electric Power Development, better known as J-Power, will join Osaka regional utility Kansai Electric Power in investing in a unit of Germany's Innogy.

The deal, estimated to be worth around $900 million, will give J-Power a 25% stake and Kansai Electric a roughly 16% share. It will mark the first investment in an offshore wind project by Japanese power companies, as other markets shift strategies, with Poland backing wind over nuclear signaling broader momentum.

Innogy plans to start up the 860-megawatt Triton Knoll offshore wind project -- one of the biggest of its kind in the world -- in the North Sea in 2021. The vast installation will have up to 90 9.5MW turbines and sell its output to local utilities under a 15-year fixed-rate contract.

J-Power, which supplies mainly fossil-fuel-based electricity to Japanese regional utilities, will set up a subsidiary backed by the government-run Development Bank of Japan to participate in the Innogy project. Engineers will study firsthand construction and maintenance methods.

While land-based wind turbines are proliferating worldwide, offshore wind farms have progressed mainly in Europe, though U.S. offshore wind competitiveness is improving in key markets. Installed capacity totaled more than 18,000MW at the end of 2017, which at maximum capacity can produce as much power as 18 nuclear reactors.

Japan has hardly any offshore wind farms in commercial operation, and has little in the way of engineering know-how in this field or infrastructure for linking such installations to the land power grid, with a recent Japan grid blackout analysis underscoring these challenges. But there are plans for a total of 4,000MW of offshore wind power capacity, including projects under feasibility studies.

J-Power set up a renewable energy division in June to look for opportunities to expand into wind and geothermal energy in Japan, and efforts like a Japan hydrogen energy system are emerging to support decarbonization. Kansai Electric also seeks know-how for increasing its reliance on renewable energy, even as it hurries to restart idled nuclear reactors.

They are not the only Japanese investors is in this field. In Asia, trading house Marubeni will invest in a Taiwanese venture with plans for a 600MW offshore wind farm.


Related News

View more

Europe's EV Slump Sounds Alarm for Climate Goals

Europe EV Sales Slowdown signals waning incentives, economic uncertainty, and supply chain constraints, threatening climate targets and net-zero emissions goals while highlighting the need for charging infrastructure, affordable batteries, and policy support across key markets.


Key Points

Europe's early-2024 EV registrations fell as incentives waned and supply gaps persisted, putting climate targets at risk.

✅ Fewer subsidies and tax breaks cut EV affordability

✅ Inflation and recession fears dampen car purchases

✅ Supply-chain and lithium constraints limit availability


A recent slowdown in Europe's electric vehicle (EV) sales raises serious concerns about the region's ability to achieve its ambitious climate targets.  After years of steady growth, new EV registrations declined in key markets like Norway, Germany, and the U.K. in early 2024. Experts are warning that this slump jeopardizes the transition away from fossil fuels and could undermine Europe's commitment to a net-zero emissions future.


Factors Behind the Decline

Several factors are contributing to the slowdown in EV sales:

  • Reduced Incentives: Many European countries have scaled back generous subsidies and tax breaks for EV purchases. While these incentives played a crucial role in driving early adoption, their reduction has made EVs less financially attractive for some consumers, with many U.K. buyers citing higher prices even after discounts.
  • End of ICE Ban Support: Public support for phasing out gasoline and diesel-powered cars by 2035, a key European Union policy, appears to be waning in some areas. Without robust support for this measure, consumers may be less inclined to embrace the transition to electric vehicles.
  • Economic Uncertainty: Rising inflation and fears of a recession in Europe have made consumers hesitant to invest in big-ticket purchases like new cars, regardless of fuel type. This economic uncertainty is impacting both electric and conventional vehicle sales.
  • Supply Chain Constraints: Ongoing supply chain disruptions and shortages of raw materials like lithium continue to impact the availability of affordable electric vehicles. This means potential buyers face long wait times or inflated prices even when they're ready to embrace EVs.


Consequences for Europe's Green Agenda

The decline in EV sales threatens Europe's plans to reduce carbon emissions and become the first climate-neutral continent by 2050, aligning with a broader push for electricity to address the climate dilemma across Europe. The transportation sector is a major contributor to greenhouse gas emissions, and the rapid electrification of vehicles is a pillar of Europe's decarbonization strategy.

The current slump highlights the need for continued policy support for the EV market, as EVs still trail gas models in many markets today, to ensure long-term growth and affordability for consumers. Without action, experts fear that Europe may find itself locked into a dependence on fossil fuels for decades to come, making its climate targets unreachable.


A Global Concern

Europe is a leader in electric vehicle policies and technology, during a period when global EV sales climbed markedly. The recent slowdown, however, sends a worrying signal to other regions around the world aiming to accelerate their transition to electric vehicles, including the U.S. market's Q1 dip as a cautionary example. It underscores the importance of sustained government support, investment in charging infrastructure and overcoming supply chain challenges to secure a future of widespread electric vehicle use, with many forecasts suggesting mass adoption within a decade if support continues.


Related News

View more

Sign Up for Electricity Forum’s Newsletter

Stay informed with our FREE Newsletter — get the latest news, breakthrough technologies, and expert insights, delivered straight to your inbox.

Electricity Today T&D Magazine Subscribe for FREE

Stay informed with the latest T&D policies and technologies.
  • Timely insights from industry experts
  • Practical solutions T&D engineers
  • Free access to every issue

Live Online & In-person Group Training

Advantages To Instructor-Led Training – Instructor-Led Course, Customized Training, Multiple Locations, Economical, CEU Credits, Course Discounts.

Request For Quotation

Whether you would prefer Live Online or In-Person instruction, our electrical training courses can be tailored to meet your company's specific requirements and delivered to your employees in one location or at various locations.