Substation Relay Protection Training
Our customized live online or in‑person group training can be delivered to your staff at your location.

- Live Online
- 12 hours Instructor-led
- Group Training Available
Regular Price:
$699
Coupon Price:
$599
VANCOUVER
—
BC Fossil Fuel Phase-Out outlines a just transition to a green economy, meeting climate targets by mid-century through carbon budgets, ending subsidies for fracking, capping production, and investing in renewable energy, remediation, and resilient infrastructure.
The Important Points
A strategic plan to wind down oil and gas, end subsidies, and achieve climate targets with a just transition in BC.
Sets carbon budgets and fossil fuel production caps
Ends subsidies for fracking and new fossil projects
Imposes a moratorium on new oil and gas leases
Invests in renewables, grid upgrades, and resilient infrastructure
Funds worker transition, remediation of mines and orphaned wells
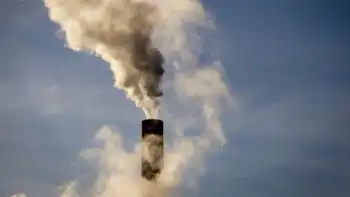
Politicians in British Columbia aren't focused enough on phasing out fossil fuel industries, a new report says.
The report, authored by the left-leaning Canadian Centre for Policy Alternatives, says the province must move away from fossil fuel industries by mid-century in order to meet its climate targets, with B.C. projected to fall short of 2050 targets according to recent analysis, but adds that the B.C. government is ill prepared to transition to a green economy.
"We are totally moving in the wrong direction," said economist Marc Lee, one of the authors of the report, on The Early Edition Wednesday.
He said most of the emphasis of B.C. government policy has been on slowing reductions in emissions from transportation or emissions from buildings, even though Canada will need more electricity to hit net-zero according to the IEA, while still subsidizing fossil fuel extraction, such as fracking projects, that Lee said should be phased out.
"What we are putting on the table is politically unthinkable right now," said Lee, adding that last month's provincial budget called for a 26 per cent increased gas production over the next three years, even though electrified LNG facilities could boost demand for clean power.
B.C.'s $830M in fossil fuel subsidies undermines efforts to fight climate crisis, report says
He said B.C. needs to start thinking instead about how its going to wind down its dependence on fossil fuel industries.
'Greener' job transition needed
The report said the provincial government's continued interest in expanding production and exporting fossil fuels, even as Canada's race to net-zero intensifies across the energy sector, suggests little political will to think about a plan to move away from them.
It suggests the threat of major job losses in those industries is contributing to the political inaction, but cited several examples of ways governments can help move workers into greener jobs, as many fossil-fuel workers are ready to support the transition according to recent commentary.
Lee said early retirement provisions or income replacement for transitioning workers are options to consider.
"We actually have seen a lot of real-world policy around transition starting to happen, including in Alberta, which brought in a whole transition package for coal workers producing coal for electricity generation, and regional cooperation like bridging the electricity gap between Alberta and B.C. could further support reliability," Lee said.
Give cities the power to move more quickly on the environment, say Metro Van politicians
Make it easier for small businesses to go green, B.C. Chamber of Commerce urges government
Lee also said well-paying jobs could be created by, for example, remediating old coal mines and gas wells and building green infrastructure and renewable electricity projects in affected areas.
The report also calls for a moratorium on new fossil fuel leases and ending fossil fuel subsidies, as well as creating carbon budgets and fossil fuel production limits.
"Change is coming," said Lee. "We need to get out ahead of it."
Related News
Related News

Ontario Businesses To See Full Impact of 2021 Electricity Rate Reductions
Ontario Comprehensive Electricity Plan delivers Global Adjustment reductions for industrial and commercial non-RPP customers, lowering…
View more
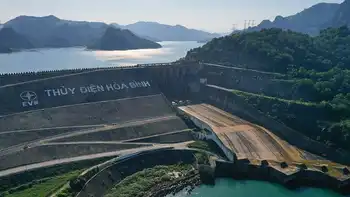
Construction of expanded Hoa Binh Hydropower Plant to start October 2020
Expanded Hoa Binh Hydropower Plant increases EVN capacity with 480MW turbines, commercial loan financing, grid…
View more

Military Is Ramping Up Preparation For Major U.S. Power Grid Hack
DARPA RADICS Power Grid Security targets DoD resilience to cyber attacks, delivering early warning, detection,…
View more
Nuclear alert investigation won't be long and drawn out, minister says
Pickering Nuclear False Alert Investigation probes Ontario's emergency alert system after a provincewide cellphone, radio,…
View more

FortisAlberta Takes Necessary Precautions to Provide Electricity Service for Alberta
FortisAlberta COVID-19 response delivers safe electricity distribution across Alberta, with remote monitoring, 24/7 support, outage…
View more
Hydro One employees support Province of Ontario in the fight against COVID-19
Hydro One COVID-19 Quarantine Support connects Ontario's Ministry of Health with trained customer service teams…
View more
Sign Up for Electricity Forum’s Newsletter
Stay informed with our FREE Newsletter — get the latest news, breakthrough technologies, and expert insights, delivered straight to your inbox.
Electricity Today T&D Magazine Subscribe for FREE

Stay informed with the latest T&D policies and technologies.
- Timely insights from industry experts
- Practical solutions T&D engineers
- Free access to every issue
