California allows electric school buses only from 2035


school bus

Protective Relay Training - Basic

Our customized live online or in‑person group training can be delivered to your staff at your location.

  • Live Online
  • 12 hours Instructor-led
  • Group Training Available
Regular Price:
$699
Coupon Price:
$599
Reserve Your Seat Today

California Electric School Bus Mandate 2035 sets zero-emission requirements, outlines funding, state reimbursement, fleet electrification, infrastructure, and cost estimates, highlighting exemptions for frontier districts and alignment with clean transportation and climate policy goals.


Key Points

California's 2035 policy requires all new school buses be zero-emission, with funding and limited rural exemptions.

✅ Mandates zero-emission purchases for new school buses from 2035

✅ Estimates $5B transition cost with state reimbursement support

✅ Frontier districts may apply for 5-year extensions


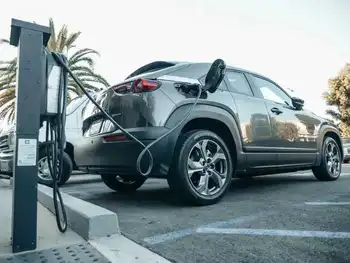
California Governor Gavin Newsom has signed a new legislation requiring that from 2035, all newly ordered or contracted school buses must be zero-emission, a move aligned with California's push for expanded EV grid capacity statewide.

The state estimates that switching to electric school buses will cost around five billion dollars over the next decade, a projection reflecting electric bus challenges seen globally. That is because a diesel equivalent costs about 200,000 dollars less than a battery-electric version, as highlighted by critical analyses of California policy. And “the California Constitution requires the state to reimburse local agencies and school districts for certain costs mandated by the state.”

There are about 23,800 school buses on the road in California. About 500 are already electric, with conversion initiatives expected to expand the total, and 2,078 electric buses have been ordered.

There are – as always- exceptions to the rule. So-called “frontier districts,” which have less than 600 students or are in a county with a population density of less than ten persons per square mile, can file for a five-year extension, drawing on lessons from large electric bus fleets about route length and charging constraints. However, they must “reasonably demonstrate that a daily planned bus route for transporting pupils to and from school cannot be serviced through available zero-emission technology in 2035.”

Califonia is the fifth US state to mandate electric school buses, and jurisdictions like British Columbia are deploying electric school buses as well. Connecticut, Maryland, Maine, and New York implemented similar legislation, while California continues broader zero-emission freight adoption with Volvo VNR electric trucks entering service across the state.


Related News

Related News

IEA: Clean energy investment significantly outpaces fossil fuels

Clean Energy Investment is surging as renewables, electric vehicles, grids, storage, and nuclear outpace fossil fuels, driven by energy security, affordability, and policies like the Inflation Reduction Act, the IEA's World Energy Investment report shows.


Key Points

Investment in renewables, EVs, grids, and storage now surpasses fossil fuels amid cost and security pressures.

✅ $1.7T to clean tech vs just over $1T to fossil fuels this year.

✅ For every $1 in fossil, about $1.7 goes to clean energy.

✅ Solar investment poised to overtake oil production spending.


Investment in clean energy technologies is significantly outpacing spending on fossil fuels as affordability and security concerns, underpinned by analyses showing renewables cheapest new power in many markets, triggered by the global energy crisis strengthen the momentum behind more sustainable options, according to the International Energy Agency's (IEA) latest World Energy Investment report.

About $2.8 trillion (€2.6 trillion) is set to be invested globally in energy this year, of which over $1.7 trillion (€1.59 trillion) is expected to go to clean technologies - including renewables, electric vehicles, nuclear power, grids, storage, low-emissions fuels, efficiency improvements and heat pumps – according to report.

The remainder, slightly more than $1 trillion (€937.7 billion), is going to coal, gas and oil, despite growing calls for a fossil fuel lockdown to meet climate goals.

Annual clean energy investment is expected to rise by 24% between 2021 and 2023, driven by renewables and electric vehicles, with renewables breaking records worldwide over the same period.

But more than 90% of this increase comes from advanced economies and China, which the IEA said presents a serious risk of new dividing lines in global energy if clean energy transitions don’t pick up elsewhere.

“Clean energy is moving fast – faster than many people realise. This is clear in the investment trends, where clean technologies are pulling away from fossil fuels,” said IEA executive director Fatih Birol. “For every dollar invested in fossil fuels, about 1.7 dollars are now going into clean energy. Five years ago, this ratio was one-to-one. One shining example is investment in solar, which is set to overtake the amount of investment going into oil production for the first time.”

Led by solar, low-emissions electricity technologies are expected to account for almost 90% of investment in power generation, reflecting the global renewables share above 30% in electricity markets.

Consumers are also investing in more electrified end-uses. Global heat pump sales have seen double-digit annual growth since 2021. Electric vehicle sales are expected to leap by a third this year after already surging in 2022.

Clean energy investments have been boosted by a variety of factors in recent years, including periods of strong economic growth and volatile fossil fuel prices that raised concerns about energy security, and insights from the IRENA decarbonisation report that underscore broader benefits, especially following Russia’s invasion of Ukraine.

Furthermore, enhanced policy support through major actions like the US Inflation Reduction Act and initiatives in Europe's green surge, Japan, China and elsewhere have played a role.

In Ireland, more than a third of electricity is expected to be green within four years, illustrating national progress.

The biggest shortfalls in clean energy investment are in emerging and developing economies, the IEA added. It pointed to some bright spots, such as dynamic investments in solar in India and in renewables in Brazil and parts of the Middle East. However, investment in many countries is being held back by factors including higher interest rates, unclear policy frameworks and market designs, weak grid infrastructure, financially strained utilities and a high cost of capital.

"Much more needs to be done by the international community, especially to drive investment in lower-income economies, where the private sector has been reluctant to venture," according to the IEA.


Related News

View more

California introduces new net metering regime

California NEM-3 Tariff ushers a successor Net Energy Metering framework, revising export compensation, TOU rates, and non-bypassable charges to balance ratepayer impacts, rooftop solar growth, and energy storage adoption across diverse communities.


Key Points

The CPUC's successor NEM policy redefining export credits and rates to sustain customer-sited solar and storage.

✅ Sets export compensation methodology beyond NEM 2.0

✅ Aligns TOU rates and non-bypassable charges with costs

✅ Encourages solar-plus-storage adoption and equity access


The California Public Utilities Commission (CPUC) has officially commenced its “NEM-3” proceeding, which will establish the successor Net Energy Metering (NEM) tariff to the “NEM 2.0” program in California. This is a highly anticipated, high-stakes proceeding that will effectively modify the rules for the NEM tariff in California, amid ongoing electricity pricing changes that affect residential rooftop solar – arguably the single most important policy mechanism for customer-sited solar over the last decade.

The CPUC’s recent order instituting rule-making (OIR) filing stated that “the major focus of this proceeding will be on the development of a successor to existing NEM 2.0 tariffs. This successor will be a mechanism for providing customer-generators with credit or compensation for electricity generated by their renewable facilities that a) balances the costs and benefits of the renewable electrical generation facility and b) allows customer-sited renewable generation to grow sustainably among different types of customers and throughout California’s diverse communities.”

This successor tariff proceeding was initiated by Assembly Bill 327, which was signed into law in October of 2013. AB 327 is best known as the legislation that directed the CPUC to create the “NEM 2.0” successor tariff, which was adopted by the CPUC in January of 2016.

The original Net Energy Metering program in California (“NEM 1.0”) effectively enabled full-retail value net metering “allowing NEM customers to be compensated for the electricity generated by an eligible customer-sited renewable resource and fed back to the utility over an entire billing period.” Under the NEM 2.0 tariff, customers were required to pay charges that aligned them more closely with non-NEM customer costs than under the original structure. The main changes adopted when the NEM 2.0 was implemented were that NEM 2.0 customer-generators must: (i) pay a one-time interconnection fee; (ii) pay non-bypassable charges on each kilowatt-hour of electricity they consume from the grid; and (iii) customers were required to transfer to a time-of-use (TOU) rate, with potential changes to electric bills for many customers.

NEM 2.0

The commencement of the NEM-3 OIR was preceded by the publishing of a 318-page Net Energy Metering 2.0 Lookback Study, which was published by Itron, Verdant Associates, and Energy and Environmental Economics. The CPUC-commissioned study had been widely anticipated and was expected to act as the starting reference point for the successor tariff proceeding. Verdant also hosted a webinar, which summarized the study’s inputs, assumptions, draft findings and results.

The study utilized several different tests to study the impact of NEM 2.0. The cost effectiveness analysis tests, which estimate costs and benefits attributed to NEM 2.0 include: (i) total resource cost test, (ii) participant cost test, (iii) ratepayer impact measure test, and (iv) program administrator test. The evaluation also included a cost of service analysis, which estimates the marginal cost borne by the utility to serve a NEM 2.0 customer.

The opening paragraph of the report’s executive summary stated that “overall, we found that NEM 2.0 participants benefit from the structure, while ratepayers see increased rates.” In every test that the author’s conducted the results generally supported this conclusion for residential customers. There were some exceptions in their findings. For example, in the cost of service analysis the report stated that “residential customers that install customer-sited renewable resources on average pay lower bills than the utility’s cost to serve them. On the other hand, nonresidential customers pay bills that are slightly higher than their cost of service after installing customer-sited renewable resources. This is largely due to nonresidential customer rates having demand charges (and other fixed fees), and the lower ratio of PV system size to customer load when compared to residential customers.”

Similar debates over solar rate design, including Massachusetts solar demand charges, highlight how demand charges and TOU decisions can affect customer economics.

NEM-3 timeline

Popular content
The preliminary schedule that the CPUC laid out in its OIR estimates that the proceeding will take roughly 15 months in total, starting with a November 2020 pre-hearing conference.

The real meat of the proceeding, where parties will present their proposals for what they believe the successor tariff should be, as the state considers revamping electricity rates to clean the grid, and really show their hand will not begin until the Spring of 2021. So we’re still a little ways away from seeing the proposals that the key parties to this proceeding, like the Investor Owned Utilities (PG&E, SCE, SDG&E), solar and storage advocates such as SEIA, CALSSA, Vote Solar, and ratepayer advocates like TURN) will submit.

While the outcome for the new successor NEM tariff is anyone’s guess at this point, some industry policy folks are starting to speculate. We think it is safe to assume that the value of exported energy will get reduced, with debates over income-based utility charges also influencing rate design. How much and the mechanism for how exports get valued remains to be seen. Based on the findings from the lookback study, it seems like the reduction in export value will be more severe than what happened when NEM 2.0 got implemented. In NEM 2.0, non-bypassable charges, which are volumetric charges that must be paid on all imported energy and cannot be netted-out by exports, only equated to roughly $0.02 to $0.03/kWh.

Given that the value of exports will almost certainly get reduced, we expect that to be bullish for energy storage as America goes electric and load shapes evolve. Energy storage attachment rates with solar are already steadily rising in California. By the time NEM-3 starts getting implemented, likely in 2022, we think storage attachment rates will likely escalate further.

We would not be surprised to see future storage attachment rates in California look like the Hawaiian market today, which are upwards of 80% for certain types of customers and applications. Two big questions on our mind are: (i) will the NEM 3.0 rules be different for different customer class: residential, CARE (e.g., low-income or disadvantaged communities), and commercial & industrial; (ii) will the CPUC introduce some sort of glidepath or phased in implementation approach?

The outcome of this proceeding will have far reaching implications on the future of customer-sited solar and energy storage in California. The NEM-3 outcome in California may likely serve as precedent for other states, as California exports its energy policies across the West, and utility territories that are expected to redesign their Net Energy Metering tariffs in the coming years.


Related News

View more

25.5% Of US Electricity Coming From Renewable Energy

US Renewable Energy Growth drives the US electricity mix as wind, solar, and hydropower rise while coal, natural gas, and nuclear decline, boosting market share month over month and year over year across the grid.


Key Points

US Renewable Energy Growth tracks rising wind, solar, and hydro shares in the mix as coal, gas, and nuclear decline.

✅ Wind and solar surpass nuclear in April share

✅ Renewables reach 29.3% of US electricity in April

✅ Coal and natural gas shares trend lower since 2020


Electricity generated by renewable energy sources continues to grow month over month and year over year in the United States. In April 2022, the share of US electricity coming from renewable energy was up to 29.3%, surpassing a record April level reported previously in national data. That was up from 24.8% in April 2020 and 25.7% in April 2021.

Looking at the first four months of the year, renewables provided 25.5% of US electricity, and were the second-most U.S. source in 2020 as well, while the figure for January–April 2020 was 21.7% and the figure for January–April 2021 was 22.5%.

Coal power (20.2% of US electricity) was down year over year in this time period (from 22% in January–April 2021), even as renewables surpassed coal in 2022 nationwide, but is admittedly still a bit higher than it was in January–April 2020 (16.8%).

Electricity from natural gas is also down year over year, but only very slightly (34.7% for both years). Though, it has dropped significantly since January–April 2020 (39.6%).

Electricity from nuclear power continued to take a steady, step-by-step tumble.

Wind & Solar Power Growth Strong
As reported earlier, April was the first month that wind and solar power provided more electricity than nuclear across the United States. Wind and solar power provided 21% of US electricity, while nuclear power provided 17.8% of US electricity (coal, incidentally, also provided 17.8% of US electricity, but wind and solar had provided more electricity than coal in some previous months as well).

Wind and solar power’s combined market share for the first four months of the year was up from just 14.6% in 2020 and 18.4% in 2021.

Looking at their growth year over year, you can see strong and continuous expansion of solar-provided electricity and wind-provided electricity, amid favorable government plans that have supported deployment.

Solar grew from 2.9% in January–April 2020 to 3.6%in January–April 2021 to, eventually, 4.4% in January–April 2022, with solar's 2022 share rising to 4.7% for the full year. Wind rose from 9.2% to 10.3% to 12.2%.

Together, wind and solar were up from 12.1% in January–April 2020 to 13.9% in January–April 2021, reflecting a surge in wind power within the U.S. electricity mix over this period, to 16.7% January–April 2022.

Hydropower (6.5%) is holding approximately the same position as the same period in 2021 (6.5%), but it is down a significant chunk from April 2020 (8.2%).


Related News

View more

US Crosses the Electric-Car Tipping Point for Mass Adoption

EV Tipping Point signals the S-curve shift to mainstream adoption as new car sales pass 5%, with the US joining Europe and China; charging infrastructure, costs, and supply align to accelerate electric car market penetration.


Key Points

The EV tipping point is when fully electric cars reach about 5% of new sales, triggering rapid S-curve adoption.

✅ 5% of new car sales marks start of mass adoption

✅ Follows S-curve seen in phones, LEDs, internet

✅ Barriers ease: charging, cost declines, model availability


Many people of a certain age can recall the first time they held a smartphone. The devices were weird and expensive and novel enough to draw a crowd at parties. Then, less than a decade later, it became unusual not to own one.

That same society-altering shift is happening now with electric vehicles, according to a Bloomberg analysis of adoption rates around the world. The US is the latest country to pass what’s become a critical EV tipping point: an EV inflection point when 5% of new car sales are powered only by electricity. This threshold signals the start of mass EV adoption, the period when technological preferences rapidly flip, according to the analysis.

For the past six months, the US joined Europe and China — collectively the three largest car markets — in moving beyond the 5% tipping point, as recent U.S. EV sales indicate. If the US follows the trend established by 18 countries that came before it, a quarter of new car sales could be electric by the end of 2025. That would be a year or two ahead of most major forecasts.

How Fast Is the Switch to Electric Cars?
19 countries have reached the 5% tipping point, and an earlier-than-expected shift is underway—then everything changes

Why is 5% so important? 
Most successful new technologies — electricity, televisions, mobile phones, the internet, even LED lightbulbs — follow an S-shaped adoption curve, with EVs going from zero to 2 million in five years according to market data. Sales move at a crawl in the early-adopter phase, then surprisingly quickly once things go mainstream. (The top of the S curve represents the last holdouts who refuse to give up their old flip phones.)

Electric cars inline tout
In the case of electric vehicles, 5% seems to be the point when early adopters are overtaken by mainstream demand. Before then, sales tend to be slow and unpredictable, and still behind gas cars in most markets. Afterward, rapidly accelerating demand ensues.

It makes sense that countries around the world would follow similar patterns of EV adoption. Most impediments are universal: there aren’t enough public chargers, grid capacity concerns linger, the cars are expensive and in limited supply, buyers don’t know much about them. Once the road has been paved for the first 5%, the masses soon follow.

Thus the adoption curve followed by South Korea starting in 2021 ends up looking a lot like the one taken by China in 2018, which is similar to Norway after its first 5% quarter in 2013. The next major car markets approaching the tipping point this year include Canada, Australia, and Spain, suggesting that within a decade many drivers could be in EVs worldwide. 


Related News

View more

UK Electric cars will cost more if Sunak fails to strike Brexit deal

UK-EU EV Tariffs 2024 threaten a 10% levy under Brexit rules of origin, raising electric vehicle prices, straining battery supply chains, and risking a price war for manufacturers, consumers, and climate targets across automotive market.


Key Points

Tariffs from Brexit rules of origin imposing 10% duties on EVs, raising UK prices amid battery and supply chain gaps.

✅ 10% tariffs if rules of origin thresholds are unmet

✅ Price hikes on UK EVs, led by Tesla Model Y

✅ Battery supply gaps strain UK and EU manufacturers


Electric cars will cost British motorists an extra £6,000 if Rishi Sunak fails to strike a post-Brexit deal with the EU on tariffs, industry bosses have told The Independent.

UK manufacturers warned of a “devastating price war” on consumers, echoing UK concern over higher EV prices across the market – threatening both the electric vehicle (EV) market and the UK’s climate change commitments – if tariffs are enforced in January 2024.

In the latest major Brexit row, the Sunak government is pushing the European Commission to agree to delay the costly new rules, even as the UK readies for rising EV adoption across the economy, set to come in at the start of next year as part of Boris Johnson’s Brexit trade deal.

But Brussels has shown no sign it is willing to budge – even as Washington has announced a 100% tariff on Chinese-made EVs this year – leaving business leaders in despair about the impact of 10 per cent tariffs on exports on Britain’s car industry.

The tariffs would increase the price of a new Tesla Model Y – the UK’s most popular electric vehicle – by £6,000 or more, according to a new report by the Independent Commission on UK-EU Relations.

“For the sake of our economy and our planet, the government has a responsibility to get round the table with the EU, fix this and fix the raft of other issues with the Brexit deal,” said commission director Mike Buckley.

The new rules of origin agreed in the Brexit trade and cooperation agreement (TCA) require 45 per cent of an electric car’s value, as the age of electric cars accelerates, to originate in the UK or EU to qualify for trade without tariffs.

The British auto industry has warned the 2024 rules pose an “existential threat” to sales because of the lack of domestic batteries to meet the rules, even as EV adoption within the decade is widely expected to surge – pleading for a delay until 2027.

The VDA – the lobby group for Germany’s car industry – has also called for an “urgent” move to delay, warning that the rules create a “significant competitive disadvantage” for European carmarkers in relation to China, where tariffs on Chinese EVs are reshaping global trade, and other Asian competitors.

The new report by the Independent Commission on UK-EU Relations – backed by the manufacturers’ body Make UK and the British Chamber of Commerce – warns that the January tariffs will immediately push up costs and hit electric vehicle sales, despite UK EV inquiries surging during the fuel supply crisis in recent years.


Related News

View more

B.C. expands EV charging, leads country in going electric

BC EV Charging Network Funding accelerates CleanBC goals with new public fast-charging stations, supporting ZEV adoption, the Electric Highway, and rebates, lowering fuel costs and emissions across British Columbia under the Clean Transportation Action Plan.


Key Points

Funding to expand fast-charging stations, grow ZEV adoption, and advance CleanBC and the Electric Highway.

✅ $26M funds ~250 public fast-charging stations.

✅ Supports Electric Highway and remote access.

✅ Drives ZEV sales under CleanBC targets.


As British Columbians are embracing zero-emission vehicles faster than any other jurisdiction in Canada, the Province is helping them go electric with new incentives and $26 million in new funding for public charging stations.

“British Columbians are switching to clean energy and cleaner transportation in record numbers as part of our CleanBC plan and leading Canada in the transition to zero emission vehicles,” said Josie Osborne, Minister of Energy, Mines and Low Carbon Innovation, on Tuesday. “The new funding we are announcing today to expand B.C.’s public charging network will help get more EVs on the road, reduce our reliance on fossil fuels, and lower fuel costs for people.”

The Province’s newly released annual report about zero-emission vehicles (ZEV) shows they represented 18.1% of new light-duty passenger vehicles sold in 2022 – the highest percentage for any province or territory. To support British Columbians’ transition to electric vehicles and to help industry lower its emissions, year-end funding of $26 million will go toward the CleanBC Public Charging Program for light-duty vehicle charging.

The new funding will support approximately 250 more public light-duty fast-charging stations, including stations to complete the B.C. Electric Highway, a CleanBC Roadmap to 2030 commitment that will make recharging easier in every corner of the province.

The 2022 ZEV Update report highlights CleanBC Go Electric rebates and programs that have helped drive growth in the number of electric vehicles in B.C. The number of registered light-duty EVs rose from 5,000 in 2016 to more than 100,000 today – a 1,900% increase in the past six years. Last year, 30,004 zero-emission vehicles were bought in B.C., beating the previous record of 24,263 in 2021.

In addition, the report outlines progress in the installation of public charging stations across British Columbia, supported by B.C. Hydro expansion, which now has one of the largest public charging networks in Canada, with more than 3,800 charging stations at the end of 2022. That compares to just 781 charging stations in 2016.

The CleanBC Roadmap to 2030, released in 2021, details a range of expanded actions to accelerate the switch to cleaner transportation, including strengthening the Zero-Emission Vehicles Act to require 26% of light-duty vehicle sales to be ZEV by 2026, 90% by 2030 and 100% by 2035 – five years ahead of the original target, and implementing the Clean Transportation Action Plan.

George Heyman, Minister of Environment and Climate Change Strategy, said: “Transportation accounts for about 40% of emissions in B.C., which is why we are committed to accelerating requirements for ZEVs and setting new standards for medium- and heavy-duty vehicles. To support this uptake, we continue to expand B.C.’s electric vehicle charging network, including faster EV charging options, with a target of having 10,000 public EV charging stations by 2030.”

Blair Qualey, President and CEO, New Car Dealers Association of BC, said: “B.C.’s new car dealers are proud to be involved in a true partnership that has been so instrumental in B.C. establishing and maintaining a leadership position in zero-emission vehicle adoption. Ongoing investments that continue to support the CleanBC Go Electric rebate program, including home and workplace charging rebates, and the availability of adequate charging infrastructure for consumers and businesses will be critical to the Province meeting its ZEV mandate targets, while also creating the promise of a greener and stronger economic future for British Columbians.”

Harry Constantine, President, Vancouver Electric Vehicle Association, said: “Expanding the buildout of the Electric Highway and establishing a network of charging stations are critical steps for moving the adoption of electric vehicles forward as demand ramps up across B.C. This stands to benefit all British Columbians, including remote communities. We are very pleased to see the Province investing in these measures.”


Related News

View more

Sign Up for Electricity Forum’s Newsletter

Stay informed with our FREE Newsletter — get the latest news, breakthrough technologies, and expert insights, delivered straight to your inbox.

Electricity Today T&D Magazine Subscribe for FREE

Stay informed with the latest T&D policies and technologies.
  • Timely insights from industry experts
  • Practical solutions T&D engineers
  • Free access to every issue

Live Online & In-person Group Training

Advantages To Instructor-Led Training – Instructor-Led Course, Customized Training, Multiple Locations, Economical, CEU Credits, Course Discounts.

Request For Quotation

Whether you would prefer Live Online or In-Person instruction, our electrical training courses can be tailored to meet your company's specific requirements and delivered to your employees in one location or at various locations.