Power plants could store carbon dioxide under North Sea

By Telegraph


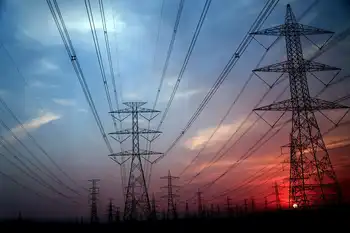
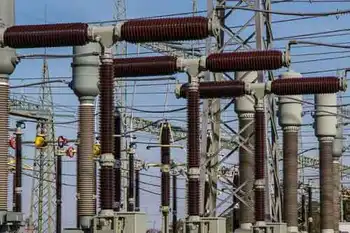
Substation Relay Protection Training

Our customized live online or in‑person group training can be delivered to your staff at your location.

  • Live Online
  • 12 hours Instructor-led
  • Group Training Available
Regular Price:
$699
Coupon Price:
$599
Reserve Your Seat Today
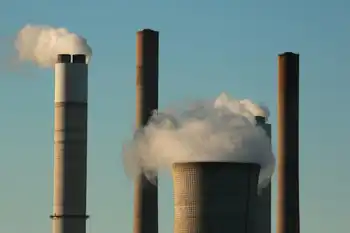
Carbon dioxide (CO2) from power plants in Scotland and the north east of England could be accommodated under the seabed for the next 200 years, according to the report.

The development of the technique, titled carbon capture and storage (CCS), has the potential to support 10,000 jobs north of the Border and cut Britain's output of greenhouse gases.

The Government announced plans to establish four carbon capture demonstration projects in the UK, with Scotland expected to be involved in at least one.

The new study, titled Opportunities for CO2 Storage Around Scotland, was hailed as a "milestone" by Alex Salmond, the First Minister.

Launching the document at Edinburgh Castle, he said: "Our ambition is to become a world leader in reducing harmful emissions and producing clean, green energy as part of our contribution to tackling climate change."

Scottish Power has already announced it is hoping to start capturing carbon within five years in Scotland.

But the report, by the Scottish Executive and Scottish Centre for Carbon Storage, is the first comprehensive study of the technology in the UK and presents a site-by-site assessment of carbon dioxide storage sites.

It finds they have the capacity to store 4,600 to 46,000 million tons of CO2 in rocks beneath the Scottish waters of the North Sea.

The gas would be collected at the power stations, converted to liquid form, before being piped offshore.

Existing oil rigs, as well as new hubs, could be used to pump it into porous sandstone below the sea bed.

These are located below a harder surface of rocks which act to seal in the CO2. Some former oil and gas fields below the seabed could also be used for storage, but the study indicates some limitations surrounding this.

Stuart Haszeldine, professor of sedimentary geology at the University of Edinburgh, said it could play a "critical role" in reducing the worst effects of global warming.

"The information gathered in this study tells us where the challenges are with CO2 storage," he said.

"Now we have to take the first big steps on the path to emission reductions."

Mr Salmond has ruled out building a new generation of nuclear power stations in Scotland, with the country's existing two atomic plants coming to the end of their operational lives.

He claimed electricity generated in Scottish power stations with carbon capture technology should also be comparable in price to other green technologies.

"Scotland can be a world leader in this technology of the future," he added.

Scottish Labour said the demonstration projects were "essential" to discover the potential of carbon capture technology.

But Lewis Macdonald, the party's energy spokesman, said SNP ministers "need to recognize there is a long way to go before we can be certain CCS is technically and commercially viable.

"That is why the SNP are wrong to rule out new nuclear as an option for the future."

Related News

Blood Nickel and Canada's Role in Global Mining Sustainability

Blood Nickel spotlights ethical sourcing in the EV supply chain, linking nickel mining to human rights, environmental impact, ESG standards, and Canadian leadership in sustainable extraction, transparency, and community engagement across global battery materials markets.


Key Points

Blood Nickel is nickel mined under unethical or harmful conditions, raising ESG, human rights, and environmental risks.

✅ Links EV battery supply chains to social and environmental harm

✅ Calls for transparency, traceability, and ethical sourcing standards

✅ Highlights Canada's role in sustainable mining and community benefits


The rise of electric vehicles (EVs) has sparked a surge in demand for essential battery components, particularly nickel, and related cobalt market pressures essential for their batteries. This demand has ignited concerns about the environmental and social impacts of nickel mining, particularly in regions where standards may not meet global sustainability benchmarks. This article explores the concept of "blood nickel," its implications for the environment and communities, and Canada's potential role in promoting sustainable mining practices.

The Global Nickel Boom

As the automotive industry shifts towards electric vehicles, nickel has emerged as a critical component for lithium-ion batteries due to its ability to store energy efficiently. This surge in demand has led to a global scramble for nickel, with major producers ramping up extraction efforts to meet market needs amid EV shortages and wait times that underscore supply constraints. However, this rapid expansion has raised alarms about the environmental consequences of nickel mining, including deforestation, water pollution, and carbon emissions from energy-intensive extraction processes.

Social Impacts: The Issue of "Blood Nickel"

Beyond environmental concerns, the term "blood nickel" has emerged to describe nickel mined under conditions that exploit workers, disregard human rights, or fail to uphold ethical labor standards. In some regions, nickel mining has been linked to issues such as child labor, unsafe working conditions, and displacement of indigenous communities. This has prompted calls for greater transparency and accountability in global supply chains, with initiatives like U.S.-ally efforts to secure EV metals aiming to align sourcing standards, to ensure that the benefits of EV production do not come at the expense of vulnerable populations.

Canada's Position and Potential

Canada, home to significant nickel deposits, stands at a pivotal juncture in the global EV revolution, supported by EV assembly deals in Canada that strengthen domestic manufacturing. With its robust regulatory framework, commitment to environmental stewardship, and advanced mining technologies, Canada has the potential to lead by example in sustainable nickel mining practices. Canadian companies are already exploring innovations such as cleaner extraction methods, renewable energy integration, and community engagement initiatives to minimize the environmental footprint and enhance social benefits of nickel mining.

Challenges and Opportunities

Despite Canada's potential, the mining industry faces challenges in balancing economic growth with environmental and social responsibility and building integrated supply chains, including downstream investments like a battery plant in Niagara that can connect materials to markets. Achieving sustainable mining practices requires collaboration among governments, industry stakeholders, and local communities to establish clear guidelines, monitor compliance, and invest in responsible resource development. This approach not only mitigates environmental impacts but also fosters long-term economic stability and social well-being in mining regions.

Pathways to Sustainability

Moving forward, Canada can play a pivotal role in shaping the global nickel supply chain by promoting transparency, ethical sourcing, and environmental stewardship. This includes advocating for international standards that prioritize sustainable mining practices, supporting research and development of cleaner technologies, and leveraging adjacent resources such as Alberta lithium potential to diversify battery supply chains, while fostering partnerships with global stakeholders to ensure a fair and equitable transition to a low-carbon economy.

Conclusion

The rapid growth of electric vehicles has propelled nickel into the spotlight, highlighting both its strategic importance and the challenges associated with its extraction. As global demand for "green" metals intensifies, addressing the concept of "blood nickel" becomes increasingly urgent, even as trade measures like tariffs on Chinese EVs continue to reshape market incentives. Canada, with its rich nickel reserves and commitment to sustainability, has an opportunity to lead the charge towards ethical and responsible mining practices. By leveraging its strengths in innovation, regulation, and community engagement, Canada can help forge a path towards a more sustainable future where electric vehicles drive progress without compromising environmental integrity or social justice.


Related News

View more

Tube Strikes Disrupt London Economy

London Tube Strikes Economic Impact highlights transport disruption reducing foot traffic, commuter flows, and tourism, squeezing small businesses, hospitality revenue, and citywide growth while business leaders urge negotiations, resolution, and policy responses to stabilize operations.


Key Points

Reduced transport options cut foot traffic and sales, straining small businesses and slowing London-wide growth.

✅ Hospitality venues report lower revenue and temporary closures

✅ Commuter and tourism declines reduce daily sales and bookings

✅ Business groups urge swift negotiations to restore services


London's economy is facing significant challenges due to ongoing tube strikes, challenges that are compounded by scrutiny of UK energy network profits and broader cost pressures across sectors, with businesses across the city experiencing disruptions that are impacting their operations and bottom lines.

Impact on Small Businesses

Small businesses, particularly those in the hospitality sector, are bearing the brunt of the disruptions caused by the strikes. Many establishments rely on the steady flow of commuters and tourists that the tube system facilitates, while also hoping for measures like temporary electricity bill relief that can ease operating costs during downturns. With reduced transportation options, foot traffic has dwindled, leading to decreased sales and, in some cases, temporary closures.

Economic Consequences

The strikes are not only affecting individual businesses but are also having a ripple effect on the broader economy, a dynamic seen when commercial electricity consumption plummeted in B.C. during the pandemic. The reduced activity in key sectors is contributing to a slowdown in economic growth, echoing periods when BC Hydro demand fell 10% and prompting policy responses such as Ontario electricity rate reductions for businesses, with potential long-term consequences if the disruptions continue.

Calls for Resolution

Business leaders and industry groups are urging for a swift resolution to the strikes. They emphasize the need for dialogue between the involved parties to reach an agreement that minimizes further economic damage and restores normalcy to the city's transportation system.

The ongoing tube strikes in London are causing significant disruptions to the city's economy, particularly affecting small businesses that depend on the efficient movement of people. Immediate action is needed to address the issues, drawing on tools like a subsidized hydro plan used elsewhere to spur recovery, to prevent further economic downturn.


Related News

View more

U.S. Residents Averaged Fewer Power Outages in 2022

2022 U.S. Power Outage Statistics show lower SAIDI as fewer major events hit, with SAIFI trends, electric reliability, outage duration and frequency shaped by hurricanes, winter storms, vegetation, and utility practices across states.


Key Points

They report SAIDI and SAIFI for 2022, showing outage duration, frequency, and impacts of major weather events.

✅ 2022 SAIDI averaged 5.6 hours; SAIFI averaged 1.4 interruptions.

✅ Fewer major events lowered outage duration versus 2021.

✅ Hurricanes and winter storms drove long outages in several states.


In 2022, U.S. electricity consumers on average experienced about 5.5 hours of power disruptions, a decrease from nearly two hours compared to 2021. This information comes from the latest Annual Electric Power Industry Report. The reduction in yearly power interruptions primarily resulted from fewer significant events in 2022 compared to the previous year, and utility disaster planning continues to support grid resilience as severe weather persists.

Since 2013, excluding major events, the annual average duration of power interruptions has consistently hovered around two hours. Factors contributing to major power disruptions include weather-related incidents, vegetation interference near power lines, and specific utility practices, while pandemic-related grid operations influenced workforce planning more than outage frequency. To assess the reliability of U.S. electric utilities, two key indexes are utilized:

  • The System Average Interruption Duration Index (SAIDI) calculates the total length (in hours) an average customer endures non-brief power interruptions over a year.
  • The System Average Interruption Frequency Index (SAIFI) tracks the number of times interruptions occur.

The influence of major events on electrical reliability is gauged by comparing affected states' SAIDI and SAIFI values against the U.S. average, which was 5.6 hours of outages and 1.4 outages per customer in 2022. The year witnessed 18 weather-related disasters in the U.S., each resulting in over $1 billion in damages, and COVID-19 grid assessments indicated the electricity system was largely safe from pandemic impacts. Noteworthy major events include:

  • Hurricane Ian in September 2022, leaving over 2.6 million Floridian customers without electricity, with restoration in some areas taking weeks rather than days.
  • Hurricane Nicole in November 2022, causing over 300,000 Florida customers to lose power.
  • Winter Storm Elliott in December 2022, affecting over 1.5 million customers in multiple states including Texas where utilities struggled after Hurricane Harvey to restore service, and Florida, and bringing up to four feet of snow in parts of New York.

In 2022, states like Florida, West Virginia, Maine, Vermont, and New Hampshire experienced the most prolonged power interruptions, with New Hampshire averaging 10.3 hours and Florida 19.1 hours, and FPL's Irma storm response illustrates how restoration can take days or weeks in severe cases. Conversely, the District of Columbia, Delaware, Rhode Island, Nebraska, and Iowa had the shortest total interruptions, with the District of Columbia averaging just 34 minutes and Iowa 85 minutes.

The frequency of outages, unlike their duration, is more often linked to non-major events. Across the nation, Alaska recorded the highest number of power disruptions per customer (averaging 3.5), followed by several heavily forested states like Tennessee and Maine. Power outages due to falling tree branches are common, particularly during winter storms that burden tree limbs and power lines, as seen in a North Seattle outage affecting 13,000 customers. The District of Columbia stood out with the shortest and fewest outages per customer.


Related News

View more

Does Providing Electricity To The Poor Reduce Poverty? Maybe Not

Rural Electrification Poverty Impact examines energy access, grid connections, and reliability, testing economic development claims via randomized trials; findings show minimal gains without appliances, reliable supply, and complementary services like education and job creation initiatives.


Key Points

Study of household grid connections showing modest poverty impact without reliable power and appliances.

✅ Randomized grid connections showed no short-term income gains.

✅ Low reliability and few appliances limited electricity use.

✅ Complementary investments in jobs, education, health may be needed.


The head of Swedfund, the development finance group, recently summarized a widely-held belief: “Access to reliable electricity drives development and is essential for job creation, women’s empowerment and combating poverty.” This view has been the driving force behind a number of efforts to provide electricity to the 1.1 billion people around the world living in energy poverty, such as India's village electrification initiatives in recent years.

But does electricity really help lift households out of poverty? My co-authors and I set out to answer this question. We designed an experiment in which we first identified a sample of “under grid” households in Western Kenya—structures that were located close to but not connected to a grid. These households were then randomly divided into treatment and control groups. In the treatment group, we worked closely with the rural electrification agency to connect the households to the grid for free or at various discounts. In the control group, we made no changes. After eighteen months, we surveyed people from both groups and collected data on an assortment of outcomes, including whether they were employed outside of subsistence agriculture (the most common type of work in the region) and how many assets they owned. We even gave children basic tests, as a frequent assertion is that electricity helps children perform better in school since they are able to study at night.

When we analyzed the data, we found no differences between the treatment and control groups. The rural electrification agency had spent more than $1,000 to connect each household. Yet eighteen months later, the households we connected seemed to be no better off. Even the children’s test scores were more or less the same. The results of our experiment were discouraging, and at odds with the popular view that supplying households with access to electricity will drive economic development. Lifting people out of poverty may require a more comprehensive approach to ensure that electricity is not only affordable (with some evidence that EV growth can benefit all customers in mature markets), but is also reliable, useable, and available to the whole community, paired with other important investments.

For instance, in many low-income countries, the grid has frequent blackouts and maintenance problems, making electricity unreliable, as seen in Nigeria's electricity crisis in recent years. Even if the grid were reliable, poor households may not be able to afford the appliances that would allow for more than just lighting and cell phone charging. In our data, households barely bought any appliances and they used just 3 kilowatt-hours per month. Compare that to the U.S. average of 900 kilowatt-hours per month, a figure that could rise as EV adoption increases electricity demand over time.

There are also other factors to consider. After all, correlation does not equal causation. There is no doubt that the 1.1 billion people without power are the world’s poorest citizens. But this is not the only challenge they face. The poor may also lack running water, basic sanitation, consistent food supplies, quality education, sufficient health care, political influence, and a host of other factors that may be harder to measure but are no less important to well-being. Prioritizing investments in some of these other factors may lead to higher immediate returns. Previous work by one of my co-authors, for example, shows substantial economic gains from government spending on treatment for intestinal worms in children.

It’s possible that our results don’t generalize. They certainly don’t apply to enhancing electricity services for non-residential customers, like factories, hospitals, and schools, and electric utilities adapting to new load patterns. Perhaps the households we studied in Western Kenya are particularly poor (although measures of well-being suggest they are comparable to rural households across Sub-Saharan Africa) or politically disenfranchised. Perhaps if we had waited longer, or if we had electrified an entire region, the household impacts we measured would have been much greater. But others who have studied this question have found similar results. One study, also conducted in Western Kenya, found that subsidizing solar lamps helped families save on kerosene, but did not lead children to study more. Another study found that installing solar-powered microgrids in Indian villages resulted in no socioeconomic benefits.


Related News

View more

Nevada on track to reach RPS mandate of 50% renewable electricity by 2030: report

Nevada Renewable Portfolio Standard 2030 targets 50% clean energy, advancing solar, geothermal, and wind, cutting GHG emissions, phasing out coal, and expanding storage, EV infrastructure, and in-state renewables under PUCN oversight and tax abatements.


Key Points

A state mandate requiring 50% of electricity from renewables by 2030, driving solar, geothermal, wind, and storage.

✅ 50% clean power by 2030; 100% carbon-free target by 2050

✅ Growth in solar, geothermal, wind; coal phase-out; natural gas remains

✅ RETA incentives spur 6.1 GW capacity, jobs, and in-state investment


Nevada is on track to meet its Renewable Portfolio Standard of 50% of electricity generated by renewable energy sources by 2030, according to the Governor's Office of Energy's annual Status of Energy Report.

Based on compliance reports the Public Utilities Commission of Nevada has received, across all providers, about 20% of power is currently generated by renewable resources, and, nationally, renewables ranked second in 2020 as filings show Nevada's investor-owned utility and other power providers have plans to reach the state's ambitious RPS of 50% by 2030, according to the report released Jan. 28.

"Because transportation and electricity generation are Nevada's two largest contributors to greenhouse gas emissions, GOE's program work in 2021 underscored our focus on transportation electrification and reaching the state's legislatively required renewable portfolio standard," GOE Director David Bobzien said in a statement Jan. 28. "While electricity generated from renewable resources currently accounts for about 25% of the state's electricity, a share similar to projections that renewables will soon provide about one-fourth of U.S. electricity overall, we continue to collaborate with the Public Utilities Commission of Nevada, electricity providers, the renewable energy industry and conservation organizations to ensure Nevada reaches our target of 50% clean energy by 2030."

The state's RPS, enacted in 1997 and last modified in 2019, requires an increase in renewable energy, starting with 22% in 2020 and increasing to 50% by 2030. The increase in renewables will reduce GHG emissions and help the state reach its goal of 100% carbon-free power by 2050, while states like Rhode Island have a 100% by 2030 plan, highlighting varying timelines.

Renewable additions
The state added 1.332 GW of renewable capacity in 2021 as part of the Renewable Energy Tax Abatement program, at a time when U.S. renewable energy hit a record 28% in April, for a total renewable capacity of 6.117 GW, according to the report.

The RETA program awards partial sales and use tax and partial property-tax abatements to eligible renewable energy facilities, which increase Nevada's tax revenue and create jobs in a growing industry. Eligible projects must employ at least 50% Nevada workers, pay 175% of Nevada's average wage during construction, and offer health care benefits to workers and their dependents.

Since its adoption in 2010, the GOE has approved 60 projects, including large-scale solar PV, solar thermal, biomass, geothermal and wind projects throughout the state, according to the report. Projects granted abatements in 2021 include:

  • 100-MW Citadel Solar Project
  • 150-MW Dry Lake Solar + Storage Project
  • 714-MW Gemini Solar Project
  • 55-MW North Valley Power Geothermal Project
  • 113-MW Boulder Flats Solar Project
  • 200-MW Arrow Canyon Solar Project

"Nevada does not produce fossil fuels of any significant amount, and gasoline, jet fuel and natural gas for electricity or direct use must be imported," according to the report. "Transitioning to domestically produced renewable resources and electrified transportation can provide cost savings to Nevada residents and businesses, as seen in Idaho's largely renewable mix today, while reducing GHG emissions. About 86% of the fuel for energy that Nevada consumes comes from outside the state."

Phasing out coal plants
Currently, more than two-thirds of the state's electricity is produced by natural gas-fired power plants, with renewables covering most of the remaining generation, according to the report. Nevada continues to phase out its remaining coal power plants, as renewables surpassed coal nationwide in 2022, which provide less than 10% of produced electricity.

"Nevada has seen a significant increase in capturing its abundant renewable energy resources such as solar and geothermal," according to the report. "Renewable energy production continues to grow, powering Nevada homes and business and serves to diversify the state's economy by exporting solar and geothermal to neighboring states, as California neared 100% renewable electricity for the first time. Nevada has more than tripled its renewable energy production since 2011."


Related News

View more

Ontario introduces new fixed COVID-19 hydro rate

Ontario Electricity COVID-19 Recovery Rate sets a fixed price of 12.8 cents/kWh, replacing time-of-use billing and aligning costs across off-peak, mid-peak, and on-peak periods per Ontario Energy Board guidance through Oct. 31.


Key Points

A flat 12.8 cents/kWh electricity price in Ontario that temporarily replaces time-of-use rates from June 1 to Oct. 31.

✅ Fixed 12.8 cents/kWh, all hours, June 1 to Oct. 31

✅ Higher than off-peak 10.1, lower than mid/on-peak

✅ Based on Ontario Energy Board average cost


Ontario residents will now have to pay a fixed electricity price that is higher than the off-peak hydro rate many in the province have been allowed to pay so far due to the pandemic. 

The announcement, which was made in a news release on Saturday, comes after the Ontario government suspended the normal “time-of-use” billing system on March 24 and as electricity rates are about to change across Ontario. 

The government moved all customers onto the lowest winter rate in response to the pandemic as emergency measures meant more people would be at home during the middle of the day when electricity costs are the highest. 

Now, the government has introduced a new “COVID-19 recovery rate” of 12.8 cents per kilowatt hour at all times of the day. The fixed price will be in place from June 1 to Oct. 31. 

The fixed price is higher than the winter off-peak price, which stood at 10.1 per kilowatt hour. However, it is lower than the mid-peak rate of 14.4 per kilowatt hour and the high-peak rate of 20.8 per kilowatt hour, even though typical bills may rise as fixed pricing ends for many households. 

“Since March 24, 2020, we have invested just over $175 million to deliver emergency rate relief to residential, farm and small business electricity consumers by suspending time-of-use electricity pricing,” Greg Rickford, the minister of energy, northern development and mines, said in a news release. 

“This investment was made to protect the people of Ontario from a marked increase in electricity rates as they did their part by staying home to prevent the further spread of the virus.”

Rickford said that the COVID-19 recovery rate is based on the average cost of electricity set by the Ontario Energy Board. 

“This fixed rate will continue to suspend time-of-use prices in a fiscally responsible manner,” he said. "Consumers will have greater flexibility to use electricity when they need it without paying on-peak and mid-peak prices, and some may benefit from ultra-low electricity rates under new time-of-use options."


Related News

View more

Sign Up for Electricity Forum’s Newsletter

Stay informed with our FREE Newsletter — get the latest news, breakthrough technologies, and expert insights, delivered straight to your inbox.

Electricity Today T&D Magazine Subscribe for FREE

Stay informed with the latest T&D policies and technologies.
  • Timely insights from industry experts
  • Practical solutions T&D engineers
  • Free access to every issue

Download the 2025 Electrical Training Catalog

Explore 50+ live, expert-led electrical training courses –

  • Interactive
  • Flexible
  • CEU-cerified