Latest Dielectric Fluids Articles
Advancements in Dissolved Gas Analysis: CO/CO2 Ratio
Advancements in Dissolved Gas Analysis CO CO2 Ratio optimize transformer diagnostics with machine learning, IEC 60599 interpretation, insulation aging assessment, fault detection, and predictive maintenance for condition monitoring of power transformers.
What Are Advancements in Dissolved Gas Analysis CO/CO2 Ratio for Transformer Diagnostics?
New methods refine CO/CO2 ratio interpretation using ML, online sensors, and IEC 60599 to assess paper aging.
✅ CO/CO2 thresholds aligned with IEC 60599 and IEEE C57.104
✅ Online DGA sensors and digital twins for real-time aging insights
✅ Machine learning models correlate ratios with DP and hot-spot temp
For DGA interpretation, faults identified using hydrocarbon gases are considered more serious if they appear to affect paper insulation. That is made explicit in CIGRE technical brochure 771 [1]. Production of hydrocarbon gases from the oil by electrical or thermal stress does not significantly affect the oil’s function as a coolant or electrical insulator. On the other hand, production of carbon oxide gases from paper insulation raises a concern of paper deterioration. In particular, charring of the paper by a localized hot spot, especially in the windings, can lead to transformer failure.
Recently R. Cox and C. Rutledge have developed a method for judging the location of a fault in paper insulation from the percent change of the CO2/CO carbon oxide gas ratio [2, 3]. In a controlled experiment with a sacrificial transformer and a heating element, they found that direct heating of paper tends to generate more CO than CO2. Case studies of faulty transformers have revealed that a large percent decrease in CO2/CO is associated with charring of winding paper. A moderate percent decrease in the ratio is often associated with paper charring outside of the windings, such as on bushing or tap changer leads. A minor percent decrease or an increase of the ratio (with production of carbon oxide gas) is usually associated with mild bulk overheating of paper insulation rather than a localized hot spot. See Table 1 for details. For readers new to the topic, an overview of dissolved gas analysis principles can clarify how gas ratios inform fault localization.
Complementary context on transformer oil analysis helps explain the baseline behavior of oils under electrical and thermal stress.
We propose on mathematical grounds that the CO/CO2 ratio should be used instead of CO2/CO. With the most serious problem – charring of winding insulation – the CO2/CO ratio approaches zero asymptotically, so that numerical and graphical resolution are worst when the problem is most severe. By contrast, charring of insulating paper causes the CO/CO2 ratio to increase, while decreases are associated with less damaging low temperature bulk overheating. (See Table 1.) The case history portrayed in Figure 1 shows two episodes where CO/CO2 increased sharply in parallel with methane before the transformer failed with extensive charring of winding insulation. When applying ratio-based criteria, attention to DGA data quality practices can reduce misinterpretation from sampling or instrument bias.
Recent industry work on advancements in dissolved gas analysis also discusses trends in ratio visualization relevant to severe paper charring.
This behavior of the carbon oxide gas ratio can generally be explained by chemical principles. Higher temperature and lower oxygen concentration favor the production of CO, while lower temperature and higher oxygen concentration favor CO2 production. The oxygen concentration in the windings tends to be lower than in the more freely circulating oil outside the windings, so a hot spot in the windings produces more CO than one outside the windings.
We conclude with some useful observations. First, stabilization of the gas ratio after a large change is not necessarily a good sign – it may signify that the paper near a hot spot has been consumed. Second, the criteria in Table 1 remain roughly valid even in the presence of gas loss. Since CO is lost to the atmosphere much faster than CO2, the CO/CO2 ratio can only increase if CO is truly being produced faster than CO2. Finally, some carbon oxide ratio changes are not fault related. For example, in transformers that have just been degassed and in transformers immediately after factory heat run testing, the gas ratio may change as gas trapped in oil-soaked paper insulation diffuses into relatively gas-free bulk oil. For context on heat removal and fluid flow, see transformer cooling considerations that influence temperature gradients.
Background on oil in transformers provides additional insight into oxygen availability and gas dissolution dynamics.
References
1. CIGRE TF D1.01/A2.11 and WG D1.32, Advances in DGA Interpretation, CIGRE Technical Brochure 771, July 2019.
2. C. Rutledge and R. Cox, “A comprehensive diagnostic evaluation of power transformers via dissolved gas analysis,” 2016 IEEE/PES Transmission and Distribution Conference and Exposition (T & D), Dallas, TX, 2016, pp. 1-5, doi: 10.1109/TDC.2016.7519996.
3. R. Cox, ‘“Categorizing Faults in Power Transformers via Dissolved Gas Analysis,” NETA World Journal, Spring 2020, pp. 64–68.
For extended reading, summaries of emerging analytical techniques offer broader context for interpreting field DGA patterns.
Related Articles
Sign Up for Electricity Forum’s Dielectric Fluids Newsletter
Stay informed with our FREE Dielectric Fluids Newsletter — get the latest news, breakthrough technologies, and expert insights, delivered straight to your inbox.
Advancements in Dissolved Gas Analysis: Investigating Failure Cases
Advancements in dissolved gas analysis3 leverage online DGA sensors, AI-driven diagnostics, IEC 60599 models, and predictive maintenance workflows to enhance transformer condition monitoring, fault detection, and reliability through real-time trend analysis and anomaly detection.
What Are Advancements in Dissolved Gas Analysis3?
Modern DGA methods using online sensors, analytics, and standards to improve transformer fault detection.
✅ Online multi-gas sensors enable real-time transformer health insights
✅ AI models apply IEC 60599 ratios for early fault classification
✅ Cloud dashboards support predictive maintenance and compliance
INTRODUTION
Dissolved gas analysis (DGA) provides the early warning radar view of a transformer fleet with a non-intrusive screening process for early identification of problematic transformers. Suspicious transformers can be subjected to more invasive and costly physical testing to determine the actual condition and service readiness of the transformer. Three case histories illustrate the usefulness of recent innovations in transformer DGA, especially when there is gas loss. Two of the example transformers failed in service, to the surprise of the utilities responsible for them since they did not exceed conventional DGA limits. In the other case, the utility is urgently looking for a replacement unit based on very concerning DGA results. For these examples we will use some of the techniques presented earlier in this series of articles. We will also introduce some new concepts to be covered in greater detail in later articles of the series. For example, we will use cumulative gas data to compensate partially for gas loss. Gas loss occurs either by leakage or by gas blanket pressure regulation, which releases head space gas to reduce pressure and adds nitrogen to raise pressure. The IEEE C57.104 transformer DGA guide, from 1978 until the latest version in 2019 [1], has never adequately addressed the problem of gas loss, which can delay or prevent limits-based detection of fault gas production. We will also use normalized fault energy indices (NEI), which represent the energy required to generate the observed fault gases from the paper and oil insulation. This will illustrate a new paradigm for DGA interpretation, described briefly in Annex F of IEEE C57.104-2019, that is less focused on gas concentrations in favor of fault energy related to defects, malfunctions, and excessive stress. Rather than display long tables of numbers, we present the DGA data for the examples graphically in the form of three stacked charts for each example. The top chart is for the hydrocarbon gas fault energy index, NEI-HC, representing fault energy affecting the mineral oil. The upper trend line is cumulative NEI-HC, while the lower one is NEI-HC as calculated for each oil sample. Boxes are drawn on the cumulative NEI trend line to highlight time intervals when significant fault gas production appears to be happening. The middle chart is for the carbon oxide gas fault energy index, NEI-CO, representing fault energy affecting paper insulation in a similar fashion. The bottom chart is for the CO/CO2 gas concentration ratio as calculated for each oil sample. For background on methodology, see dissolved gas analysis fundamentals for context.
Recent industry coverage of advancements in dissolved gas analysis highlights tools that support this fault energy approach.
Example #1
The transformer in Example #1 had a long NEI-CO gassing event, suggesting gradual thermal degradation of insulating paper. The up and down motion of NEI-CO (bottom line in the NEI-CO chart) is not just noise in the data – it reflects fault gas production with gas loss from pressure regulation connected with thermal cycling in a hot climate and a 6-month sampling frequency. The cumulative NEI-HC trend has two distinct gassing events with IEC fault types S and O respectively, indicating thermal fault gas production below 250°C. There are corresponding large increases in the CO/CO2 ratio, suggesting charring of winding paper insulation. The method of interpreting percent changes in the CO/CO2 carbon oxide gas ratio (sometimes inverted as CO2/CO) was worked out by Chris Rutledge and Randy Cox as a way of locating the source of carbon oxide gas production [2, 3]. Large percent increases in CO/CO2 are associated with charring of winding insulation paper. Of course, degradation of winding insulation is of great interest. When this transformer tripped due to turn-to-turn arcing, it was a complete surprise to the utility. The transformer never exceeded IEEE C57.104-2008 gas concentration limits, nor did it exceed the IEEE C57.104-2019 rate of change limits. The Example #1 charts, providing evidence of continual paper degradation with two significant episodes of a low range thermal fault affecting winding insulation, would have led an experienced engineer to flag this unit for investigation. The concern would be heightened by the realization that the severity of the problem may have been underestimated due to gas loss. A post-mortem revealed extensive charring of the paper winding insulation. Additional guidance on interpreting the CO/CO2 trend is summarized in CO/CO2 ratio practices for practitioners.
Example #2
The transformer in Example #2 appears to be in very precarious condition, and the utility responsible for it is planning to replace it quickly. The gassing event beginning in 2012 appeared to indicate a T2 hot spot affecting both paper insulation (NEI-CO) and oil (NEI-HC). Gas loss due to pressure regulation is evident from the saw-tooth patterns in NEI-HC and NEI-CO during the event as gases were generated and lost. The cumulative NEI trends show that there was rapid fault gas production, although the true extent of it can’t be known. The percent increase in the CO/CO2 ratio at the time was extreme, suggesting that winding paper was affected. Gaseous evidence of the problem dissipated in subsequent years as gas loss lowered the NEI levels and flattened the cumulative NEI. Recently a new event, classified as a D1 type fault, or low-energy electrical discharge, has been active, once again affecting the paper as indicated by a simultaneous rise in NEI-CO. The current hypothesis is that the fault starting in 2012 may have charred paper insulation between windings. Weak turn-to-turn discharges started later in 2018. The lack of movement in the CO/CO2 ratio during the most recent NEI event provides no information as to the location of paper involved in the recent event. If the problem is localized charring of winding paper between turns resulting in the onset of electrical sparking, CO and CO2 production would cease after the paper in that area was completely charred. Thus, the lack of recent carbon oxide gas production could be very concerning. Gas concentrations during the 2012 event only reached IEEE status code 2, soon returning back to status code 1 due to gas loss. Damage to the transformer did not magically repair itself, despite a de-escalation to a lower status code. Complementary transformer oil analysis procedures can help corroborate DGA findings during such events.
Improved sampling, screening, and lab controls described in advancements in DGA data quality strengthen trending when gas loss complicates interpretation.
Example #3
The Example #3 transformer had a persistent T2 thermal problem with long, steady NEI-HC and NEI-CO trends. In 2013, the NEI-HC trend accelerated sharply, indicating that something may have changed for the worse. For a while, acetylene production changed the fault type to a D1 electrical discharge. The gases other than acetylene remained below IEEE C57.104-2008 limits. Later the acetylene dissipated as the original trend resumed. The NEI-CO graph indicates that starting in 2013 there was an accelerating rate of change in cumulative NEI-CO leading up to the time of failure. The sawtooth pattern in the measured NEI-CO during that time can be attributed to gas blanket pressure regulation. Just as the unit reached status level 2 by exceeding the IEEE C57.104-2008 heat gas limits, the unit failed. The transformer never reached status level 3 except for the bump in acetylene during the 2013 event. The CO/CO2 ratio did not change much since 2006. It is likely that CO loss via gas blanket pressure regulation was sufficient to keep the CO/CO2 ratio relatively constant even though, as the upward trend in NEI-CO indicates, there was significant production of carbon oxide gases. Thus, in this case DGA did not provide any indication of whether winding paper insulation was being affected by the T2 and D1 faults. The fact that the transformer failed while NEI-CO was accelerating permits us to suspect that the problem was located in the windings, specifically on the outer layers where oil can circulate. Understanding oil behavior in transformers clarifies how thermal faults drive hydrocarbon gas trends.
Conclusions
The way of interpreting DGA demonstrated above requires tracking fault energy affecting liquid and solid insulation over the whole history of the transformer. Data management and good data quality are extremely important for early detection and accurate assessment of problems. DGA results for the most recent one or two oil samples are not sufficient to detect or diagnose the problems discussed in the above examples. These case histories show that waiting for a 90th percentile outlier in the DGA data is not a dependable method for identifying transformers in trouble. Waiting to see large concentrations or rates of increase of gas in any transformer before reacting is like waiting to read the license plate before getting out of the way of an oncoming car. Gas loss can keep gas levels and rates of change deceptively low, even when there is significant production of fault gas. A DGA report is a snapshot of an evolving and dynamic process, like a frame of a movie. To understand the current results properly, it is necessary to consider them in the context of as many past results as possible. The outcome of DGA interpretation is an assessment of whether the transformer appears to be producing fault gas, and if it does, to support further investigation or action by trying to guess the nature of the problem and assess risk. Usually DGA cannot provide a definite verdict on the transformer’s condition except to say whether or not it is gassing. That is reflected in the change of language in IEEE C57.104-2019, which has “status” codes instead of “condition” codes. For reliable information about a transformer’s condition, physical testing is usually required. In future articles, we will discuss the CO/CO2 ratio in more detail. We will also discuss severity assessment for gassing events and hazard factors for quantitative risk assessment. A grounding in fundamental dielectric characteristics also helps connect observed gases to insulation physics.
References.
- “IEEE Guide for the interpretation of gases dissolved in mineral oil filled transformers,” IEEE Std C57.104, editions 1978, 1991, 2008, and 2019.
- C. Rutledge and R. Cox, “A comprehensive diagnostic evaluation of power transformers via dissolved gas analysis,” 2016 IEEE/PES Transmission and Distribution Conference and Exposition (T&D), Dallas, TX, 2016, pp. 1-5, doi: 10.1109/TDC.2016.7519996.
- R. Cox, ‘“Categorizing Faults in Power Transformers via Dissolved Gas Analysis,” NETA World Journal, Spring 2020, pp. 64–68.
Related Articles
What is Breakdown Voltage of Oil?
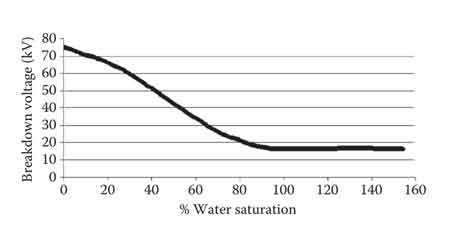
The breakdown voltage (BDV) of oil refers to the point at which insulating oil loses its dielectric strength and begins to conduct electricity, potentially leading to failure in electrical systems. In systems like transformers, insulating oil plays a critical role in preventing electrical discharges by providing both insulation and cooling. A BDV test is essential for evaluating the quality and effectiveness of the oil. The higher the BDV, the better the oil can resist electrical breakdown, ensuring the safety and efficiency of the system.
What is the breakdown voltage of oil, and why is it important in electrical systems?
The breakdown voltage (BDV) of oil is the maximum voltage at which the insulating properties of the oil fail, causing it to conduct electricity. This is critical in systems like transformers, where transformer oil is used as an insulator. If the BDV of the oil is low, it can lead to electrical failures, short circuits, and equipment damage. Testing and maintaining the BDV ensures that the oil can effectively insulate electrical components and prevent catastrophic breakdowns.
How is the breakdown voltage of oil measured, and what are the typical test methods?
The breakdown voltage test is performed by placing an oil sample between two electrodes immersed in the oil at a specific distance, known as the specific gap. A gradually increasing voltage is applied until the oil fails and allows current to flow between the electrodes. The voltage at which this occurs is recorded as the BDV. This test is crucial in assessing the dielectric strength of the oil. The BDV test is typically conducted according to industry standards to ensure accurate and reliable results.
What factors affect the breakdown voltage of insulating oil?
Several factors can affect the breakdown voltage of insulating oil. Conducting impurities, such as moisture, dust, and other contaminants, can significantly lower the BDV of the oil. Over time, oil exposed to high temperatures, oxidation, and electrical stress can degrade, reducing its dielectric properties. Additionally, the presence of gases dissolved in the oil, as well as the condition of the oil's molecular structure, can affect its ability to insulate. Proper maintenance and regular testing help ensure that these factors are kept in check.
What are the typical breakdown voltage values for transformer oil?
The typical breakdown voltage values for transformer oil range from 30 kV to 60 kV, depending on the quality of the oil and its use in the transformer. New transformer oil generally has a higher BDV, while older, degraded oil can have a significantly lower value. Industry standards set minimum acceptable BDV values to ensure that the oil can maintain its insulating properties under operating conditions. Regular testing is necessary to monitor the oil’s performance and ensure it meets the required specifications.
How can the breakdown voltage of oil be improved or maintained?
Maintaining and improving the breakdown voltage of insulating oil involves regular testing and filtration. Removing conducting impurities such as moisture and dissolved gases can help increase the BDV. Proper storage and handling of the oil are also critical in preventing contamination. In some cases, reconditioning the oil by removing contaminants and restoring its dielectric properties can extend its useful life. Periodic BDV tests ensure that the oil continues to meet the necessary dielectric standards, safeguarding the electrical system from potential failure.
The breakdown voltage (BDV) of oil is a key parameter in maintaining the safety and efficiency of electrical equipment, particularly in transformers. By regularly testing and ensuring that the oil retains its dielectric strength, engineers can prevent costly electrical failures and extend the lifespan of the equipment. Proper maintenance and testing of transformer oil through BDV tests are essential to keeping systems operating safely and effectively.
Advancements in Dissolved Gas Analysis Explained
Advancements in dissolved gas analysis2 deliver smarter transformer condition monitoring, predictive maintenance, and fault diagnostics via online sensors, IEC 60599 methods, Duval Triangle analytics, and machine learning for grid reliability.
What Are Advancements in Dissolved Gas Analysis2?
Modern DGA methods using online sensors, IEC standards, and AI to diagnose transformer faults proactively.
✅ Real-time gas monitoring via online chromatographs and sensors
✅ AI and Duval Triangle enhance fault classification accuracy
✅ Standards-based analysis per IEC 60599 supports maintenance
One of the most important steps when looking at DGA data is to decide whether the data support the existence of a fault that is actively breaking down the insulation before you try to use a triangle, pentagon, or gas ratio method to identify a fault type. Otherwise, you are diagnosing random measurement noise, not the transformer. Conventional methods assign limits to each of the gases to detect and assess abnormal gas formation. Formerly it was common practice to add gas concentrations together to get total dissolved combustible gas (TDCG). The hope was to simplify the task of detecting abnormal gas production and interpreting rates of change. This, however, was equivalent to counting U.S. Dollars, Mexican Pesos, Bitcoins, and Canadian Loonies and thinking that the sum represented “value”. To reduce false positives from sensor drift and sampling errors, recent work on advancements in DGA data quality outlines practical controls for sampling, calibration, and trending.
Electrical Transformer Maintenance Training
Substation Maintenance Training
Request a Free Training Quotation
Chemistry dictates that each gas we observe requires a different amount of energy to break away from the original insulating material. Instead of trying to interpret several individual gas concentrations, why not follow the energy associated with the gassing? The energies required to form the gas can be weighted by the gas concentrations and added up.
For a grounding in principles and typical fault signatures, see this overview of dissolved gas analysis techniques and their diagnostic use.
This idea of using standard heats of formation of fault gases for DGA was worked out in Jakob et al. 2012 and demonstrated to be an improvement compared to TDCG and other gas concentration sums. Soon after that, chemist Fredi Jakob realized that it would be better to create a fault energy index, which he called normalized energy intensity (NEI), to represent the influence of an internal fault on the insulating oil. That idea was presented in Jakob & Dukarm 2015, where it was shown that NEI was very useful for trending fault severity and not partial to any particular fault types. The figure illustrates how trending cumulative NEI simpli.es the detection of suspicious gas production. For additional context on modern interpretation frameworks, review these advancements in dissolved gas analysis that compare energy-based indices with classical ratio methods.
NEI, now renamed NEI-HC, is based on the low molecular weight hydrocarbon gases generated from cracking mineral oil. Another fault energy index, called NEI-CO, is based on the carbon oxide gases formed by pyrolysis of cellulose in paper insulation. The formulas for NEI-HC and NEI-CO are shown in Equations (1) and (2) below. Since each set of gases comes from a different insulation material, you can assess and track which faults are affecting paper, hot metal in the oil, or both. That knowledge can help point to the root cause and better estimate the severity of the problem. When paper degradation is suspected, trends can be corroborated with guidance on the CO/CO2 ratio in DGA to strengthen evidence for thermal versus oxidative effects.
Because NEI-HC derives from oil cracking, selecting and maintaining a high-quality transformer insulating oil is essential for resilient performance under thermal stress.
NEI-HC = 77.7[CH4] + 93.5[C2H6] + 104.1[C2H4] + 278.3[C2H2] / 22400 (1)
NEI-CO = 101.4[CO] + 30.19[CO2] / 22400 (2)
The highest heat of formation for the hydrocarbons is C2H2 and for carbon oxides it is CO. This physically confirms the general intuition that these gases are the most concerning to see in transformer DGA. These concerns underscore why routine transformer oil analysis remains central to risk-based maintenance planning.
You can trend fault energy indices to identify gassing episodes and relate them to external events such as through faults, maintenance work orders, and load changes to help determine what might have triggered the gassing. Also, you can track the cumulative energy over the history of the transformer to counteract effects of gas-loss (see previous article in this series). Interpreting those trends alongside the unit's fundamental dielectric characteristics helps differentiate benign load-related gassing from insulation distress.
Related Articles
Transformer Insulating Oil
Transformer Insulating Oil provides dielectric insulation, arc suppression, and cooling for power transformers, improving efficiency, preventing electrical faults, reducing downtime, and ensuring reliable high-voltage system performance in energy distribution networks.
What is Transformer Insulating Oil?
Transformer insulating oil is a vital fluid that plays a crucial role in the reliable and efficient operation of electrical power systems.
✅ Provides electrical insulation and suppresses arcing between components
✅ Dissipates heat to prevent transformer overheating and failure
✅ Protects against moisture, oxidation, and other contaminants
It serves as the lifeblood of power transformers, providing essential insulation, cooling, and arc-quenching properties. A deep understanding of the fluid's characteristics, functions, and maintenance requirements is essential for electrical engineers, technicians, and maintenance professionals to ensure the optimal performance and longevity of these critical components. To learn more about the role of dielectric fluids in transformer insulation and cooling, visit our main page on Dielectric Fluids.
Electrical Transformer Maintenance Training
Substation Maintenance Training
Request a Free Training Quotation
The essential role of transformer insulating oil in electrical power distribution systems cannot be overstated. This insulating fluid plays a vital role in ensuring transformers' efficiency, safety, and longevity. It is a crucial insulating material that supports electrical stability while also providing thermal management and arc-quenching capabilities. Without it, transformers would face higher risks of failure, overheating, and electrical breakdowns. For insight into cutting-edge techniques for fault detection, see our detailed guide on Advancements in DGA Data Quality.
One of the most critical aspects of this kind of dielectric fluid is its ability to act as an excellent electrical insulating medium. By filling the space around the core and coils, it prevents electrical arcing and ensures a high dielectric strength. This high dielectric strength is essential for maintaining insulation integrity under high-voltage conditions. The breakdown voltage of the insulating fluid must be tested regularly to ensure it retains its insulating properties. Testing procedures, such as dielectric strength testing and dissolved gas analysis (DGA), are used to identify potential issues and help maintain service life. Discover how dissolved gas patterns reveal transformer health in our technical article on Advancements in Dissolved Gas Analysis.
The properties of a dielectric fluid vary depending on its type. Mineral oil remains one of the most widely used types of transformer dielectric fluid due to its affordability, availability, and decent insulating performance. However, it’s not the only option. Synthetic ester oils offer a more sustainable and fire-resistant alternative. These oils have a high fire point, making them safer for use in sensitive environments where fire hazards must be minimized. Silicone-based dielectric fluids, on the other hand, are known for their ability to remain stable at high temperatures, offering an advantage in environments with extreme heat.
Insulation and Cooling
Another critical role of transformer insulating oil is heat dissipation. The design of transformers enables efficient heat transfer, allowing the insulating fluid to absorb and dissipate heat generated by the core and coils. This heat management is crucial for extending the service life. An essential property that supports this function is the pour point of the fluid, which ensures it remains fluid even at low temperatures. Fluid with a low pour point maintain fluidity, ensuring effective heat dissipation in colder climates. Dive deeper into diagnostic gas trends with our exploration of CO/CO₂ Ratio Analysis as an indicator of cellulose insulation degradation.
Arc Quenching and Oxidation Resistance
Regular transformer testing and maintenance are essential to maintaining the effectiveness of dielectric fluids. Filtration and purification are critical to remove contaminants, moisture, and gases that accumulate over time. Oxidation stability is one of the most important factors influencing the service life of the fluid. When oxidation occurs, it can form acids and sludge, which degrade the dielectric fluid's insulating properties and reduce its effectiveness. Regular filtration processes ensure the insulating oil remains pure and retains its excellent electrical insulating capabilities.
Testing and Maintenance
Regular testing and maintenance are essential to maintaining optimal performance and reliability. Dielectric strength testing measures the dielectric fluid's ability to withstand electrical stress, while dissolved gas analysis (DGA) identifies potential faults within the unit by analyzing the gases dissolved. Fluid filtration and purification techniques remove contaminants and moisture, prolonging the dielectric fluid's service life.
Types of Transformer Oil
Various types are available, each with its own specific characteristics. Mineral oil, a traditional choice, is derived from petroleum and offers a balance of performance and cost-effectiveness. However, it is susceptible to fire and environmental concerns. To address these issues, synthetic ester oils have emerged as a superior alternative. These dielectric fluids exhibit excellent fire resistance, high dielectric strength, and superior oxidation stability. They are also environmentally friendly and biodegradable. Silicone oil, another synthetic option, offers exceptional thermal stability and arc-quenching properties, making it suitable for high-temperature applications.
Environmental Impact and Safety
Environmental sustainability has also become a key consideration in the selection and management of dielectric fluid. Traditional mineral oil has environmental drawbacks, such as limited biodegradability and disposal challenges. Biodegradable types, such as synthetic ester oils, are now being used as environmentally friendly alternatives. These dielectric fluids offer the dual benefits of reducing environmental impact and providing high fire resistance. Moreover, responsible recycling and disposal practices for used transformer fluids are mandated by regulatory compliance standards to protect the environment.
Safety is a paramount concern when dealing with dielectric fluid. As the dielectric fluid circulates inside, it’s crucial to understand the risks associated with fire hazards. The flash point of a dielectric fluid is a key indicator of its fire resistance. Dielectric fluids with a high fire point are preferred in applications where fire safety is a priority. Emergency response procedures must also be established in the event of spills or leaks, ensuring that spills are contained quickly to prevent environmental contamination. Additionally, health and safety measures are critical for workers handling dielectric fluid. Direct exposure can pose health risks, requiring protective equipment and following established handling protocols. For additional context on cooling mechanisms and thermal performance, read our article on Transformer Cooling and Dielectric Fluids.
Frequently Asked Questions
What is another name for transformer oil?
Another name is insulating or dielectric fluid. It is also sometimes referred to as dielectric fluid because of its role as a dielectric material that prevents electrical discharges inside. In specific contexts, names like mineral-insulating dielectric fluid or ester-based insulating dielectric fluid may be used to specify the type of oil used.
Can I use transformer oil on my skin?
No, it is not recommended to use dielectric dielectric fluid on your skin. This oil is not designed for human contact and may contain chemical additives, contaminants, or degradation products that can irritate the skin. Prolonged exposure to certain types of mineral oil can pose health risks. Any exposure should be washed off immediately with soap and water for health and safety reasons.
What is the real name of transformer oil?
The real name depends on its composition. Most dielectric fluids are referred to as mineral insulating oil or naphthenic mineral oil. Biodegradable alternatives may be called natural ester insulating dielectric fluid or synthetic ester insulating oil. For example, common mineral oil used is a type of naphthenic oil, while modern, environmentally friendly units may use ester-based oils.
Transformer dielectric fluid is a vital component in electrical power distribution, playing a central role in insulation, cooling, arc quenching, and overall safety. The choice of dielectric fluid—whether mineral, synthetic ester, or silicone—depends on application requirements, safety considerations, and environmental impact. Regular testing, maintenance, and proper disposal methods ensure its continued performance and compliance with regulatory standards. By maintaining oxidation stability and leveraging dielectric fluids with a high fire point, operators can ensure the longevity and safety in various industrial and commercial settings.
Transformer Cooling
Transformer cooling enhances thermal management via oil-immersed and air-cooled systems, radiators, fans, and pumps. Methods like ONAN, ONAF, and OFAF reduce temperature rise, limit insulation aging, and improve efficiency under varying load.
What Is Transformer Cooling?
Transformer cooling removes heat from windings and core via oil or air circulation to control temperature and slow aging.
✅ Common types: ONAN, ONAF, OFAF, OFWF for various ratings.
✅ Components: radiators, fans, oil pumps, heat exchangers.
✅ Benefits: lower temperature rise, higher efficiency, longer life.
A little energy lost in a transformer must be dissipated as heat. Although this energy is but a small portion of the total energy undergoing transformation, it becomes quite large in amount in transformers of larger kVA ratings. To maintain efficiency and life expectancy the transformer's cooling system needs to be operating at peak performance. For dry-type transformers, the ventilation system of the room should be inspected to make sure it is operating efficiently. For forced air-cooled systems, the fan motors should be checked for proper lubrication and operation. Water-cooled systems must be tested for leaks and proper operation of pumps, pressure gauges, temperature gauges and alarm systems.
In liquid-filled designs, the choice and maintenance of oil in transformers directly influence heat removal performance and long-term reliability.
When a liquid coolant is used its dielectric should be tested. Water in the coolant will reduce its dielectric strength and the insulation quality. In cases where the dielectric strength of the coolant is reduced significantly, conducting arcs may develop causing short-circuits when the transformer is energized. A standard oil dielectric test involves applying high voltage to a sample taken from the transformer and recording the voltage at which the oil breaks down. If the average breakdown voltage is less than 20 kilovolts, the oil will need to be filtered until a minimum average breakdown of 25 kilovolts is achieved. Technicians often reference breakdown voltage of oil guidelines to interpret test results and schedule remediation.
Comprehensive transformer oil analysis can reveal moisture ingress, dissolved gases, and particulate contamination before failures occur.
Oil-insulated transformers use mineral oil for cooling. This oil is thin enough to circulate freely and does a good job of providing insulation between the transformer windings and the core. It is however subject to oxidation and if any moisture enters the oil, its insulating value is substantially reduced. In addition, mineral oil is flammable and therefore should not be located near combustible materials indoors or outdoors. In critical applications, selecting a high-quality transformer insulating oil mitigates oxidation, moisture effects, and thermal aging.
These behaviors align with the fundamental dielectric characteristics that govern insulation performance under electrical and thermal stress.
There are several types of transformer oil cooling solutions:
- oil air
- forced oil
- oils water
- oil natural
- air forced
- heated oil
- oil forced
- natural
In practice, each configuration must be evaluated alongside the properties of the chosen dielectric fluid to balance cooling effectiveness, safety, and service life.
Outdoor liquid-cooled transformers usually use mineral oil, and liquid cooled transformers for inside use are filled with a synthetic liquid that is nonflammable and nonexplosive. Synthetic oil coolants must be handled with care as they sometimes cause skin irritations. One type, askarelinsulated transformers used in past years contained polychlorinated biphenyls (PCBs), which are known to cause cancer. Askarel has been banned by the Environmental Protection Agency and its use as a transformer coolant is being phased out. However, askarel coolants are still found throughout the electrical industry in older transformers and direct contact with them should be avoided. The NEC still contains provisions for installing askarel transformers. The following is a list of the different types of liquid-filled transformers recognized by the NEC:
Facility engineers should review application requirements, fire codes, and material compatibility when selecting oil for transformers to ensure compliance and dependable operation.
- Oil-Insulated--uses chemically untreated insulating oil
- Askarel—uses nonflammable insulating oil
- Less-Flammable Liquid-Insulated--uses reduced flammable insulating oil
- Nonflammable Fluid-Insulated--uses noncombustible liquid
Related Articles
Advancements in Dissolved Gas Analysis: Data Quality
Advancements in DGA data quality enable precise transformer monitoring, dissolved gas analysis, and predictive maintenance through calibrated sensors, IEC 60599/IEEE C57.104 harmonization, machine-learning analytics, anomaly detection, and IEC 61850-integrated SCADA data integrity.
What Are Advancements in DGA Data Quality?
Enhanced DGA data quality strengthens transformer diagnostics via calibrated sensors, aligned standards, and analytics.
✅ On-line oil monitors with auto-calibration and drift correction
✅ IEC 60599/IEEE C57.104 harmonized thresholds and diagnostics
✅ ML-based anomaly detection and condition-based maintenance
Introduction
There is more to DGA interpretation than comparing the latest gas concentrations to limits in a table or plotting them in a triangle or pentagon to identify the apparent fault type. We have found that the whole DGA history of a transformer must be considered when interpreting its most recent DGA results.
Trend evaluation and accurate assessment of short-term changes require accuracy and low measurement variability of gas data. Data quality problems must be recognized and dealt with before an interpretation is attempted. Below we point out some of the most common data quality issues. For broader context on diagnostics, the primer on dissolved gas analysis outlines core fault signatures, typical gas sources, and interpretation pitfalls.
Understanding how oil and paper behave electrically is foundational, and the summary of fundamental dielectric characteristics helps explain why certain gases trend together over time.
Data management
As a result of the historical importance of DGA data, proper organization and preservation of DGA data are extremely important. In addition to archiving the lab reports, keep the data in tabular form in a database or, for small volumes of data, a spreadsheet. A well-organized database supports sorting and filtering for graphical and statistical analysis.
Use a unique and permanent ID to identify transformers, oil compartments, and the oil sample data belonging to them. Substation and unit number are not a suitable ID, for the same reason that the dentist doesn’t identify you by your department and job title. Large transformer fleets may require company-assigned asset numbers to avoid possible serial number duplication across manufacturers.
Disciplined chain-of-custody practices provide correct IDs of transformers and compartments to be sampled, ensure that oil samples are labeled correctly, and guarantee that analysis results returned by the lab are attributed to the right transformers and oil compartments. Integrating laboratory reports with a structured repository is easier when guided by practical notes on transformer oil analysis data formats and decision thresholds.
For sampling logistics and labeling discipline, operations teams can review guidance on oil in transformers to align maintenance practices with data management goals.
Data inconsistency or inaccuracy
Gas loss that is deliberate, such as by head space pressure regulation or use of a desiccant breather, needs to be accounted for as discussed in our other article [1]. Unintended gas leakage from a transformer – often detectable by a O2/N2 ratio persistently above 0.2 when it should be lower – should be remedied as soon as possible, both to keep DGA effective and to prevent moisture ingress. After oil degassing, it is advisable to exclude samples from DGA interpretation for 6-12 months due to the false upward trends created by diffusion of gases from winding paper into the bulk oil.
Accuracy and repeatability of gas data are only partly up to the laboratory. Unrepresentative oil samples can lead to inconsistent and highly variable gas data regardless of the quality of laboratory measurements. A study by a large USA electric utility [2] shows that using extra care and a moisture / temperature probe to ensure collection of representative oil sample can reduce data variability considerably. The figure (Figure 1) illustrates the effect of moderate variability (±15%) versus high variability (±35%) on the data from a basic S-shaped gassing event.
Moderate variability is experienced with consistently good sampling practice and a good laboratory. High variability is easily attainable if there is a problem with sampling practices. Recent field case studies on advancements in dissolved gas analysis discuss accounting for gas loss, diffusion effects, and sampling bias.
When evaluating short-term changes following maintenance, further techniques described in advancements in DGA interpretation can reduce false alarms by emphasizing trend shape over single-point limits.
The table provides a summary of some common data quality problems. Sections 5.1 and 5.2 of IEEE C57.104-2019 [3] contain a detailed discussion of data quality assessment. For paper-aging diagnostics specifically, insights on the CO/CO2 ratio in DGA clarify when cellulose decomposition is the likely source.
References
[1] “Advancements in Dissolved Gas Analysis: Accounting for Gas Loss,” Electricity Today, March 2020
[2] T. Rhodes, “Using field moisture probes to ensure drawing a representative oil sample,” in 82nd Annual International Doble Client Conference, Doble Engineering Company, March 2015.
[3] “IEEE Guide for the interpretation of gases dissolved in mineral oil filled transformers”, IEEE Std C57.104-2019.