By ASSOCIATED PRESS


CSA Z463 Electrical Maintenance

Our customized live online or in‑person group training can be delivered to your staff at your location.

  • Live Online
  • 6 hours Instructor-led
  • Group Training Available
Regular Price:
$249
Coupon Price:
$199
Reserve Your Seat Today
Solar cloud slams Earth, power grids

DENVER — The most powerful geomagnetic storm measurable walloped Earth recently, knocking out some airline communications but apparently causing no large power outages or other major problems.

The most disruptive storm to hit Earth since 1989 was unleashed by the fourth-most powerful solar flare yet seen, NASA said.

The gigantic cloud of highly charged particles hurled from the sun posed a threat to electricity utilities, high-frequency radio communications, satellite navigation systems and TV broadcasts. Space forecasters expect more turbulence on the sun for a week.

The biggest immediate effect was a blackout of high-frequency voice-radio communications for planes flying polar routes.

But airliners in an emergency could still communicate through VHF contact with another aircraft or military monitoring station, said Louis Garneau, a spokesperson for the company that handles Canada's civil aviation navigation service.

The particle storm, 13 times larger than Earth, was rated a G5, the highest intensity on scientists' scale of space weather. Space observers have measured G5 storms five times in the past 15 years but few of them hit Earth so directly.

This flare whipped through the solar system at more than 8 million km/h, taking just 19 hours to travel close to 150 million kilometres from the sun.

U.S. federal scientists said it collided with Earth's magnetic field at 1:13 a.m. October 29, 12 hours earlier than predicted.

Such storms pose no direct threat to people on the ground because Earth's thick atmosphere deflects and absorbs incoming charged particles. But this one may produce auroras in the northern night sky visible as far south as El Paso, Texas.

The last time a G5 storm hit Earth was in 1989; it damaged the power grid and caused electrical blackouts in Quebec.

Larry Combs, forecaster for the space weather centre in Boulder, Colo., said, "We know that our power grids are definitely feeling the effects of this.''

Space scientists in North America and Europe and commercial satellite operators shut down some delicate instruments and turned them away from the storm's blast. Solar panels are especially vulnerable.

Related News

Electricity complaints filed by Texans reach three-year high, report says

Texas Electricity Complaints surged to a three-year high, highlighting Public Utility Commission data on billing disputes, meter problems, and service issues in the competitive retail electricity market and consumer protection process.


Key Points

Consumer filings to Texas PUC about billing, service, and meters, with 2018 reaching a three-year high.

✅ 5,371 complaints/inquiries in FY2018; 43.8% involved billing disputes.

✅ Service issues 15.8% and meters 12.6%; PUC publishes complaint stats.

✅ Advocates urge monitoring to keep deregulated retail market healthy.


The number of electricity service-related complaints and inquiries filed with the state’s Public Utility Commission reached a three-year high this past fiscal year, an advocacy group said Tuesday.

According to the Texas Coalition for Affordable Power, a nonprofit that advocates for low electricity prices, Texans filed 5,371 complaints or inquiries with the commission between September 2017 and August of this year. That’s up from the 4,175 complaints or inquiries filed during the same period in 2017 and the 4,835 filed in 2016. The complaints and inquiries included concerns with billing, meters and service.

“This stark uptick in complaints is disappointing — especially after several years of generally improving numbers,” Jay Doegey, the coalition's executive director, said in a written statement. “In percentage terms, the year-to-year rise in complaints is the greatest in a decade. Clearly, many Texans remain frustrated with aspects of their electric service.”

The utility commission did not immediately respond to a request for comment.

While complaints and inquiries increased in 2018, the number of complaints and inquiries has generally decreased since 2009, when Texans filed 15,956 with the commission. That could be because there have been lower residential electricity prices and because Texans have become more familiar with the state’s competitive retail electricity system over the last decade, the coalition's report said.

And complaints from 2018 are well below 2003 levels, when the number of complaints and inquiries soared to more than 17,000, a year after Texas deregulated most of its electricity market structure at the time.

But Jake Dyer, a policy analyst at the coalition, said his group is closely watching the uptick in complaints this year as the Texas power grid faces recurring strains.

“We are invested in making sure the competition works,” Dyer said. “When you see an uptick like this, you should watch very closely to make sure the market remains healthy and to make sure there is not something else going on.”

However, Dyer said that it is too early to know what that something else that is going on might be.

According to the report, concerns about billing made up most of the complaints and inquiries filed this year at 43.8 percent. That’s up from 42.5 percent in fiscal year 2017. Concerns about the provision of electrical service and about electrical meters also ranked high, constituting 15.8 percent and 12.6 percent of the complaints and inquiries, respectively.

The Public Utility Commission publishes customer complaint statistics on its website. The Texas Coalition for Affordable Power takes into account both complaints and inquiries filed with the commission for its report in order “to gauge general consumer sentiment and to maintain a uniform methodology across the study period.”

Texans can file an official complaint with the the commission's Customer Protection Division. Under the complaint process, the complaint is sent to the electric company, which has 21 days to respond.

Some providers outside the competitive market, such as electric cooperatives, drew praise for performance during the 2021 winter storm.

Following the 2021 winter storm, Texas lawmakers proposed an electricity market bailout to stabilize costs and reliability.


Related News

View more

Philippines Reaffirms Clean Energy Commitment at APEC Summit

Philippines Clean Energy Commitment underscores APEC-aligned renewables, energy transition, and climate resilience, backed by policy incentives, streamlined regulation, technology transfer, and public-private investments to boost energy security, jobs, and sustainable growth.


Key Points

It is the nation's pledge to scale renewables and build climate resilience through APEC-aligned energy policy.

✅ Policy incentives, PPPs, and streamlined permits

✅ Grid upgrades, storage, and smart infrastructure

✅ Regional cooperation on tech transfer and capacity building


At the recent Indo-Pacific Economic Cooperation (APEC) Summit, the Philippines reiterated its dedication to advancing clean energy initiatives as part of its sustainable development agenda. This reaffirmation underscores the country's commitment to mitigating climate change impacts, promoting energy security, and fostering economic resilience through renewable energy solutions, with insights from an IRENA study on the power crisis informing policy direction.

Strategic Goals and Initiatives

During the summit, Philippine representatives highlighted strategic goals aimed at enhancing clean energy adoption and sustainability practices. These include expanding renewable energy infrastructure, accelerating energy transition efforts toward 100% renewables targets, and integrating climate resilience into national development plans.

Policy Framework and Regulatory Support

The Philippines has implemented a robust policy framework to support clean energy investments and initiatives. This includes incentives for renewable energy projects, streamlined regulatory processes, and partnerships with international stakeholders, such as ADFD-IRENA funding initiatives, to leverage expertise and resources in advancing sustainable energy solutions.

Role in Regional Cooperation

As an active participant in regional economic cooperation, the Philippines collaborates with APEC member economies to promote knowledge sharing, technology transfer, and capacity building in renewable energy development, as over 30% of global electricity is now generated from renewables, reinforcing the momentum. These partnerships facilitate collective efforts to address energy challenges and achieve mutual sustainability goals.

Economic and Environmental Benefits

Investing in clean energy not only reduces greenhouse gas emissions but also stimulates economic growth and creates job opportunities in the renewable energy sector. The Philippines recognizes the dual benefits of transitioning to cleaner energy sources, with projects like the Aboitiz geothermal financing award illustrating private-sector momentum, contributing to long-term economic stability and environmental stewardship.

Challenges and Opportunities

Despite progress, the Philippines faces challenges such as energy access disparities, infrastructure limitations, and financing constraints in scaling up clean energy projects, amid regional signals like India's solar slowdown and coal resurgence that underscore transition risks. Addressing these challenges requires innovative financing mechanisms, public-private partnerships, and community engagement to ensure inclusive and sustainable development.

Future Outlook

Moving forward, the Philippines aims to accelerate clean energy deployment through strategic investments, technology innovation, and policy coherence, aligning with the U.S. clean energy market trajectory toward majority share to capture emerging opportunities. Embracing renewable energy as a cornerstone of its economic strategy positions the country to attract investments, enhance energy security, and achieve resilience against global energy market fluctuations.

Conclusion

The Philippines' reaffirmation of its commitment to clean energy at the APEC Summit underscores its leadership in promoting sustainable development and addressing climate change challenges. By prioritizing renewable energy investments and fostering regional cooperation, the Philippines aims to build a resilient energy infrastructure that supports economic growth and environmental sustainability. As the country continues to navigate its energy transition journey, collaboration and innovation will be key in realizing a clean energy future that benefits present and future generations.


Related News

View more

B.C. Hydro doing good job managing billions in capital assets, says auditor

BC Hydro Asset Management Audit confirms disciplined oversight of dams, generators, power lines, substations, and transformers, with robust lifecycle planning, reliability metrics, and capital investment sustaining aging infrastructure and near full-capacity performance.


Key Points

Audit confirming BC Hydro's asset governance and lifecycle planning, ensuring safe, reliable grid infrastructure.

✅ $25B in assets; many facilities operating near full capacity.

✅ 80% of assets are dams, generators, lines, poles, substations, transformers.

✅ $2.5B invested in renewal, repair, and replacement in fiscal 2018.


A report by B.C.’s auditor-general says B.C. Hydro is doing a good job managing the province’s dams, generating stations and power lines, including storm response during severe weather events.

Carol Bellringer says in the audit that B.C. Hydro’s assets are valued at more than $25 billion and even though some generating facilities are more than 85 years old they continue to operate near full-capacity and can accommodate holiday demand peaks when needed.

The report says about 80 per cent of Hydro’s assets are dams, generators, power lines, poles, substations and transformers that are used to provide electrical service to B.C., where residential electricity use shifted during the pandemic.

The audit says Hydro invested almost $2.5 billion to renew, repair or replace the assets it manages during the last fiscal year, ending March 31, 2018, and, in a broader context, bill relief has been offered to only part of the province.

Bellringer’s audit doesn’t examine the $10.7 billion Site C dam project, which is currently under construction in northeast B.C. and not slated for completion until 2024.

She says the audit examined whether B.C. Hydro has the information, practices, processes and systems needed to support good asset management, at a time when other utilities are dealing with pandemic impacts on operations.


Related News

View more

Ontario Energy Board Sets New Electricity Rate Plan Prices and Support Program Thresholds

OESP Eligibility 2024 updates Ontario electricity affordability: TOU, Tiered, Ultra-Low-Overnight price plans, online bill calculator, higher income thresholds, monthly credits for low-income households, and a winter disconnection ban for residential customers.


Key Points

Raises income thresholds and credits to help low-income Ontarians cut electricity costs and choose suitable price plans.

✅ TOU, Tiered, and ULO price plans with online bill calculator

✅ Income eligibility thresholds raised up to 35% on March 1, 2024

✅ Winter disconnection ban for residences: Nov 15, 2023 to Apr 30, 2024


Residential, small business and farm customers can choose their price plan, either Time-Of-Use (TOU), Tiered or the ultra-low overnight rates price plan available to many customers. The OEB has an online bill calculator to help customers who are considering a switch in price plans and monitoring changes for electricity consumers this year. 

The Government of Ontario announced on Friday, October 19, 2023, that it is raising the income eligibility thresholds that enable Ontarians to qualify for the Ontario Electricity Support Program (OESP) by up to 35 percent. OESP is part of Ontario’s energy affordability framework and other support for electric bills meant to reduce the cost of electricity for low-income households by applying a monthly credit directly on to electricity bills.. The higher income eligibility thresholds will begin on March 1, 2024.

The amount of OESP bill credit is determined by the number of people living in a home and the household’s combined income, and can help offset typical bill increases many customers experience. The current income thresholds cap income eligibility at $28,000 for one-person households and $52,000 for five-person households, and temporary measures like the off-peak price freeze have also influenced bills in recent periods.

The new income eligibility thresholds, which will be in effect beginning March 1, 2024, will allow many more families to access the program as rates are about to change across Ontario.

In addition, under the OEB’s winter disconnection ban, which follows the Nov. 1 rate increase, electricity distributors cannot disconnect residential customers for non-payment from November 15, 2023, to April 30, 2024.


Related News

View more

Ontario rolls out ultra-low electricity rates

Ontario Ultra-Low Overnight Electricity Rate lets eligible customers opt in to 2.4 cents per kWh time-of-use pricing, set by the Ontario Energy Board, as utilities roll out the plan between May 1 and Nov. 1.


Key Points

An OEB-set overnight TOU price of 2.4 cents per kWh for eligible Ontarians, rolling out in phases via local utilities.

✅ 8 of 61 utilities offering rate at May 1 launch

✅ About 20% of 5M customers eligible at rollout

✅ Enova Power delays amid merger integration work


A million households can opt into a new ultra-low overnight electricity rate offered by the Ministry of Energy, as province-wide rate changes begin, but that's just a fraction of customers in Ontario.

Only eight of the 61 provincial power utilities will offer the new rate on the May 1 launch date, following the earlier fixed COVID-19 hydro rate period. The rest have up to six months to get on board.

That means it will be available to 20 percent of the province's five million electricity consumers, the Ministry of Energy confirmed to CBC News.

The Ford government's new overnight pricing was pitched as a money saver for Ontarians, amid the earlier COVID-19 recovery rate that could raise bills, undercutting its existing overnight rate from 7.4 to 2.4 cents per kilowatt hour. Both rates are set by the Ontario Energy Board (OEB).

"We wanted to roll it out to as many people as possible," Kitchener-Conestoga PC MPP Mike Harris Jr. told CBC News. "These companies were ready to go, and we're going to continue to work with our local providers to make sure that everybody can meet that Nov. 1 deadline."

Enova Power — which serves Kitchener, Waterloo, Woolwich, Wellesley and Wilmot — won't offer the reduced overnight rate until the fall, after typical bills rose when fixed pricing ended province-wide.

Enova merger stalls adoption

The power company is the product of the recently merged Kitchener-Wilmot Hydro and Waterloo North Hydro.

The Sept. 1 merger is a major reason Enova Power isn't offering the ultra-low rate alongside the first wave of power companies, said Jeff Quint, innovation and communications manager.

"With mergers, a lot of work goes into them. We have to evaluate, merge and integrate several systems and processes," said Quint.

"We believe that we probably would have been able to make the May 1 timeline otherwise."

The ministry said retroactive pricing wouldn't be available, unlike the off-peak price freeze earlier in the pandemic, and Harris said he doesn't expect the province will issue any rebates to customers of companies that introduce the rates later than May 1.

"These organizations were able to look at rolling things out sooner. But, obviously — if you look at Toronto Hydro, London, Centre Wellington, Hearst, Renfrew — there's a dynamic range of large and smaller-scale providers there. I'm very hopeful the Region of Waterloo folks will be able to work to try and get this done as soon as we can," Harris said.


Related News

View more

Which of the cleaner states imports dirty electricity?

Hourly Electricity Emissions Tracking maps grid balancing areas, embodied emissions, and imports/exports, revealing carbon intensity shifts across PJM, ERCOT, and California ISO, and clarifying renewable energy versus coal impacts on health and climate.


Key Points

An hourly method tracing generation, flows, and embodied emissions to quantify carbon intensity across US balancing areas.

✅ Hourly traces of imports/exports and generation mix

✅ Consumption-based carbon intensity by balancing area

✅ Policy insights for renewables, coal, health costs


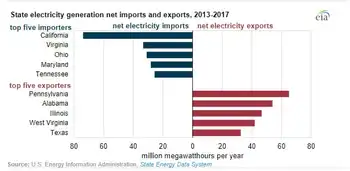
In the United States, electricity generation accounts for nearly 30% of our carbon emissions. Some states have responded to that by setting aggressive renewable energy standards; others are hoping to see coal propped up even as its economics get worse. Complicating matters further is the fact that many regional grids are integrated, and as America goes electric the stakes grow, meaning power generated in one location may be exported and used in a different state entirely.

Tracking these electricity exports is critical for understanding how to lower our national carbon emissions. In addition, power from a dirty source like coal has health and environment impacts where it's produced, and the costs of these aren't always paid by the parties using the electricity. Unfortunately, getting reliable figures on how electricity is produced and where it's used is challenging, even for consumers trying to find where their electricity comes from in the first place, leaving some of the best estimates with a time resolution of only a month.

Now, three Stanford researchers—Jacques A. de Chalendar, John Taggart, and Sally M. Benson—have greatly improved on that standard, and they have managed to track power generation and use on an hourly basis. The researchers found that, of the 66 grid balancing areas within the United States, only three have carbon emissions equivalent to our national average, and they have found that imports and exports of electricity have both seasonal and daily changes. de Chalendar et al. discovered that the net results can be substantial, with imported electricity increasing California's emissions/power by 20%.

Hour by hour
To figure out the US energy trading landscape, the researchers obtained 2016 data for grid features called balancing areas. The continental US has 66 of these, providing much better spatial resolution on the data than the larger grid subdivisions. This doesn't cover everything—several balancing areas in Canada and Mexico are tied in to the US grid—and some of these balancing areas are much larger than others. The PJM grid, serving Pennsylvania, New Jersey, and Maryland, for example, is more than twice as large as Texas' ERCOT, in a state that produces and consumes the most electricity in the US.

Despite these limitations, it's possible to get hourly figures on how much electricity was generated, what was used to produce it, and whether it was used locally or exported to another balancing area. Information on the generating sources allowed the researchers to attach an emissions figure to each unit of electricity produced. Coal, for example, produces double the emissions of natural gas, which in turn produces more than an order of magnitude more carbon dioxide than the manufacturing of solar, wind, or hydro facilities. These figures were turned into what the authors call "embodied emissions" that can be traced to where they're eventually used.

Similar figures were also generated for sulfur dioxide and nitrogen oxides. Released by the burning of fossil fuels, these can both influence the global climate and produce local health problems.

Huge variation
The results were striking. "The consumption-based carbon intensity of electricity varies by almost an order of magnitude across the different regions in the US electricity system," the authors conclude. The low is the Bonneville Power grid region, which is largely supplied by hydropower; it has typical emissions below 100kg of carbon dioxide per megawatt-hour. The highest emissions come in the Ohio Valley Electric region, where emissions clear 900kg/MW-hr. Only three regional grids match the overall grid emissions intensity, although that includes the very large PJM (where capacity auction payouts recently fell), ERCOT, and Southern Co balancing areas.

Most of the low-emissions power that's exported comes from the Pacific Northwest's abundant hydropower, while the Rocky Mountains area exports electricity with the highest associated emissions. That leads to some striking asymmetries. Local generation in the hydro-rich Idaho Power Company has embodied emissions of only 71kg/MW-hr, while its imports, coming primarily from Rocky Mountain states, have a carbon content of 625kg/MW-hr.

The reliance on hydropower also makes the asymmetry seasonal. Local generation is highest in the spring as snow melts, but imports become a larger source outside this time of year. As solar and wind can also have pronounced seasonal shifts, similar changes will likely be seen as these become larger contributors to many of these regional grids. Similar things occur daily, as both demand and solar production (and, to a lesser extent, wind) have distinct daily profiles.

The Golden State
California's CISO provides another instructive case. Imports represent less than 30% of its total electric use in 2016, yet California electricity imports provided 40% of its embodied emissions. Some of these, however, come internally from California, provided by the Los Angeles Department of Water and Power. The state itself, however, has only had limited tracking of imported emissions, lumping many of its sources as "other," and has been exporting its energy policies to Western states in ways that shape regional markets.

Overall, the 2016 inventory provides a narrow picture of the US grid, as plenty of trends are rapidly changing our country's emissions profile, including the rise of renewables and the widespread adoption of efficiency measures and other utility trends in 2017 that continue to evolve. The method developed here can, however, allow for annual updates, providing us with a much better picture of trends. That could be quite valuable to track things like how the rapid rise in solar power is altering the daily production of clean power.

More significantly, it provides a basis for more informed policymaking. States that wish to promote low-emissions power can use the information here to either alter the source of their imports or to encourage the sites where they're produced to adopt more renewable power. And those states that are exporting electricity produced primarily through fossil fuels could ensure that the locations where the power is used pay a price that includes the health costs of its production.


Related News

View more

Sign Up for Electricity Forum’s Newsletter

Stay informed with our FREE Newsletter — get the latest news, breakthrough technologies, and expert insights, delivered straight to your inbox.

Electricity Today T&D Magazine Subscribe for FREE

Stay informed with the latest T&D policies and technologies.
  • Timely insights from industry experts
  • Practical solutions T&D engineers
  • Free access to every issue

Download the 2025 Electrical Training Catalog

Explore 50+ live, expert-led electrical training courses –

  • Interactive
  • Flexible
  • CEU-cerified