Delays in offshore wind turbine project criticized

By Newsday


CSA Z462 Arc Flash Training - Electrical Safety Essentials

Our customized live online or in‑person group training can be delivered to your staff at your location.

  • Live Online
  • 6 hours Instructor-led
  • Group Training Available
Regular Price:
$249
Coupon Price:
$199
Reserve Your Seat Today
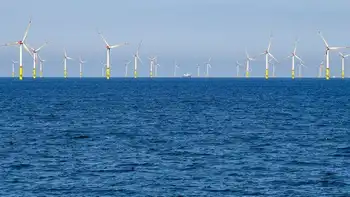
When then-Gov. Richard Codey signed an executive order paving the way for New Jersey's first offshore wind farm in 2005, he didn't imagine it would take so long to get turbines spinning off the coast.

The Board of Public Utilities now estimates the earliest date for the pilot project to be generating electricity from wind turbines off Atlantic City is late in 2012.

"The sooner the better," said Codey, whose order created the study panel that recommended New Jersey proceed with an experimental wind farm. "I remember the 1970s waiting in line for gas. What have we done since then? Shame on us."

Gov. Jon Corzine is also eager to see the project progress because harnessing power from renewable sources is part of his long-term goal for the state to become more energy efficient.

Corzine has promoted a policy, adopted by the BPU, of producing 20 percent of the energy in the state from renewable energy sources by 2020. Wind is an integral part of that.

In a 2006 report, the group named by Codey recommended building up to 80 wind turbines off the New Jersey coast to assess the impact of offshore wind farms on sea creatures, birds and fishermen.

Last October, the state Board of Public Utilities approved up to $19 million worth of grants to support the development of the offshore wind farm. The goal is that it produce 350 megawatts of energy – enough to power between 87,000 to 105,000 homes each day.

Five companies submitted proposals, and the BPU hopes to choose one in October. An August decision was put off so the authority could bring in bidders for oral presentations before making their choice.

Sen. John Adler, a Camden County Democrat, accused the BPU of "paralysis by analysis" and called for an end to the delays.

"It's unconscionable for the state bureaucracy to be blocking approvals when families and businesses are suffering daily from outrageous energy costs," said Adler, a member of the Senate Environment Committee. "It seems as though there's too much wind in the Newark offices of the BPU and not enough determination to get offshore windmills tested promptly."

Adler, and environmentalist Jeff Tittel of the Sierra Club, questioned how the state could achieve the twin goals of generating 20 percent of its energy from renewable sources by 2020 and producing 1,000 megawatts of electricity through wind power – when it has not been able to get the 350-megawatt pilot project in motion.

"If you don't take the first step, you're not going to get there," said Tittel.

Lance Miller, chief of policy and planning for the BPU, said projects of this magnitude take time. He defended the BPU's diligence in selecting the best proposal.

"This is the first time we are considering offshore wind," Miller said. "It is one of the first times in the United States it's been considered. It's something you want to do right."

Delaware and Massachusetts are planning similar projects offshore.

The only large-scale wind farm in New Jersey is onshore and operated by the Atlantic County Utility Authority, generating energy for roughly 500 homes. Separately, New Jersey is considering a bill to allow owners of preserved farmland to build and operate wind or solar energy facilities on their farms.

The BPU will provide $19 million in startup funds to the company it picks for the offshore project, enough money to help the firm through the permitting process but just a fraction of the total cost of building the wind farm.

The winning bidder faces many additional regulatory hurdles before construction can begin, including obtaining leases to build in federal waters and clearance from the state Department of Environmental Protection.

But Adler wants to see the approval process expedited.

"Other countries have had offshore windmill farms for years," he said. "It shouldn't be so hard to act."

Related News

Ford Threatens to Cut U.S. Electricity Exports Amid Trade Tensions

Ontario Electricity Export Retaliation signals tariff-fueled trade tensions as Doug Ford leverages cross-border energy flows to the U.S., risking grid reliability, higher power prices, and escalating a Canada-U.S. trade war over protectionist policies.


Key Points

A policy threat by Ontario to cut power exports to U.S. states in response to tariffs, leveraging grid dependence.

✅ Powers about 1.5M U.S. homes in NY, MI, and MN

✅ Risks price spikes, shortages, and legal challenges

✅ Part of Canada's CAD 30B retaliatory tariff package


In a move that underscores the escalating trade tensions between Canada and the United States, Ontario Premier Doug Ford has threatened to halt electricity exports to U.S. states in retaliation for the Trump administration's recent tariffs. This bold stance highlights Ontario's significant role in powering regions across the U.S. and serves as a warning about the potential consequences of trade disputes.

The Leverage of Ontario's Electricity

Ontario's electricity exports are not merely supplementary; they are essential to the energy supply of several U.S. states. The province provides power to approximately 1.5 million homes in states such as New York, Michigan, and Minnesota, even as it eyes energy independence through domestic initiatives. This substantial export positions Ontario as a key player in the regional energy market, giving the province considerable leverage in trade negotiations.

Premier Ford's Ultimatum

Responding to the Trump administration's imposition of a 25% tariff on Canadian imports, Premier Ford, following a Washington meeting, declared, "If they want to play tough, we can play tough." He further emphasized his readiness to act, stating, "I’ll cut them off with a smile on my face." This rhetoric underscores Ontario's willingness to use its energy exports as a bargaining chip in the trade dispute.

Economic and Political Ramifications

The potential cessation of electricity exports to the U.S. would have profound economic implications. U.S. states that rely on Ontario's power could face energy shortages, leading to increased prices, particularly New York energy prices, and potential disruptions. Such an action would not only strain the energy supply but also escalate political tensions, potentially affecting other areas of bilateral cooperation.

Canada's Retaliatory Measures

Ontario's threat is part of a broader Canadian strategy to counteract U.S. tariffs. Prime Minister Justin Trudeau has announced retaliatory tariffs on U.S. goods worth approximately CAD 30 billion, targeting products such as food, textiles, and furniture. These measures aim to pressure the U.S. administration into reconsidering its trade policies.

The Risk of Escalation

While leveraging energy exports provides Ontario with a potent tool, it also carries significant risks, as experts warn against cutting Quebec's energy exports amid tariff tensions. Such actions could lead to a full-blown trade war, with both countries imposing tariffs and export restrictions. The resulting economic fallout could affect various sectors, from manufacturing to agriculture, and lead to job losses and increased consumer prices.

International Trade Relations

The dispute also raises questions about the stability of international trade agreements and the rules governing cross-border energy transactions. Both Canada and the U.S. are signatories to various trade agreements that promote the free flow of goods and services, including energy. Actions like export bans could violate these agreements and lead to legal challenges.

Public Sentiment and Nationalism

The trade tensions have sparked a surge in Canadian nationalism, with public sentiment largely supporting tariffs on energy and minerals as retaliatory measures. This sentiment is evident in actions such as boycotting American products and expressing discontent at public events. However, while national pride is a unifying force, it does not mitigate the potential economic hardships that may result from prolonged trade disputes.

The Path Forward

Navigating this complex situation requires careful diplomacy and negotiation. Both Canada and the U.S. must weigh the benefits of trade against the potential costs of escalating tensions. Engaging in dialogue, seeking compromise, and adhering to international trade laws are essential steps to prevent further deterioration of relations and to ensure the stability of both economies.

Ontario's threat to cut off electricity exports to the U.S. serves as a stark reminder of the interconnectedness of global trade and the potential consequences of protectionist policies. While such measures can be effective in drawing attention to grievances, they also risk significant economic and political fallout. As the situation develops, it will be crucial to monitor the responses of both governments and the impact on industries and consumers alike, including growing support for Canadian energy projects among stakeholders.


Related News

View more

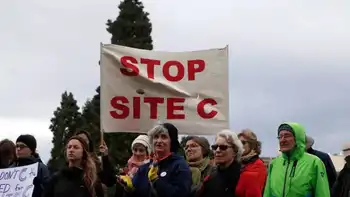
Site C dam could still be cancelled at '11th hour' if First Nations successful in court

Site C Dam Court Ruling could halt hydroelectric project near Fort St. John, as First Nations cite Treaty 8 rights in B.C. Supreme Court against BC Hydro, reservoir flooding, and Peace River Valley impacts.


Key Points

Potential B.C. Supreme Court stop to Site C, grounded in Treaty 8 rights claims by First Nations against BC Hydro.

✅ Trial expected in 2022 before planned 2023 reservoir flooding

✅ Treaty 8 rights and Peace River Valley impacts at issue

✅ Talks ongoing among B.C., BC Hydro, West Moberly, Prophet River


The Site C dam could still be stopped by an "eleventh hour" court ruling, according to the lawyer representing B.C. First Nations opposed to the massive hydroelectric project near Fort St. John.

The B.C. government, BC Hydro and West Moberly and Prophet River First Nations were in B.C. Supreme Court Feb. 28 to set a 120-day trial, expected to begin in March 2022.

That date means a ruling would come prior to the scheduled flooding of the dam's reservoir area in 2023 said Tim Thielmann, legal counsel for the West Moberly First Nation.

"The court has left itself the opportunity for an eleventh hour cancellation of the project," he said.


Construction continues

At the core of the case is First Nations arguments the multi-billion dollar BC Hydro dam will cause irreparable harm to its territory and way of life — even as drought strains hydro production elsewhere — rights protected under Treaty 8.

The West Moberly have previously warned it believes Site C constitutes a $1 billion treaty violation.

​In 2018, the First Nations lost a bid for an injunction order, meaning construction of the dam is continuing despite warnings that delays could cost $600 million to the project.

First Nations 'deeply frustrated' after B.C. Supreme Court dismisses Site C injunction

The judge in the case said the ruling was made because if the First Nations lost the challenge, the project would be needlessly put into disarray.


Province, Nations enter talks to avoid litigation

Also this week the B.C. government announced it has entered into talks with BC Hydro and the two First Nations in an attempt to avoid the court process altogether, amid broader energy debates such as bridging the Alberta-B.C. electricity gap for climate goals.

Thielmann said the details of the talk are confidential, but his clients are willing to pursue all avenues in order to stop the dam from moving forward.

"They are trying to save what little is left [of the Peace River Valley]", he said.

Tim Thielmann of Sage Legal is representing the West Moberly First Nation in its lawsuit aimed at stopping Site C. (Sage Legal)

In the meantime, the parties will continue to prepare for the 2022 court dates.

The latest figure on the cost of the dam is $10.7 billion, in a billions-over-budget project that the premier says will proceed. When complete, it would power the equivalent of 450,000 homes a year, though use of Site C's electricity remains a point of debate.


Related News

View more

COVID-19 Response: Electric Power Industry Closely Coordinating With Federal Partners

ESCC COVID-19 Response coordinates utilities, public power, and cooperatives to protect the energy grid and electricity reliability, aligning with DOE, DHS, CDC, FERC, and NERC on continuity of operations, mutual assistance, and supply chain resilience.


Key Points

An industry government effort ensuring reliability, operations continuity and supply chain stability during COVID-19.

✅ Twice weekly ESCC calls align DOE, DHS, HHS, CDC, FERC, NERC priorities.

✅ Focus on control centers, generation, quarantine access, mutual aid.

✅ Resource Guide supports localized decisions and supply chain resilience.


The nation’s investor-owned electric companies, public power utilities, and electric cooperatives are working together to protect the energy grid as the U.S. grid addresses COVID-19 challenges and ensure continued access to safe and reliable electricity during the COVID-19 global health crisis.

The electric power industry has been planning for years, including extensive disaster planning across utilities, for an emergency like the COVID-19 pandemic, as well as countless other types of emergencies, and the industry is coordinating closely with government partners through the Electricity Subsector Coordinating Council (ESCC) to ensure that organizations have the resources they need to keep the lights on.

The ESCC is holding high-level coordination calls twice a week with senior leadership from the Departments of Energy, Homeland Security, and Health and Human Services, the Centers for Disease Control and Prevention, the Federal Energy Regulatory Commission, and the North American Electric Reliability Corporation. These calls help ensure that industry and government work together to resolve any challenges that arise during this health emergency and that electricity remains safe for customers.

“Electricity and the energy grid are indispensable to our society, and one of our greatest strengths as an industry is our ability to convene and adapt quickly to changing circumstances and challenging events,” said Edison Electric Institute President Tom Kuhn. “Our industry plans for all types of contingencies, with examples such as local response planning, and strong industry-government coordination and cross-sector collaboration are critical to our planning and response. We appreciate the ongoing leadership and support of our government partners as we all respond to COVID-19 and power through this crisis together.”

The ESCC quickly mobilized and established strategic working groups dedicated to identifying and solving for short-, medium-, and long-term issues facing the industry during the COVID-19 pandemic, with utilities implementing necessary precautions to maintain service across regions.

The five current areas of focus are:

1. Continuity of operations at control centers, including on-site staff lockdowns when needed
2. Continuity of operations at generation facilities
3. Access to, and operations in, restricted or quarantined areas
4. Protocols for mutual assistance
5. Supply chain challenges

“The electric power industry has taken steps to prepare for the evolving coronavirus challenges, while maintaining our commitment to the communities we serve, including customer relief efforts announced by some providers,” said National Rural Electric Cooperative Association CEO Jim Matheson. “We have a strong track record of preparing for many kinds of emergencies that could impact the ability to generate and deliver electricity. While planning for this situation is unique from other business continuity planning, we are taking actions to prepare to operate with a smaller workforce, potential disruptions in the supply chain, and limited support services for an extended period of time.”

The ESCC has developed a COVID-19 Resource Guide linked here and available at electricitysubsector.org. This document was designed to support electric power industry leaders in making informed localized decisions in response to this evolving health crisis. The guide will evolve as additional recommended practices are identified and as more is learned about appropriate mitigation strategies.

“The American Public Power Association (APPA) continues to work with our communityowned public power members and our industry and government partners to gather and share upto-date information, best practices, and guidance to support them in safely maintaining operational integrity,” said APPA CEO Joy Ditto.


Related News

View more

UK low-carbon electricity generation stalls in 2019

UK low-carbon electricity 2019 saw stalled growth as renewables rose slightly, wind expanded, nuclear output fell, coal hit record lows, and net-zero targets demand faster deployment to cut CO2 intensity below 100gCO2/kWh.


Key Points

Low-carbon sources supplied 54% of UK power in 2019, up just 1TWh; wind grew, nuclear fell, and coal dropped to 2%.

✅ Wind up 8TWh; nuclear down 9TWh amid outages

✅ Fossil fuels 43% of generation; coal at 2%

✅ Net-zero needs 15TWh per year added to 2030


The amount of electricity generated by low-carbon sources in the UK stalled in 2019, Carbon Brief analysis shows.

Low-carbon electricity output from wind, solar, nuclear, hydro and biomass rose by just 1 terawatt hour (TWh, less than 1%) in 2019. It represents the smallest annual increase in a decade, where annual growth averaged 9TWh. This growth will need to double in the 2020s to meet UK climate targets while replacing old nuclear plants as they retire.

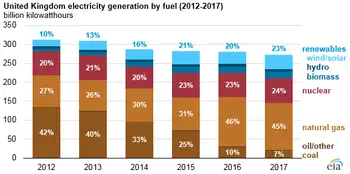
Some 54% of UK electricity generation in 2019 came from low-carbon sources, including 37% from renewables and 20% from wind alone, underscoring wind's leading role in the power mix during key periods. A record-low 43% was from fossil fuels, with 41% from gas and just 2% from coal, also a record low. In 2010, fossil fuels generated 75% of the total.

Carbon Brief’s analysis of UK electricity generation in 2019 is based on figures from BM Reports and the Department for Business, Energy and Industrial Strategy (BEIS). See the methodology at the end for more on how the analysis was conducted.

The numbers differ from those published earlier in January by National Grid, which were for electricity supplied in Great Britain only (England, Wales and Scotland, but excluding Northern Ireland), including via imports from other countries.

Low-carbon low
In 2019, the UK became the first major economy to target net-zero greenhouse gas emissions by 2050, increasing the ambition of its legally binding Climate Change Act.

To date, the country has cut its emissions by around two-fifths since 1990, with almost all of its recent progress coming from the electricity sector.

Emissions from electricity generation have fallen rapidly in the decade since 2010 as coal power has been almost phased out and even gas output has declined. Fossil fuels have been displaced by falling demand and by renewables, such as wind, solar and biomass.

But Carbon Brief’s annual analysis of UK electricity generation shows progress stalled in 2019, with the output from low-carbon sources barely increasing compared to a year earlier.

The chart below shows low-carbon generation in each year since 2010 (grey bars) and the estimated level in 2019 (red). The pale grey bars show the estimated future output of existing low-carbon sources after old nuclear plants retire and the pale red bars show the amount of new generation needed to keep electricity sector emissions to less than 100 grammes of CO2 per kilowatt hour (gCO2/kWh), the UK’s nominal target for the sector.

 Annual electricity generation in the UK by fuel, terawatt hours, 2010-2019. Top panel: fuel by fuel. Bottom panel: cumulative total generation from all sources. Source: BEIS energy trends, BM Reports and Carbon Brief analysis. Chart by Carbon Brief using Highcharts.
As the chart shows, the UK will require significantly more low-carbon electricity over the next decade as part of meeting its legally binding climate goals.

The nominal 100gCO2/kWh target for 2030 was set in the context of the UK’s less ambitious goal of cutting emissions to 80% below 1990 levels by 2050. Now that the country is aiming to cut emissions to net-zero by 2050, that 100gCO2/kWh indicator is likely to be the bare minimum.

Even so, it would require a rapid step up in the pace of low-carbon expansion, compared to the increases seen over the past decade. On average, low-carbon generation has risen by 9TWh each year in the decade since 2010 – including a rise of just 1TWh in 2019.

Given scheduled nuclear retirements and rising demand expected by the Committee on Climate Change (CCC) – with some electrification of transport and heating – low-carbon generation would need to increase by 15TWh each year until 2030, just to meet the benchmark of 100gCO2/kWh.

For context, the 3.2 gigawatt (GW) Hinkley C new nuclear plant being built in Somerset will generate around 25TWh once completed around 2026. The world’s largest offshore windfarm, the 1.2GW Hornsea One scheme off the Yorkshire coast, will generate around 5TWh each year.

The new Conservative government is targeting 40GW of offshore wind by 2030, up from today’s figure of around 8GW. If policies are put in place to meet this goal, then it could keep power sector emissions below 100gCO2/kWh, depending on the actual performance of the windfarms built.

However, new onshore wind and solar, further new nuclear or other low-carbon generation, such as gas with carbon capture and storage (CCS), is likely to be needed if demand is higher than expected, or if the 100gCO2/kWh benchmark is too weak in the context of net-zero by 2050.

The CCC says it is “likely” to “reflect the need for more rapid deployment” of low-carbon towards net-zero emissions in its advice on the sixth UK carbon budget for 2033-2037, due in September.

Trading places
Looking more closely at UK electricity generation in 2019, Carbon Brief’s analysis shows why there was so little growth for low-carbon sources compared to the previous year.

There was another increase for wind power in 2019 (up 8TWh, 14%), with record wind generation as several large new windfarms were completed including the 1.2GW Hornsea One project in October and the 0.6GW Beatrice offshore windfarm in Q2 of 2019. But this was offset by a decline for nuclear (down 9TWh, 14%), due to ongoing outages for reactors at Hunterston in Scotland and Dungeness in Kent.

(Analysis of data held by trade organisation RenewableUK suggests some 0.6GW of onshore wind capacity also started operating in 2019, including the 0.2GW Dorenell scheme in Moray, Scotland.)

As a result of these movements, the UK’s windfarms overtook nuclear for the first time ever in 2019, becoming the country’s second-largest source of electricity generation, and earlier, wind and solar together surpassed nuclear in the UK as momentum built. This is shown in the figure below, with wind (green line, top panel) trading places with nuclear (purple) and gas (dark blue) down around 25% since 2010 but remaining the single-largest source.

 Annual electricity generation in the UK by fuel, terawatt hours, 2010-2019. Top panel: fuel by fuel. Bottom panel: cumulative total generation from all sources. Source: BEIS energy trends, BM Reports and Carbon Brief analysis. Chart by Carbon Brief using Highcharts.
The UK’s currently suspended nuclear plants are due to return to service in January and March, according to operator EDF, the French state-backed utility firm. However, as noted above, most of the UK’s nuclear fleet is set to retire during the 2020s, with only Sizewell B in Suffolk due to still be operating by 2030. Hunterston is scheduled to retire by 2023 and Dungeness by 2028.

Set against these losses, the UK has a pipeline of offshore windfarms, secured via “contracts for difference” with the government, at a series of auctions. The most recent auction, in September 2019, saw prices below £40 per megawatt hour – similar to current wholesale electricity prices.

However, the capacity contracted so far is not sufficient to meet the government’s target of 40GW by 2030, meaning further auctions – or some other policy mechanism – will be required.

Coal zero
As well as the switch between wind and nuclear, 2019 also saw coal fall below solar for the first time across a full year, echoing the 2016 moment when wind outgenerated coal across the UK, after it suffered another 60% reduction in electricity output. Just six coal plants remain in the UK, with Aberthaw B in Wales and Fiddlers Ferry in Cheshire closing in March.

Coal accounted for just 2% of UK generation in 2019, a record-low coal share since centralised electricity supplies started to operate in 1882. The fuel met 40% of UK needs as recently as 2012, but has plummeted thanks to falling demand, rising renewables, cheaper gas and higher CO2 prices.

The reduction in average coal generation hides the fact that the fuel is now often not required at all to meet the UK’s electricity needs. The chart below shows the number of days each year when coal output was zero in 2019 (red line) and the two previous years (blue).

 Cumulative number of days when UK electricity generation from renewable sources has been higher than that from fossil fuels. Source: BEIS energy trends, BM Reports and Carbon Brief analysis. Chart by Carbon Brief using Highcharts.
The 83 days in 2019 with zero coal generation amount to nearly a quarter of the year and include the record-breaking 18-day stretch without the fuel.

Great Britain has been running for a record TWO WEEKS without using coal to generate electricity – the first time this has happened since 1882.

The country’s grid has been coal-free for 45% of hours in 2019 so far.https://www.carbonbrief.org/countdown-to-2025-tracking-the-uk-coal-phase-out …

Coal generation was set for significant reductions around the world in 2019 – including a 20% reduction for the EU as a whole – according to analysis published by Carbon Brief in November.

Notably, overall UK electricity generation fell by another 9TWh in 2019 (3%), bringing the total decline to 58TWh since 2010. This is equivalent to more than twice the output from the Hinkley C scheme being built in Somerset. As Carbon Brief explained last year, falling demand has had a similar impact on electricity-sector CO2 emissions as the increase in output from renewables.

This is illustrated by the fact that the 9TWh reduction in overall generation translated into a 9TWh (6%) cut in fossil-fuel generation during 2019, with coal falling by 10TWh and gas rising marginally.

Increasingly renewable
As fossil-fuel output and overall generation have declined, the UK’s renewable sources of electricity have continued to increase. Their output has risen nearly five-fold in the past decade and their share of the UK total has increased from 7% in 2010 to 37% in 2019.

As a result, the UK’s increasingly renewable grid is seeing more minutes, hours and days during which the likes of wind, solar and biomass collectively outpace all fossil fuels put together, and on some days wind is the main source as well.

The chart below shows the number of days during each year when renewables generated more electricity than fossil fuels in 2019 (red line) and each of the previous four years (blue lines). In total, nearly two-fifths of days in 2019 crossed this threshold.

 Cumulative number of days when the UK has not generated any electricity from coal. Source: BEIS energy trends, BM Reports and Carbon Brief analysis. Chart by Carbon Brief using Highcharts.
There were also four months in 2019 when renewables generated more of the UK’s electricity than fossil fuels: March, August, September and December. The first ever such month came in September 2018 and more are certain to follow.

National Grid, which manages Great Britain’s high-voltage electricity transmission network, is aiming to be able to run the system without fossil fuels by 2025, at least for short periods. At present, it sometimes has to ask windfarm operators to switch off and gas plants to start running in order to keep the electricity grid stable.

Note that biomass accounted for 11% of UK electricity generation in 2019, nearly a third of the total from all renewables. Some two-thirds of the biomass output is from “plant biomass”, primarily wood pellets burnt at Lynemouth in Northumberland and the Drax plant in Yorkshire. The remainder was from an array of smaller sites based on landfill gas, sewage gas or anaerobic digestion.

The CCC says the UK should “move away” from large-scale biomass power plants, once existing subsidy contracts for Drax and Lynemouth expire in 2027.

Using biomass to generate electricity is not zero-carbon and in some circumstances could lead to higher emissions than from fossil fuels. Moreover, there are more valuable uses for the world’s limited supply of biomass feedstock, the CCC says, including carbon sequestration and hard-to-abate sectors with few alternatives.

Methodology
The figures in the article are from Carbon Brief analysis of data from BEIS Energy Trends chapter 5 and chapter 6, as well as from BM Reports. The figures from BM Reports are for electricity supplied to the grid in Great Britain only and are adjusted to include Northern Ireland.

In Carbon Brief’s analysis, the BM Reports numbers are also adjusted to account for electricity used by power plants on site and for generation by plants not connected to the high-voltage national grid. This includes many onshore windfarms, as well as industrial gas combined heat and power plants and those burning landfill gas, waste or sewage gas.

By design, the Carbon Brief analysis is intended to align as closely as possible to the official government figures on electricity generated in the UK, reported in BEIS Energy Trends table 5.1.

Briefly, the raw data for each fuel is in most cases adjusted with a multiplier, derived from the ratio between the reported BEIS numbers and unadjusted figures for previous quarters.

Carbon Brief’s method of analysis has been verified against published BEIS figures using “hindcasting”. This shows the estimates for total electricity generation from fossil fuels or renewables to have been within ±3% of the BEIS number in each quarter since Q4 2017. (Data before then is not sufficient to carry out the Carbon Brief analysis.)

For example, in the second quarter of 2019, a Carbon Brief hindcast estimates gas generation at 33.1TWh, whereas the published BEIS figure was 34.0TWh. Similarly, it produces an estimate of 27.4TWh for renewables, against a BEIS figure of 27.1TWh.

National Grid recently shared its own analysis for electricity in Great Britain during 2019 via its energy dashboard, which differs from Carbon Brief’s figures.


Related News

View more

Avista Commissions Largest Solar Array in Washington

Adams Nielson Solar Array, a 28 MW DC utility-scale project in Lind, WA, spans 200 acres with 81,700 panels, powering about 4,000 homes, supporting Avista’s Solar Select program and renewable energy, sustainability, and carbon reduction.


Key Points

Adams Nielson Solar Array is a 28 MW DC facility in Lind, WA, powering ~4,000 homes via Avista’s Solar Select.

✅ 81,700 panels across 200 acres in Eastern Washington

✅ Offsets emissions equal to removing 7,300 cars annually

✅ Collaboration by Avista, Strata Solar, WUTC, WSU Energy


Official commissioning of the Adams Nielson solar array located in Lind, WA occurred today. The 28 Megawatt DC array is comprised of 81,700 panels that span 200 acres and generates enough electricity to supply the equivalent of approximately 4,000 homes annually, similar to a new co-op solar project serving South Metro members.

“Avista’s interest in the development of Solar Select, a voluntary commercial solar program reflecting broader corporate adoption such as a corporate solar power plant commissioned by Arvato, is consistent with the Company’s ongoing commitment to provide customers with renewable energy choices at reasonable cost,” said Dennis Vermillion, president, Avista Corporation. “In recent years, an increasing number of Avista customers have expressed their expectations and challenges in acquiring renewable energy. Avista is pleased to lead this effort and develop renewable energy products that meet our customers’ needs today and into the future.” This interest is being generated by a mix of local and national customers across a variety of industries, including Huckleberry’s, Gonzaga University, Community Colleges of Spokane, Hotstart, Central Pre-Mix Concrete, a CRH Co., independently owned McDonald's franchise locations, Spokane City, Main Market and Community Building and VA Medical Center.

Jim Simon, director of sustainability at Gonzaga University said, “The Solar Select program helps Gonzaga University move even closer to achieving its goal of climate neutrality by 2050 by continuing to prioritize renewables in our energy portfolio, as other communities add projects like a municipal solar project to boost local supply. We are grateful for Avista’s leadership in this project and look forward to other opportunities to reduce our greenhouse gas emissions.”

Spokane Mayor David Condon said, “The City of Spokane is pleased to partner with Avista through the Solar Select Program, as we continue to seek out opportunities that are both environmentally and financially responsible. The City already is a net producer of energy, generating more clean, green energy than our use of electricity, natural gas, and fuel, a milestone also seen with North Carolina's first wind farm now fully operational. We are excited to add even more clean energy to power City Hall.”

The Solar Select program created a cost-effective structure to bring solar energy to large business customers in Eastern Washington, allowing them to advance their desired sustainability goals and benefiting from industry service innovations led by companies like Omnidian expanding their global reach. The array is projected to deliver the environmental benefit equivalent of more than 7,300 cars removed from the road each year. This renewable energy program was made possible through a collaboration of Avista, Strata Solar, the Washington Utilities and Transportation Commission, and the WSU Energy Program. 


Related News

View more

Wind Denmark - summer's autumn weather provides extraordinarily low electricity prices

Western Denmark Negative Electricity Prices stem from wind energy oversupply, grid congestion, and limited interconnector capacity via Nord Pool and TenneT, underscoring electrification needs, renewable integration, special regulation, and system flexibility.


Key Points

They are sub-zero power prices from wind oversupply, weak interconnectors, low demand, and balancing needs.

✅ Caused by high wind output, low demand, and export bottlenecks

✅ Limited Nord Pool interconnector capacity depresses prices

✅ Special regulation and district heating absorb excess power


A downturn in the cable connection to Norway and Sweden, together with low electricity consumption and high electricity production, has pushed down European electricity prices to a negative level in Western Denmark.

A sign that the electrification of society is urgently needed, says Soren Klinge, head of electricity market at Wind Denmark today.

The heavy winds during the first weekend of July, unlike periods when cheap wind power wanes in the UK, have not only had consequences for the Danes who had otherwise been looking forward to spending their first days at home in the garden or at the beach. It has also pushed down prices in the electricity market to a negative level, which especially the West Danish wind turbine owners have had to notice.

'The electricity market is currently affected by an unfortunate coincidence of various factors that have a negative impact on the electricity price: a reduced export capacity to the other Nordic countries, a low electricity consumption and a high electricity generation, reflecting broader concerns over dispatchable power shortages in Europe today. Unfortunately, the coincidence of these three factors means that the price base falls completely out of the market. This is another sign that the electrification of society is urgently needed, 'explains Soren Klinge, electricity market manager at Wind Denmark.

According to the European power exchange Nord Pool Spot, where UK peak power prices are also tracked, the cable connection to Sweden is expected to return to full capacity from 19 July. The connection between Jutland and Norway is only expected to return to full capacity in early September.

2000 MWh / hour in special regulation

During the windy weather on Monday morning, July 6, up to 2000 MWh / hour was activated at national level in the form of so-called special regulation. Special regulation is the designation that the German system operator TenneT switches off Danish electricity generation at cogeneration plants and wind turbines in order to help with the balancing of the German power system during such events. In addition, electric boilers at the cogeneration plants also contribute by using the electricity from the electricity grid and converting it to district heating for the benefit of Danish homes and businesses.

'The Danish wind turbines are probably the source of most of the special regulation, because there are very few cogeneration units to down-regulate electricity generation. Of course, it is positive to see that we have a high degree of flexibility in the wind-based power system at home. That being said, Denmark does not really get ahead with the green transition, even as its largest energy company plans to stop using coal by 2023, until we are able to raise electricity consumption based on renewable energy.


Related News

View more

Sign Up for Electricity Forum’s Newsletter

Stay informed with our FREE Newsletter — get the latest news, breakthrough technologies, and expert insights, delivered straight to your inbox.

Electricity Today T&D Magazine Subscribe for FREE

Stay informed with the latest T&D policies and technologies.
  • Timely insights from industry experts
  • Practical solutions T&D engineers
  • Free access to every issue

Live Online & In-person Group Training

Advantages To Instructor-Led Training – Instructor-Led Course, Customized Training, Multiple Locations, Economical, CEU Credits, Course Discounts.

Request For Quotation

Whether you would prefer Live Online or In-Person instruction, our electrical training courses can be tailored to meet your company's specific requirements and delivered to your employees in one location or at various locations.