Lower power prices mean larger losses for Dynergy

By Industrial Info Resources


NFPA 70e Training

Our customized live online or in‑person group training can be delivered to your staff at your location.

  • Live Online
  • 6 hours Instructor-led
  • Group Training Available
Regular Price:
$199
Coupon Price:
$149
Reserve Your Seat Today
Electricity producer and seller Dynegy Incorporated recently reported on the company's financial performance for the first quarter of 2009. Dynegy reported a net loss of $335 million, compared with a net loss of $152 million in 1Q08.

As with other companies in the current soft economy, the company took a large hit in goodwill impairment charges, striking $433 million off the books in order to bring the company's assets in line with current market values.

The loss comes in spite of increased production volume. Dynegy produced approximately 10.2 million megawatt-hours (MWh) in 1Q08 and 11.1 million MWh in 1Q09, an increase of 8.8%.

Dynegy operates in three regions: the Midwest, which has a production capacity of approximately 8,400 megawatts (MW); the West, with approximately 5,500 MW of capacity; and the Northeast, with a capacity of about 3,800 MW. In a conference call regarding the company's earnings, Chairman, President and CEO Bruce Williamson spoke of the company's production across each region.

"In the Midwest, our overall production volumes increased by about 10% due to warmer winter temperatures. This was primarily driven by increased production from our natural gas units," he said. "In the Northeast, cooler-than-normal weather and lower fuel prices drove a 60% increase in our production volumes.... In the West, warmer temperatures led to a 40% decline in our production volumes period over period."

However, in spite of this overall increase in production, lower power prices significantly reduced earnings. Adjusted earnings before interest, taxes, depreciation and amortization (EBITDA) were $198 million, compared to $237 million in 1Q08. This earnings decrease combined with the goodwill impairment charge led to a sizeable loss for Dynegy.

Industrial Info is currently tracking slightly less than $3.2 billion of Dynegy's current and future projects in the U.S. Approximately $2 billion of these projects are occurring at the company's Plum Point Power Plant in Osceola, Arkansas.

Initial construction of the 600-MW grassroot, coal-fired power plant began in March of 2006. Completion of the project is expected in August of 2010. A 665-MW Unit 2 addition to the plant has also been proposed and is still in the permitting stages. Construction of this second unit would probably not begin until mid-2011.

Related News

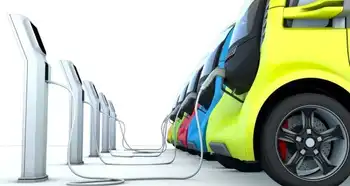
GM president: Electric cars won't go mainstream until we fix these problems

Electric Vehicle Adoption Barriers include range anxiety, charging infrastructure, and cost parity; consumer demand, tax credits, lithium-ion batteries, and performance benefits are accelerating EV uptake, pushing SUVs and self-driving tech toward mainstream mobility.


Key Points

They are the key hurdles to mainstream EV uptake: range anxiety, sparse charging networks, and high upfront costs.

✅ Range targets of 300+ miles reduce anxiety and match ICE convenience

✅ Expanded home, work, and public charging speeds adoption

✅ Falling battery costs and incentives drive price parity


The automotive industry is hurtling toward a future that will change transportation the same way electricity changed how we light the world. Electric and self-driving vehicles will alter the automotive landscape forever — it's only a question of how soon, and whether the age of electric cars arrives ahead of schedule.

Like any revolution, this one will be created by market demand.
Beyond the environmental benefit, electric vehicle owners enjoy the performance, quiet operation, robust acceleration, style and interior space. And EV owners like not having to buy gasoline. We believe the majority of these customers will stay loyal to electric cars, and U.S. EV sales are soaring into 2024 as this loyalty grows.

But what about non-EV owners? Will they want to buy electric, and is it time to buy an electric car for them yet? About 25 years ago, when we first considered getting into the electric vehicle business with a small car that had about 70 miles of range, the answer was no. But today, the results are far more encouraging.

We recently held consumer clinics in Los Angeles and Chicago and presented people with six SUV choices: three gasoline and three electric. When we asked for their first choice to purchase, 40% of the Chicago respondents chose an electric SUV, and 45% in LA did the same. This is despite a several thousand-dollar premium on the price of the electric models, and despite that EV sales still lag gas cars nationally today, consumer interest was strong (but also before crucial government tax credits that we believe will continue to drive people toward electric vehicles and help fuel market demand).

They had concerns, to be sure. Most people said they want vehicles that can match gasoline-powered vehicles in range, ease of ownership and cost. The sooner we can break down these three critical barriers, the sooner electric cars will become mainstream.

Range
Range is the single biggest barrier to EV acceptance. Just as demand for gas mileage doesn't go down when there are more gas stations, demand for better range won't ease even as charging infrastructure improves. People will still want to drive as long as possible between charges.

Most consumers surveyed during our clinics said they want at least 300 miles of range. And if you look at the market today, which is driven by early adapters, electric cars have hit an inflection point in demand, and the numbers bear that out. The vast majority of electric vehicles sold — almost 90% — are six models with the highest range of 238 miles or more — three Tesla models, the Chevrolet Bolt EV, the Hyundai Kona and the Kia Niro, according to IHS Markit data.

Lithium-ion batteries, which power virtually all electric cars on the road today, are rapidly improving, increasing range with each generation. At GM, we recently announced that our 2020 Chevrolet Bolt EV will have a range of 259 miles, a 21-mile improvement over the previous model. Range will continue to improve across the industry, and range anxiety will dissipate.

Charging infrastructure
Our research also shows that, among those who have considered buying an electric vehicle, but haven't, the lack of charging stations is the number one reason why.

For EVs to gain widespread acceptance, manufacturers, charging companies, industry groups and governments at all levels must work together to make public charging available in as many locations as possible. For example, we are seeing increased partnership activity between manufacturers and charging station companies, as well as construction companies that build large infrastructure projects, as the American EV boom approaches, with the goal of adding thousands of additional public charging stations in the United States.

Private charging stations are just as important. Nearly 80% of electric vehicle owners charge their vehicles at home, and almost 15% at work, with the rest at public stations, our research shows. Therefore, continuing to make charging easy and seamless is vital. To that end, more partnerships with companies that will install the chargers in consumers' homes conveniently and affordably will be a boon for both buyers and sellers.

Cost
Another benefit to EV ownership is a lower cost of operation. Most EV owners report that their average cost of operation is about one-third of what a gasoline-powered car owner pays. But the purchase price is typically significantly higher, and that's where we should see change as each generation of battery technology improves efficiency and reduces cost.

Looking forward, we think electric vehicle propulsion systems will achieve cost parity with internal combustion engines within a decade or sooner, and will only get better after that, driving sticker prices down and widening the appeal to the average consumer. That will be driven by a number of factors, including improvements with each generation of batteries and vehicles, as well as expected increased regulatory costs on gasoline and diesel engines.

Removing these barriers will lead to what I consider the ultimate key to widespread EV adoption — the emergence of the EV as a consumer's primary vehicle — not a single-purpose or secondary vehicle. That will happen when we as an industry are able to offer the utility, cost parity and convenience of today's internal combustion-based cars and trucks.

To get the electric vehicle to first-string status, manufacturers simply must make it as good or better than the cars, trucks and crossovers most people are used to driving today. And we must deliver on our promise of making affordable, appealing EVs in the widest range of sizes and body styles possible. When we do that, electric vehicle adoption and acceptance will be widespread, and it can happen sooner than most people think.

Mark Reuss is president of GM. The opinions expressed in this commentary are his own.


Related News

View more

Does Providing Electricity To The Poor Reduce Poverty? Maybe Not

Rural Electrification Poverty Impact examines energy access, grid connections, and reliability, testing economic development claims via randomized trials; findings show minimal gains without appliances, reliable supply, and complementary services like education and job creation initiatives.


Key Points

Study of household grid connections showing modest poverty impact without reliable power and appliances.

✅ Randomized grid connections showed no short-term income gains.

✅ Low reliability and few appliances limited electricity use.

✅ Complementary investments in jobs, education, health may be needed.


The head of Swedfund, the development finance group, recently summarized a widely-held belief: “Access to reliable electricity drives development and is essential for job creation, women’s empowerment and combating poverty.” This view has been the driving force behind a number of efforts to provide electricity to the 1.1 billion people around the world living in energy poverty, such as India's village electrification initiatives in recent years.

But does electricity really help lift households out of poverty? My co-authors and I set out to answer this question. We designed an experiment in which we first identified a sample of “under grid” households in Western Kenya—structures that were located close to but not connected to a grid. These households were then randomly divided into treatment and control groups. In the treatment group, we worked closely with the rural electrification agency to connect the households to the grid for free or at various discounts. In the control group, we made no changes. After eighteen months, we surveyed people from both groups and collected data on an assortment of outcomes, including whether they were employed outside of subsistence agriculture (the most common type of work in the region) and how many assets they owned. We even gave children basic tests, as a frequent assertion is that electricity helps children perform better in school since they are able to study at night.

When we analyzed the data, we found no differences between the treatment and control groups. The rural electrification agency had spent more than $1,000 to connect each household. Yet eighteen months later, the households we connected seemed to be no better off. Even the children’s test scores were more or less the same. The results of our experiment were discouraging, and at odds with the popular view that supplying households with access to electricity will drive economic development. Lifting people out of poverty may require a more comprehensive approach to ensure that electricity is not only affordable (with some evidence that EV growth can benefit all customers in mature markets), but is also reliable, useable, and available to the whole community, paired with other important investments.

For instance, in many low-income countries, the grid has frequent blackouts and maintenance problems, making electricity unreliable, as seen in Nigeria's electricity crisis in recent years. Even if the grid were reliable, poor households may not be able to afford the appliances that would allow for more than just lighting and cell phone charging. In our data, households barely bought any appliances and they used just 3 kilowatt-hours per month. Compare that to the U.S. average of 900 kilowatt-hours per month, a figure that could rise as EV adoption increases electricity demand over time.

There are also other factors to consider. After all, correlation does not equal causation. There is no doubt that the 1.1 billion people without power are the world’s poorest citizens. But this is not the only challenge they face. The poor may also lack running water, basic sanitation, consistent food supplies, quality education, sufficient health care, political influence, and a host of other factors that may be harder to measure but are no less important to well-being. Prioritizing investments in some of these other factors may lead to higher immediate returns. Previous work by one of my co-authors, for example, shows substantial economic gains from government spending on treatment for intestinal worms in children.

It’s possible that our results don’t generalize. They certainly don’t apply to enhancing electricity services for non-residential customers, like factories, hospitals, and schools, and electric utilities adapting to new load patterns. Perhaps the households we studied in Western Kenya are particularly poor (although measures of well-being suggest they are comparable to rural households across Sub-Saharan Africa) or politically disenfranchised. Perhaps if we had waited longer, or if we had electrified an entire region, the household impacts we measured would have been much greater. But others who have studied this question have found similar results. One study, also conducted in Western Kenya, found that subsidizing solar lamps helped families save on kerosene, but did not lead children to study more. Another study found that installing solar-powered microgrids in Indian villages resulted in no socioeconomic benefits.


Related News

View more

Costa Rica hits record electricity generation from 99% renewable sources

Costa Rica Renewable Energy Record highlights 99.99% clean power in May 2019, driven by hydropower, wind, solar, geothermal, and biomass, enabling ICE REM electricity exports and reduced rates from optimized generation totaling 984.19 GWh.


Key Points

May 2019 benchmark: Costa Rica generated 99.99% of 984.19 GWh from renewables, shifting from imports to regional exports.

✅ 99.99% renewable share across hydro, wind, solar, geothermal, biomass

✅ 984.19 GWh generated; ICE suspended imports and exported via REM

✅ Geothermal output increased to offset dry-season hydropower variability


During the whole month of May 2019, Costa Rica generated a total of 984.19 gigawatt hours of electricity, the highest in the country’s history. What makes this feat even more impressive is the fact that 99.99% of this energy came from a portfolio of renewable sources such as hydropower, wind, biomass, solar, and geothermal.

With such a high generation rate, the state power company Instituto Costariccense de Electricidad (ICE) were able to suspend energy imports from the first week of May and shifted to exports, while U.S. renewable electricity surpassed coal in 2022 domestically. To date, the power company continues to sell electricity to the Regional Electricity Market (REM) which generates revenues and is likely to reduce local electricity rates, a trend echoed in places like Idaho where a vast majority of electricity comes from renewables.

The record-breaking power generation was made possible by optimization of the country’s renewable sources, much as U.S. wind capacity surpassed hydro capacity at the end of 2016 to reshape portfolios. As the period coincided with the tail end of the dry season, the geothermal quota had to be increased.

Costa Rica remains a leader in renewable power generation, whereas U.S. wind generation has become the most-used renewable source in recent years. In 2015, more than 98% of the country’s electrical generation came from renewable sources, while U.S. renewables hit a record 28% in April in one recent benchmark. Through the years, this figure has remained fairly constant despite dry bouts caused by the El Niño phenomenon, and U.S. solar generation also continued to rise.


Related News

View more

Electricity demand set to reduce if UK workforce self-isolates

UK Energy Networks Coronavirus Contingency outlines ESO's lockdown electricity demand forecast, reduced industrial and commercial load, rising domestic use, Ofgem guidance needs, grid resilience, control rooms, mutual aid, and backup centers.


Key Points

A coordinated plan with ESO forecasts, safeguards, and mutual aid to keep power and gas services during a lockdown.

✅ ESO forecasts lower industrial use, higher domestic demand

✅ Control rooms protected; backup sites and cross-trained staff

✅ Mutual aid and Ofgem coordination bolster grid resilience


National Grid ESO is predicting a reduction in electricity demand, consistent with residential use trends observed during the pandemic, in the case of the coronavirus spread prompting a lockdown across the country.

Its analysis shows the reduction in commercial and industrial use would outweigh an upsurge in domestic demand, mirroring Ontario demand data seen as people stayed home, according to similar analyses.

The prediction was included in an update from the Energy Networks Association (ENA), in which it sought to reassure the public that contingency plans are in place, reflecting utility disaster planning across electric and gas networks, to ensure services are unaffected by the coronavirus spread.

The body, which represents the UK's electricity and gas network companies, said "robust measures" had been put in place to protect control rooms and contact centres, similar to staff lockdown protocols considered by other system operators, to maintain resilience. To provide additional resilience, engineers have been trained across multiple disciplines and backup centres exist should operations need to be moved if, for example, deep cleaning is required, the ENA said.

Networks also have industry-wide mutual aid arrangements, similar to grid response measures outlined in the U.S., for people and the equipment needed to keep gas and electricity flowing.

ENA chief executive, David Smith, said, echoing system reliability assurances from other markets: "The UK's electricity and gas network is one of the most reliable in the world and network operators are working with the authorities to ensure that their contingency plans are reviewed and delivered in accordance with the latest expert advice. We are following this advice closely and reassuring customers that energy networks are continuing to operate as normal for the public."

Utility Week spoke to a senior figure at one of the networks who reiterated the robust measures in place to keep the lights on, even as grid alerts elsewhere highlight the importance of contingency planning. However, they pleaded for more clarity from Ofgem and government on how its workers will be treated if the coronavirus spread becomes a pandemic in the UK.


Related News

View more

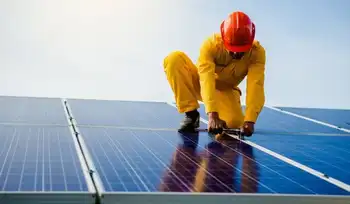
Solar power growth, jobs decline during pandemic

COVID-19 Solar Job Losses are erasing five years of workforce growth, SEIA reports, with U.S. installations and capacity down, layoffs accelerating, 3 GW expected in Q2, and policy support key for economic recovery.


Key Points

COVID-19 Solar Job Losses describe the pandemic-driven decline in U.S. solar employment, installations, and capacity.

✅ SEIA reports a 38% national drop in solar jobs

✅ Q2 installs projected at 3 GW, below forecasts

✅ Layoffs outpace U.S. economy without swift policy aid


Job losses associated with the COVID-19 crisis have wiped out the past five years of workforce growth in the solar energy field, according to a new industry analysis.

The expected June 2020 solar workforce of 188,000 people across the United States is 114,000 below the pre-pandemic forecast of 302,000 workers, a shortfall tied to the solar construction slowdown according to the Solar Energy Industries Association, which said in a statement Monday that the solar industry is now losing jobs at a faster rate than the U.S. economy.

In Massachusetts, the loss of 4,284 solar jobs represents a 52 percent decline from previous projections, according to the association’s analysis.

The national 38 percent drop in solar jobs coincides with a 37 percent decrease in expected solar installations in the second quarter of 2020, and similar pressures have put wind investments at risk across the sector, the association stated. The U.S. is now on track to install 3 gigawatts of new capacity this quarter, though subsequent forecasts anticipated solar and storage growth as investments returned, and the association said the decrease from the expected capacity is equivalent to the electricity needed to power 288,000 homes.

“Thousands of solar workers are being laid off each week, but with swift action from Congress, we know that solar can be a crucial part of our economic recovery,” with proposals such as the Biden solar plan offering a potential policy path, SEIA President and CEO Abigail Ross Hopper said in a statement, as recent analyses point to US solar and wind growth under supportive policies.

Subsequent data showed record U.S. panel shipments as the market rebounded.


Related News

View more

High Natural Gas Prices Make This The Time To Build Back Better - With Clean Electricity

Build Back Better Act Energy Savings curb volatile fossil fuel heating bills by accelerating electrification and renewable electricity, insulating households from natural gas, propane, and oil price spikes while cutting emissions and lowering energy costs.


Key Points

BBBA policies expand clean power and electrification to curb volatility, lower bills, and cut emissions.

✅ Tax credits for renewables, EVs, and efficient all-electric homes

✅ Shields households from natural gas, propane, and heating oil spikes

✅ Cuts methane, lowers bills, and improves grid reliability and jobs


Experts are forecasting serious sticker shock from home heating bills this winter. Nearly 60 percent of United States’ households heat their homes with fossil fuels, including natural gas, propane, or heating oil, and these consumers are expected to spend much more this winter because of fuel price increases.

That could greatly burden many families and businesses already operating on thin margins. Yet homes that use electricity for heating and cooking are largely insulated from the pain of volatile fuel markets, and they’re facing dramatically lower price increases as a result.

Projections say cost increases for households could range anywhere from 22% to 94% more, depending on the fuel used for heating and the severity of the winter temperatures. But the added expenditures for the 41% of U.S. households using electricity for heating are much less stark—these consumers will see only a 6% price increase on average. The projected fossil fuel price spikes are largely due to increased demand, limited supply, declining fuel stores, and shifting investment priorities in the face of climate change.

The fossil fuel industry is already seizing this moment to use high prices to persuade policymakers to vote against clean energy policies, particularly the Build Back Better Act (BBBA). Spokespeople with ties to the fossil fuel industry and some consumer groups are trying to pin higher fuel prices on the proposed legislation even before it has passed, even as analyses show the energy crisis is not spurring a green revolution on its own, let alone begun impacting fuel markets. But the claim the BBBA would cost Americans and the economy is false.

The facts tell a different story. Adopting smart climate policies and accelerating the clean energy transition are precisely the solutions to counter this vicious cycle by ending our dependance on volatile fossil fuels. The BBBA will ensure reliable, affordable clean electricity for millions of Americans, in line with a clean electricity standard many experts advocate—a key strategy for avoiding future vulnerability. Unlike fossil fuels subject to the whims of a global marketplace, wind and sunshine are always free. So renewable-generated electricity comes with an ultra-low fixed price decades into the future.

By expanding clean energy and electric vehicle tax credits, creating new incentives for efficient all-electric homes, and dedicating new funding for state and local programs, the BBBA provides practical solutions that build on lessons from Biden's climate law to protect Americans from price shocks, save consumers money, and reduce emissions fueling dangerous climate change.


What’s really causing the gas price spikes?
The U.S. Energy Information Administration’s winter 2021 energy price forecasts project that homes heated with natural gas, fuel oil, and propane will see average price increases of 30%, 43%, and 54%, respectively. Those who heat their homes with electricity, on the other hand, should expect a modest 6% increase. At the pump, drivers are seeing some of the highest gas prices in nearly a decade as the U.S. energy crisis ripples through electricity, gas, and EV markets today. And the U.S. is not alone. Countries around the globe are experiencing similar price jumps, including Britain's high winter energy costs this season.

A closer look confirms the cause of these high prices is not clean energy or climate policies—it’s fossil fuels themselves.  

First, the U.S. (and the world) are just now feeling the effects of the oil and gas industry’s reduced fuel production and spending due to the pandemic. COVID-19 brought the world’s economies to a screeching halt, and most countries have not returned to pre-COVID economic activity. During the past 20 months, the oil and gas industry curtailed its production to avoid oversupply as demand fell to all-time lows. Just as businesses were reopening, stored fuel was needed to meet high demand for cooling during 2021’s hottest summer on record, driving sky-high summer energy bills for many households. February’s Texas Big Freeze also disrupted gas distribution and production.

The world is moving again and demand for goods and services is rebounding to pre-pandemic levels. But even with higher energy demand, OPEC announced it would not inject more oil into the economy. Major oil companies have also held oil and gas spending flat in 2021, with their share of overall upstream spending at 25%, compared with nearly 40% in the mid-2010s. And as climate change threats loom in the financial world, investors are reducing their exposure to the risks of stranded assets, increasingly diversifying and divesting from fossil fuels. 

Second, despite strong and sustained growth for renewable energy, energy storage, and electric vehicles, the relatively slow pace to adopt fossil fuel alternatives at scale has left U.S. households and businesses tethered to an industry well-known for price volatility. Today, some oil drillers are using profits from higher gas prices to pay back debt and reward shareholders as demanded by investors, instead of increasing supply. Rising prices for a limited commodity in high demand is generating huge profits for many of the world’s largest companies at the expense of U.S. households.

Because 48% of homes use fossil gas for heating and another 10% heat with propane and fuel oil, more than half of U.S. households will feel the impact of rising prices on their home energy bills. One in four U.S. households continues to experience a high energy burden (meaning their energy expenses consume an inordinate amount of their income), including risks of pandemic power shut-offs that deepen energy insecurity, and many are still experiencing financial hardships exacerbated by the pandemic. Those with inefficient fossil-fueled appliances, homes, and cars will be hardest hit, and many families with fixed- and lower-incomes could be forced to choose between heat or other necessities.

We have the solutions—the BBBA will unlock their benefits for all households

Short-term band-aids may be enticing, but long-term policies are the only way out of this negative feedback loop. Clean energy and building electrification will prevent more costly disasters in the future, but they’re the very solutions the fossil fuel industry fights at every turn. All-electric homes and vehicles are a natural hedge against the price spikes we’re experiencing today since renewables are inherently devoid of fuel-related price fluctuations.

RMI analysis shows all-electric single-family homes in all regions of the country have lower energy bills than a comparable mixed fuel-homes (i.e., electricity and gas). Electric vehicles also save consumers money. Research from University of California, Berkeley and Energy Innovation found consumers could save a total of $2.7 trillion in 2050—or $1,000 per year, per household for the next 30 years—if we accelerate electric vehicle deployment in the coming decade.

The BBBA would help deliver these consumer savings by expanding and expediting clean energy, while ensuring equitable adoption among lower-income households and underserved communities. Extending and expanding clean energy tax credits; new incentives for electric vehicles (including used electric vehicles); and new incentives for energy efficient homes and all-electric appliances (and electrical upgrades) will reduce up-front costs and spur widespread adoption of all-electric homes, buildings, and cars.

A combination of grants, incentives, and programs will promote private sector investments in a decarbonized economy, while also funding and supporting state and local governments already leading the way. The BBBA also allocates dedicated funding and makes important modifications (such as higher rebate amounts and greater point-of-purchase availability) to ensure these technologies are available to low-income households, underserved urban and rural communities, tribes, frontline communities, and people living in multifamily housing.

Finally, the BBBA proposes to make oil and gas polluters pay for the harm they are causing to people’s health and the climate through a methane fee. This fee would cost companies less than 1% of their revenue, meaning the industry would retain over 99% of its profits. In return return we’d see substantial reductions of a powerful greenhouse gas and a healthier environment in communities living near fossil fuel production. These benefits also come with a stronger economy—Energy Innovation analysis shows the methane fee would create more than 70,000 jobs by 2050 and boost gross domestic product more than $250 billion from 2023 to 2050.

The facts speak for themselves. Gas prices are rising because of reasons totally unrelated to smart climate and clean energy policies, which research shows actually lower costs. For the first time in more than a decade, America has the opportunity to enact a comprehensive energy policy that will yield measurable savings to consumers and free us from oil and gas industry control over our wallets.

The BBBA will help the U.S. get off the fossil fuel rollercoaster and achieve a stable energy future, ensuring that today’s price spikes will be a thing of the past. Proving, once and for all, that the solution to our fossil fuel woes is not more fossil fuels.


Related News

View more

Sign Up for Electricity Forum’s Newsletter

Stay informed with our FREE Newsletter — get the latest news, breakthrough technologies, and expert insights, delivered straight to your inbox.

Electricity Today T&D Magazine Subscribe for FREE

Stay informed with the latest T&D policies and technologies.
  • Timely insights from industry experts
  • Practical solutions T&D engineers
  • Free access to every issue

Download the 2025 Electrical Training Catalog

Explore 50+ live, expert-led electrical training courses –

  • Interactive
  • Flexible
  • CEU-cerified