Renewable power generation rises in the UK

By Industrial Info Resources


NFPA 70e Training

Our customized live online or in‑person group training can be delivered to your staff at your location.

  • Live Online
  • 6 hours Instructor-led
  • Group Training Available
Regular Price:
$199
Coupon Price:
$149
Reserve Your Seat Today
The amount of power generated in the UK from renewable sources rose to 5.5% of total electricity generation in 2008, an increase of 4.9% over 2007.

According to the statistics published in the Digest of United Kingdom Energy Statistics 2009, published by the Department of Energy and Climate Change (DECC), on a renewable obligation basis, 5.4% of electricity came from eligible sources, which is nearly treble the 1.8% achieved 2002. Overall, UK energy consumption in 2008 decreased 1.1%.

In 2008, renewables again showed an increase in contribution to the overall energy generation picture. Under the Renewables Obligation to the UK electricity sales policy, energy from renewables has grown from 4.5% in 2006 to 4.8% in 2007 and 5.4% in 2008. Installed electrical generating capacity of renewable sources rose by 19% in 2008, thanks mainly to a 49% increase in offshore wind capacity, a 38% increase in onshore wind capacity and a modest 4% increase in the capacity of sites fuelled by biomass and wastes.

Electricity supplied from nuclear sources continued to decline in 2008, accounting for 47.7 terawatt hours (TWh), or 13% of the total electricity supply of 379 TWh. This is the lowest proportion contributed by nuclear power since 1981.

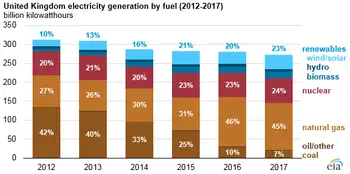
On the other hand, overall gas demand rose 3.1%, with gas demand for electricity generation rising 6.2%. Gas' share of the UK's supply of electricity was 45%. Conversely, coal consumption fell 7.5% overall in 2008, while there was a 9% decrease in consumption by major power producers, which typically accounts for 82% of total coal demand. About 32% of the electricity generated in the UK came from coal in 2008, down from 34% in 2007.

Last year saw a 0.4% decrease in the total supply of electricity in the UK in 2008 to 399.6 TWh, the third successive year that total electricity supply has fallen. Indigenous electricity supply fell 1.8%, but net imports of electricity more than doubled to 11 TWh caused by both higher imports and lower exports.

Unlike 2007, last year saw the domestic sector becoming the largest electricity consumer (117.8 TWh), while the industrial sector consumed 113.6 TWh. In 2008, domestic consumption increased 2.4%, and industrial consumption decreased 2.9%. The largest energy-consuming industrial sector was Chemical Processing Industry, which accounted for 18% of all industrial energy consumption.

Related News

Project examines potential for Europe's power grid to increase HVDC Technology

HVDC-WISE Project accelerates HVDC technology integration across the European transmission system, delivering a planning toolkit to boost grid reliability, resilience, and interconnectors for renewables and offshore wind amid climate, cyber, and physical threats.


Key Points

EU-funded project delivering tools to integrate HVDC into Europe's grid, improving reliability, resilience, and security.

✅ EU Horizon Europe-backed consortium of 14 partners

✅ Toolkit to assess extreme events and grid operability

✅ Supports interconnectors, offshore wind, and renewables


A partnership of 14 leading European energy industry companies, research organizations and universities has launched a new project to identify opportunities to increase integration of HVDC technology into the European transmission system, echoing calls to invest in smarter electricity infrastructure from abroad.

The HVDC-WISE project, in which the University of Strathclyde is the UK’s only academic partner, is supported by the European Union’s Horizon Europe programme.

The project’s goal is to develop a toolkit for grid developers to evaluate the grid’s performance under extreme conditions and to plan systems, leveraging a digital grid approach that supports coordination to realise the full range of potential benefits from deep integration of HVDC technology into the European transmission system.

The project is focused on enhancing electric grid reliability and resilience while navigating the energy transition. Building and maintaining network infrastructure to move power across Europe is an urgent and complex task, and reducing losses with superconducting cables can play a role, particularly with the continuing growth of wind and solar generation. At the same time, threats to the integrity of the power system are on the rise from multiple sources, including climate, cyber, and physical hazards.


Mutual support

At a time of increasing worries about energy security and as Europe’s electricity systems decarbonise, connections between them to provide mutual support and routes to market for energy from renewables, a dynamic also highlighted in discussions of the western Canadian electricity grid in North America, become ever more important.

In modern power systems, this means making use of High Voltage Direct Current (HVDC) technology.

The earliest forms of technology have been around since the 1960s, but the impact of increasing reliance on HVDC and its ability to enhance a power system’s operability and resilience are not yet fully understood.

Professor Keith Bell, Scottish Power Professor of Future Power Systems at the University of Strathclyde, said:

As an island, HVDC is the only practical way for us to build connections to other countries’ electricity systems. We’re also making use of it within our system, with one existing and more planned Scotland-England subsea link projects connecting one part of Britain to another.

“These links allow us to maximise our use of wind energy. New links to other countries will also help us when it’s not windy and, together with assets like the 2GW substation now in service, to recover from any major disturbances that might occur.

“The system is always vulnerable to weather and things like lightning strikes or short circuits caused by high winds. As dependency on electricity increases, insights from electricity prediction specialists can inform planning as we enhance the resilience of the system.”

Dr Agusti Egea-Alvarez, Senior Lecturer at Strathclyde, said: “HVDC systems are becoming the backbone of the British and European electric power network, either interconnecting countries, or connecting offshore wind farms.

“The tools, procedures and guides that will be developed during HVDC-WISE will define the security, resilience and reliability standards of the electric network for the upcoming decades in Europe.”

Other project participants include Scottish Hydro Electric Transmission, the Supergrid Institute, the Electric Power Research Institute (EPRI) Europe, Tennet TSO, Universidad Pontificia Comillas, TU Delft, Tractebel Impact and the University of Cyprus.


Climate change

Eamonn Lannoye, Managing Director of EPRI Europe, said: “The European electricity grid is remarkably reliable by any standard. But as the climate changes and the grid becomes exposed to more extreme conditions, energy interdependence between regions intensifies and threats from external actors emerge. The new grid needs to be robust to those challenges.”

Juan Carlos Gonzalez, a senior researcher with the SuperGrid Institute which leads the project said: “The HVDC-WISE project is intended to provide planners with the tools and know-how to understand how grid development options perform in the context of changing threats and to ensure reliability.”

HVDC-WISE is supported by the European Union’s Horizon Europe programme under agreement 101075424 and by the UK Research and Innovation Horizon Europe Guarantee scheme.


Related News

View more

UK low-carbon electricity generation stalls in 2019

UK low-carbon electricity 2019 saw stalled growth as renewables rose slightly, wind expanded, nuclear output fell, coal hit record lows, and net-zero targets demand faster deployment to cut CO2 intensity below 100gCO2/kWh.


Key Points

Low-carbon sources supplied 54% of UK power in 2019, up just 1TWh; wind grew, nuclear fell, and coal dropped to 2%.

✅ Wind up 8TWh; nuclear down 9TWh amid outages

✅ Fossil fuels 43% of generation; coal at 2%

✅ Net-zero needs 15TWh per year added to 2030


The amount of electricity generated by low-carbon sources in the UK stalled in 2019, Carbon Brief analysis shows.

Low-carbon electricity output from wind, solar, nuclear, hydro and biomass rose by just 1 terawatt hour (TWh, less than 1%) in 2019. It represents the smallest annual increase in a decade, where annual growth averaged 9TWh. This growth will need to double in the 2020s to meet UK climate targets while replacing old nuclear plants as they retire.

Some 54% of UK electricity generation in 2019 came from low-carbon sources, including 37% from renewables and 20% from wind alone, underscoring wind's leading role in the power mix during key periods. A record-low 43% was from fossil fuels, with 41% from gas and just 2% from coal, also a record low. In 2010, fossil fuels generated 75% of the total.

Carbon Brief’s analysis of UK electricity generation in 2019 is based on figures from BM Reports and the Department for Business, Energy and Industrial Strategy (BEIS). See the methodology at the end for more on how the analysis was conducted.

The numbers differ from those published earlier in January by National Grid, which were for electricity supplied in Great Britain only (England, Wales and Scotland, but excluding Northern Ireland), including via imports from other countries.

Low-carbon low
In 2019, the UK became the first major economy to target net-zero greenhouse gas emissions by 2050, increasing the ambition of its legally binding Climate Change Act.

To date, the country has cut its emissions by around two-fifths since 1990, with almost all of its recent progress coming from the electricity sector.

Emissions from electricity generation have fallen rapidly in the decade since 2010 as coal power has been almost phased out and even gas output has declined. Fossil fuels have been displaced by falling demand and by renewables, such as wind, solar and biomass.

But Carbon Brief’s annual analysis of UK electricity generation shows progress stalled in 2019, with the output from low-carbon sources barely increasing compared to a year earlier.

The chart below shows low-carbon generation in each year since 2010 (grey bars) and the estimated level in 2019 (red). The pale grey bars show the estimated future output of existing low-carbon sources after old nuclear plants retire and the pale red bars show the amount of new generation needed to keep electricity sector emissions to less than 100 grammes of CO2 per kilowatt hour (gCO2/kWh), the UK’s nominal target for the sector.

 Annual electricity generation in the UK by fuel, terawatt hours, 2010-2019. Top panel: fuel by fuel. Bottom panel: cumulative total generation from all sources. Source: BEIS energy trends, BM Reports and Carbon Brief analysis. Chart by Carbon Brief using Highcharts.
As the chart shows, the UK will require significantly more low-carbon electricity over the next decade as part of meeting its legally binding climate goals.

The nominal 100gCO2/kWh target for 2030 was set in the context of the UK’s less ambitious goal of cutting emissions to 80% below 1990 levels by 2050. Now that the country is aiming to cut emissions to net-zero by 2050, that 100gCO2/kWh indicator is likely to be the bare minimum.

Even so, it would require a rapid step up in the pace of low-carbon expansion, compared to the increases seen over the past decade. On average, low-carbon generation has risen by 9TWh each year in the decade since 2010 – including a rise of just 1TWh in 2019.

Given scheduled nuclear retirements and rising demand expected by the Committee on Climate Change (CCC) – with some electrification of transport and heating – low-carbon generation would need to increase by 15TWh each year until 2030, just to meet the benchmark of 100gCO2/kWh.

For context, the 3.2 gigawatt (GW) Hinkley C new nuclear plant being built in Somerset will generate around 25TWh once completed around 2026. The world’s largest offshore windfarm, the 1.2GW Hornsea One scheme off the Yorkshire coast, will generate around 5TWh each year.

The new Conservative government is targeting 40GW of offshore wind by 2030, up from today’s figure of around 8GW. If policies are put in place to meet this goal, then it could keep power sector emissions below 100gCO2/kWh, depending on the actual performance of the windfarms built.

However, new onshore wind and solar, further new nuclear or other low-carbon generation, such as gas with carbon capture and storage (CCS), is likely to be needed if demand is higher than expected, or if the 100gCO2/kWh benchmark is too weak in the context of net-zero by 2050.

The CCC says it is “likely” to “reflect the need for more rapid deployment” of low-carbon towards net-zero emissions in its advice on the sixth UK carbon budget for 2033-2037, due in September.

Trading places
Looking more closely at UK electricity generation in 2019, Carbon Brief’s analysis shows why there was so little growth for low-carbon sources compared to the previous year.

There was another increase for wind power in 2019 (up 8TWh, 14%), with record wind generation as several large new windfarms were completed including the 1.2GW Hornsea One project in October and the 0.6GW Beatrice offshore windfarm in Q2 of 2019. But this was offset by a decline for nuclear (down 9TWh, 14%), due to ongoing outages for reactors at Hunterston in Scotland and Dungeness in Kent.

(Analysis of data held by trade organisation RenewableUK suggests some 0.6GW of onshore wind capacity also started operating in 2019, including the 0.2GW Dorenell scheme in Moray, Scotland.)

As a result of these movements, the UK’s windfarms overtook nuclear for the first time ever in 2019, becoming the country’s second-largest source of electricity generation, and earlier, wind and solar together surpassed nuclear in the UK as momentum built. This is shown in the figure below, with wind (green line, top panel) trading places with nuclear (purple) and gas (dark blue) down around 25% since 2010 but remaining the single-largest source.

 Annual electricity generation in the UK by fuel, terawatt hours, 2010-2019. Top panel: fuel by fuel. Bottom panel: cumulative total generation from all sources. Source: BEIS energy trends, BM Reports and Carbon Brief analysis. Chart by Carbon Brief using Highcharts.
The UK’s currently suspended nuclear plants are due to return to service in January and March, according to operator EDF, the French state-backed utility firm. However, as noted above, most of the UK’s nuclear fleet is set to retire during the 2020s, with only Sizewell B in Suffolk due to still be operating by 2030. Hunterston is scheduled to retire by 2023 and Dungeness by 2028.

Set against these losses, the UK has a pipeline of offshore windfarms, secured via “contracts for difference” with the government, at a series of auctions. The most recent auction, in September 2019, saw prices below £40 per megawatt hour – similar to current wholesale electricity prices.

However, the capacity contracted so far is not sufficient to meet the government’s target of 40GW by 2030, meaning further auctions – or some other policy mechanism – will be required.

Coal zero
As well as the switch between wind and nuclear, 2019 also saw coal fall below solar for the first time across a full year, echoing the 2016 moment when wind outgenerated coal across the UK, after it suffered another 60% reduction in electricity output. Just six coal plants remain in the UK, with Aberthaw B in Wales and Fiddlers Ferry in Cheshire closing in March.

Coal accounted for just 2% of UK generation in 2019, a record-low coal share since centralised electricity supplies started to operate in 1882. The fuel met 40% of UK needs as recently as 2012, but has plummeted thanks to falling demand, rising renewables, cheaper gas and higher CO2 prices.

The reduction in average coal generation hides the fact that the fuel is now often not required at all to meet the UK’s electricity needs. The chart below shows the number of days each year when coal output was zero in 2019 (red line) and the two previous years (blue).

 Cumulative number of days when UK electricity generation from renewable sources has been higher than that from fossil fuels. Source: BEIS energy trends, BM Reports and Carbon Brief analysis. Chart by Carbon Brief using Highcharts.
The 83 days in 2019 with zero coal generation amount to nearly a quarter of the year and include the record-breaking 18-day stretch without the fuel.

Great Britain has been running for a record TWO WEEKS without using coal to generate electricity – the first time this has happened since 1882.

The country’s grid has been coal-free for 45% of hours in 2019 so far.https://www.carbonbrief.org/countdown-to-2025-tracking-the-uk-coal-phase-out …

Coal generation was set for significant reductions around the world in 2019 – including a 20% reduction for the EU as a whole – according to analysis published by Carbon Brief in November.

Notably, overall UK electricity generation fell by another 9TWh in 2019 (3%), bringing the total decline to 58TWh since 2010. This is equivalent to more than twice the output from the Hinkley C scheme being built in Somerset. As Carbon Brief explained last year, falling demand has had a similar impact on electricity-sector CO2 emissions as the increase in output from renewables.

This is illustrated by the fact that the 9TWh reduction in overall generation translated into a 9TWh (6%) cut in fossil-fuel generation during 2019, with coal falling by 10TWh and gas rising marginally.

Increasingly renewable
As fossil-fuel output and overall generation have declined, the UK’s renewable sources of electricity have continued to increase. Their output has risen nearly five-fold in the past decade and their share of the UK total has increased from 7% in 2010 to 37% in 2019.

As a result, the UK’s increasingly renewable grid is seeing more minutes, hours and days during which the likes of wind, solar and biomass collectively outpace all fossil fuels put together, and on some days wind is the main source as well.

The chart below shows the number of days during each year when renewables generated more electricity than fossil fuels in 2019 (red line) and each of the previous four years (blue lines). In total, nearly two-fifths of days in 2019 crossed this threshold.

 Cumulative number of days when the UK has not generated any electricity from coal. Source: BEIS energy trends, BM Reports and Carbon Brief analysis. Chart by Carbon Brief using Highcharts.
There were also four months in 2019 when renewables generated more of the UK’s electricity than fossil fuels: March, August, September and December. The first ever such month came in September 2018 and more are certain to follow.

National Grid, which manages Great Britain’s high-voltage electricity transmission network, is aiming to be able to run the system without fossil fuels by 2025, at least for short periods. At present, it sometimes has to ask windfarm operators to switch off and gas plants to start running in order to keep the electricity grid stable.

Note that biomass accounted for 11% of UK electricity generation in 2019, nearly a third of the total from all renewables. Some two-thirds of the biomass output is from “plant biomass”, primarily wood pellets burnt at Lynemouth in Northumberland and the Drax plant in Yorkshire. The remainder was from an array of smaller sites based on landfill gas, sewage gas or anaerobic digestion.

The CCC says the UK should “move away” from large-scale biomass power plants, once existing subsidy contracts for Drax and Lynemouth expire in 2027.

Using biomass to generate electricity is not zero-carbon and in some circumstances could lead to higher emissions than from fossil fuels. Moreover, there are more valuable uses for the world’s limited supply of biomass feedstock, the CCC says, including carbon sequestration and hard-to-abate sectors with few alternatives.

Methodology
The figures in the article are from Carbon Brief analysis of data from BEIS Energy Trends chapter 5 and chapter 6, as well as from BM Reports. The figures from BM Reports are for electricity supplied to the grid in Great Britain only and are adjusted to include Northern Ireland.

In Carbon Brief’s analysis, the BM Reports numbers are also adjusted to account for electricity used by power plants on site and for generation by plants not connected to the high-voltage national grid. This includes many onshore windfarms, as well as industrial gas combined heat and power plants and those burning landfill gas, waste or sewage gas.

By design, the Carbon Brief analysis is intended to align as closely as possible to the official government figures on electricity generated in the UK, reported in BEIS Energy Trends table 5.1.

Briefly, the raw data for each fuel is in most cases adjusted with a multiplier, derived from the ratio between the reported BEIS numbers and unadjusted figures for previous quarters.

Carbon Brief’s method of analysis has been verified against published BEIS figures using “hindcasting”. This shows the estimates for total electricity generation from fossil fuels or renewables to have been within ±3% of the BEIS number in each quarter since Q4 2017. (Data before then is not sufficient to carry out the Carbon Brief analysis.)

For example, in the second quarter of 2019, a Carbon Brief hindcast estimates gas generation at 33.1TWh, whereas the published BEIS figure was 34.0TWh. Similarly, it produces an estimate of 27.4TWh for renewables, against a BEIS figure of 27.1TWh.

National Grid recently shared its own analysis for electricity in Great Britain during 2019 via its energy dashboard, which differs from Carbon Brief’s figures.


Related News

View more

What to know about the big climate change meeting in Katowice, Poland

COP24 Climate Talks in Poland gather nearly 200 nations to finalize the Paris Agreement rulebook, advance the Talanoa Dialogue, strengthen emissions reporting and transparency, and align finance, technology transfer, and IPCC science for urgent mitigation.


Key Points

UNFCCC summit in Katowice to finalize Paris rules, enhance transparency, and drive stronger emissions cuts.

✅ Paris rulebook on reporting, transparency, markets, and timelines

✅ Talanoa Dialogue to assess gaps and raise ambition by 2020

✅ Finance and tech transfer for developing countries under UNFCCC


Delegates from nearly 200 countries have assembled this month in Katowice, Poland — the heart of coal country — to try to move the ball forward on battling climate change.

It’s now the 24th annual meeting, or “COP” — conference of the parties — under the landmark U.N. Framework Convention on Climate Change, which the United States signed under then-President George H.W. Bush in 1992. More significantly, it’s the third such meeting since nations adopted the Paris climate agreement in 2015, widely seen at the time as a landmark moment in which, at last, developed and developing countries would share a path toward cutting greenhouse gas emissions, as Obama's clean energy push sought to lock in momentum.

But the surge of optimism that came with Paris has faded lately. The United States, the second largest greenhouse gas emitter, said it would withdraw from the agreement, though it has not formally done so yet. Many other countries are off target when it comes to meeting their initial round of Paris promises — promises that are widely acknowledged to be too weak to begin with. And emissions have begun to rise after a brief hiatus that had lent some hope of progress.

The latest science, meanwhile, is pointing toward increasingly dire outcomes. The amount of global warming that the world already has seen — 1 degree Celsius, 1.8 degrees Fahrenheit — has upended the Arctic, is killing coral reefs and may have begun to destabilize a massive part of Antarctica. A new report from the U.N.'s Intergovernmental Panel on Climate Change (IPCC), requested by the countries that assembled in Paris to be timed for this year’s meeting, finds a variety of increasingly severe effects as soon as a rise of 1.5 degrees Celsius arrives — an outcome that can’t be avoided without emissions cuts so steep that they would require societal transformations without any known historical parallel, the panel found.

It’s in this context that countries are meeting in Poland, with expectations and stakes high.

So what’s on the agenda in Poland?

The answer starts with the Paris agreement, which was negotiated three years ago, has been signed by 197 countries and is a mere 27 pages long. It covers a lot, laying out a huge new regime not only for the world as a whole to cut its greenhouse gas emissions, but for each individual country to regularly make new emissions-cutting pledges, strengthen them over time, report emissions to the rest of the world and much more. It also addresses financial obligations that developed countries have to developing countries, including how to achieve clean and universal electricity at scale, and how technologies will be transferred to help that.

But those 27 pages leave open to interpretation many fine points for how it will all work. So in Poland, countries are performing a detailed annotation of the Paris agreement, drafting a “rule book” that will span hundreds of pages.

That may sound bureaucratic, but it’s key to addressing many of the flash points. For instance, it will be hard for countries to trust that their fellow nations are cutting emissions without clear standards for reporting and vetting. Not everybody is ready to accept a process like the one followed in the United States, which not only publishes its emissions totals but also has an independent review of the findings.

“A number of the developing countries are resisting that kind of model for themselves. They see it as an intrusion on their sovereignty,” said Alden Meyer, director of strategy and policy at the Union of Concerned Scientists and one of the many participants in Poland this week. “That’s going to be a pretty tough issue at the end of the day.”

It’s hardly the only one. Also unclear is what countries will do after the time frames on their current emissions-cutting promises are up, which for many is 2025 or 2030. Will all countries then start reporting newer and more ambitious promises every five years? Every 10 years?

That really matters when five years of greenhouse gas emissions — currently about 40 billion tons of carbon dioxide annually — are capable of directly affecting the planet’s temperature.

What can we expect each day?

The conference is in its second week, when higher-level players — basically, the equivalent of cabinet-level leaders in the United States — are in Katowice to advance the negotiations.

As this happens, several big events are on the agenda. On Tuesday and Wednesday is the “Talanoa Dialogue,” which will bring together world leaders in a series of group meetings to discuss these key questions: “Where are we? Where do we want to go? How do we get there?”

Friday is the last day of the conference, but pros know these events tend to run long. On Friday — or after — we will be waiting for an overall statement or decision from the meeting which may signal how much has been achieved.

What is the “Talanoa Dialogue”?

“Talanoa” is a word used in Fiji and in many other Pacific islands to refer to “the sharing of ideas, skills and experience through storytelling.” This is the process that organizers settled on to fulfill a plan formed in Paris in 2015.

That year, along with signing the Paris agreement, nations released a decision that in 2018 there should be a “facilitative dialogue" among the countries “to take stock” of where their efforts stood to reduce greenhouse gas emissions. This was important because going into that Paris meeting, it was already clear that countries' promises were not strong enough to hold global warming below a rise of 2 degrees Celsius (3.6 degrees Fahrenheit) above preindustrial temperatures.

This dialogue, in the Talanoa process, was meant to prompt reflection and maybe even soul searching about what more would have to be done. Throughout the year, “inputs” to the Talanoa dialogue — most prominently, the recent report by the United Nations' Intergovernmental Panel on Climate Change on the meaning and consequences of 1.5 degrees Celsius of warming —have been compiled and synthesized. Now, over two days in Poland, countries' ministers will assemble to share stories in small groups about what is working and what is not and to assess where the world as a whole is on achieving the required greenhouse gas emissions reductions.

What remains to be seen is whether this process will culminate in any kind of product or statement that calls clearly for immediate, strong ramping up of climate change promises across the world.

With the clock ticking, will countries do anything to increase their ambition at this meeting?

If negotiating the Paris rule book sounds disappointingly technical, well, you’re not the only one feeling that way. Pressure is mounting for countries to accomplish something more than that in Poland — to at minimum give a strong signal that they understand that the science is looking worse and worse, and the world’s progress on the global energy transition isn’t matching that outlook.

“The bigger issue is how we’re going to get to an outcome on greater ambition,” said Lou Leonard, senior vice president for climate and energy at the World Wildlife Fund, who is in Poland observing the talks. “And I think the first week was not kind on moving that part of the agenda forward.”

Most countries are not likely to make new emissions-cutting promises this week. But there are two ways that the meeting could give a strong statement that countries should — or will — come up with new promises at least by 2020. That’s when extremely dramatic emissions cuts would have to start, including progress toward net-zero electricity by mid-century, according to the recent report on 1.5 degrees Celsius of warming.

The first is the aforementioned “Talanoa dialogue” (see above). It’s possible that the outcome of the dialogue could be a statement acknowledging that the world isn’t nearly far enough along and calling for much stronger steps.

There will also be a decision text released for the meeting as a whole, which could potentially send a signal. Leonard said he hopes that would include details for the next steps that will put the world on a better course.

“We have to create milestones, and the politics around it that will pressure countries to do something that quite frankly they don’t want to do,” he said. “It’s not going to be easy. That’s why we need a process that will help make it happen. And make the most of the IPCC report that was designed to come out right now so it could do this for us. That’s why we have it, and it needs to serve that role.”

The United States says it will withdraw from the agreement, so what role is it playing in Poland?

Despite President Trump’s pledge to withdraw, the United States remains in the Paris agreement (for now) and has sent a delegation of 44 people to Poland, largely from the State Department but also from the Environmental Protection Agency, Energy Department and even the White House, while domestically a historic U.S. climate law has recently passed to accelerate clean energy. Many of these career government officials remain deeply engaged in hashing out details of the agreement.

Still, the country as a whole is being cast in an antagonistic role in the talks.


Related News

View more

New rules give British households right to sell solar power back to energy firms

UK Smart Export Guarantee enables households to sell surplus solar energy to suppliers, with dynamic export tariffs, grid payments, and battery-friendly incentives, boosting local renewable generation, microgeneration uptake, and decarbonisation across Britain.


Key Points

UK Smart Export Guarantee pays homes for exporting surplus solar power to the grid via supplier tariffs.

✅ Suppliers must pay households for exported kWh.

✅ Dynamic tariffs incentivize daytime solar generation.

✅ Batteries boost self-consumption and grid flexibility.


Britain’s biggest energy companies will have to buy renewable energy from their own customers through community-generated green electricity models under new laws to be introduced this week.

Homeowners who install new rooftop solar panels from 1 January 2020 will be able to lower their bills as many seek to cut soaring bills by selling the energy they do not need to their supplier.

A record was set at noon on a Friday in May 2017, when solar energy supplied around a quarter of the UK’s electricity, and a recent award that adds 10 GW of renewables indicates further growth.

However, solar panel owners are not always at home on sunny days to reap the benefit. The new rules will allow them to make money if they generate electricity for the grid.

Some 800,000 householders with solar panels already benefit from payments under a previous scheme. However, the subsidies were controversially scrapped by the government in April, with similar reduced credits for solar owners seen in other regions, causing the number of new installations to fall by 94% in May from the month before.

Labour accused the government last week of “actively dismantling” the solar industry. The sector will still struggle this summer as the change does not come in for another seven months, so homeowners have no incentive to buy panels this year.

Chris Skidmore, the minister for energy and clean growth, said the government wanted to increase the number of small-scale generators without adding the cost of subsidies to energy bills. “The future of energy is local and the new smart export guarantee will ensure households that choose to become green energy generators will be guaranteed a payment for electricity supplied to the grid,” he said. The government also hopes to encourage homes with solar panels to install batteries to help manage excess solar power on networks.

Greg Jackson, the founder of Octopus Energy, said: “These smart export tariffs are game-changing when it comes to harnessing the power of citizens to tackle climate change”.

A few suppliers, including Octopus, already offer to buy solar power from their customers, often setting terms for how solar owners are paid that reflect market conditions.

“They mean homes and businesses can be paid for producing clean electricity just like traditional generators, replacing old dirty power stations and pumping more renewable energy into the grid. This will help bring down prices for everyone as we use cheaper power generated locally by our neighbours,” Jackson said.

Léonie Greene, a director at the Solar Trade Association, said it was “vital” that even “very small players” were paid a fair price. “We will be watching the market like a hawk to see if competitive offers come forward that properly value the power that smart solar homes can contribute to the decarbonising electricity grid,” she said.


Related News

View more

Some in Tennessee could be without power for weeks after strong storms hit

Middle Tennessee Power Outages disrupt 100,000+ customers as severe thunderstorms, straight-line winds, downed trees, and debris challenge Nashville crews, slow restoration amid COVID-19, and threaten more hail, flash flooding, and damaging gusts.


Key Points

Blackouts across Nashville after severe storms and winds, leaving customers without power and facing restoration delays.

✅ Straight-line winds 60-80 mph toppled trees and power lines

✅ 130,000+ customers impacted; some outages may last 1-2 weeks

✅ Restoration slowed by debris, COVID-19 protocols, and new storms


Some middle Tennessee residents could be without electricity for up to two weeks after strong thunderstorms swept through the area Sunday, knocking out power for more than 100,000 customers, a scale comparable to Los Angeles outages after a station fire.

"Straight line winds as high as 60-80 miles per hour knocked down trees, power lines and power polls, interrupting power to 130,000 of our 400,000+ customers," Nashville Electric said in a statement Monday. The utility said the outage was one of the largest on record, though Carolina power outages recently left a quarter-million without power as well.

"Restoration times will depend on individual circumstances. In some cases, power could be out for a week or two" as challenges related to coronavirus and the need for utilities adapt to climate change complicated crews' responses and more storms were expected, the statement said. "This is unfortunate timing on the heels of a tornado and as we deal with battling COVID-19."

Metropolitan Nashville and Davidson County Mayor John Cooper also noted that the power outages were especially inconvenient, a challenge similar to Hong Kong families without power during Typhoon Mangkhut, as people were largely staying home to slow the spread of coronavirus. He also pointed out that the storms came on the two month anniversary of the Nashville tornado that left at least two dozen people dead.

"Crews are working diligently to restore power and clear any debris in neighborhoods," Cooper said.

He said that no fatalities were reported in the county but sent condolences to Spring Hill, whose police department reported that firefighter Mitchell Earwood died during the storm due to "a tragic weather-related incident" while at his home and off duty. He had served with the fire department for 10 years.

The Metro Nashville Department of Public Works said it received reports of more than 80 downed trees in Davidson County.

Officials also warn that copper theft can be deadly when electrical infrastructure is damaged after storms.

The National Weather Service Nashville said a 72 mph wind gust was measured at Nashville International Airport — the fifth fastest on record.

The weather service warned that strong storms with winds of up to 75 mph, large hail, record-long lightning bolt potential seen in the U.S., and isolated flash flooding could hit middle Tennessee again Monday afternoon and night.

"Treat Severe Thunderstorm Warnings the same way you would Tornado Warnings and review storm safety tips before you JUST TAKE SHELTER," the NWS instructs. "70 mph is 70 mph whether it's spinning around in a circle or blowing in a straight line."


Related News

View more

IEA: Electricity investment surpasses oil and gas for the first time

Electricity Investment Surpasses Oil and Gas 2016, driven by renewable energy, power grids, and energy efficiency, as IEA reports lower oil and gas spending, rising solar and wind capacity, and declining coal power plant approvals.


Key Points

A 2016 milestone where electricity topped global energy investment, led by renewables, grids, and efficiency, per the IEA.

✅ IEA: electricity investment hit $718b; oil and gas fell to $650b.

✅ Renewables led with $297b; solar and wind unit costs declined.

✅ Coal plant approvals plunged; networks and storage spending rose.


Investments in electricity surpassed those in oil and gas for the first time ever in 2016 on a spending splurge on renewable energy and power grids as the fall in crude prices led to deep cuts, the International Energy Agency (IEA) said.

Total energy investment fell for the second straight year by 12 per cent to US$1.7 trillion compared with 2015, the IEA said. Oil and gas investments plunged 26 per cent to US$650 billion, down by over a quarter in 2016, and electricity generation slipped 5 per cent.

"This decline (in energy investment) is attributed to two reasons," IEA chief economist Laszlo Varro told journalists.

"The reaction of the oil and gas industry to the prolonged period of low oil prices which was a period of harsh investment cuts; and technological progress which is reducing investment costs in both renewable power and in oil and gas," he said.

Oil and gas investment is expected to rebound modestly by 3 per cent in 2017, driven by a 53 per cent upswing in U.S. shale, and spending in Russia and the Middle East, the IEA said in a report.

"The rapid ramp up of U.S. shale activities has triggered an increase of U.S. shale costs of 16 per cent in 2017 after having almost halved from 2014-16," the report said.

The global electricity sector, however, was the largest recipient of energy investment in 2016 for the first time ever, overtaking oil, gas and coal combined, the report said.

"Robust investments in renewable energy and increased spending in electricity networks, which supports the outlook that low-emissions sources will cover most demand growth, made electricity the biggest area of capital investments," Varro said.

Electricity investment worldwide was US$718 billion, lifted by higher spending in power grids which offset the fall in power generation investments.

"Investment in new renewables-based power capacity, at US$297 billion, remained the largest area of electricity spending, despite falling back by 3 per cent as clean energy investment in developing nations slipped, the report said."

Although renewables investments was 3 per cent lower than five years ago, capacity additions were 50 per cent higher and expected output from this capacity about 35 per cent higher, thanks to the fall in unit costs and technology improvements in solar PV and wind generation, the IEA said.


COAL INVESTMENT IS COMING TO AN END

Investments in coal-fired electricity plants fell sharply. Sanctioning of new coal power plants fell to the lowest level in nearly 15 years, reflecting concerns about local air pollution, and emergence of overcapacity and competition from renewables, with renewables poised to eclipse coal in global power generation, notably in China. Coal investments, however, grew in India.

"Coal investment is coming to an end. At the very least, it is coming to a pause," Varro said.

The IEA report said energy efficiency investments continued to expand in 2016, reaching US$231 billion, with most of it going to the building sector globally.

Electric vehicles sales rose 38 per cent in 2016 to 750,000 vehicles at $6 billion, and represented 10 per cent of all transport efficiency spending. Some US$6 billion was spent globally on electronic vehicle charging stations, the IEA said.

Spending on electricity networks and storage continued the steady rise of the past five years, as surging electricity demand puts power systems under strain, reaching an all-time high of US$277 billion in 2016, with 30 per cent of the expansion driven by China’s spending in its distribution system, the report said.

China led the world in energy investments with 21 per cent of global total share, the report said, driven by low-carbon electricity supply and networks projects.

Although oil and gas investments fell in the United States in 2016, its total energy investments rose 16 per cent, even as Americans use less electricity in recent years, on the back of spending in renewables projects, the IEA report said.


Related News

View more

Sign Up for Electricity Forum’s Newsletter

Stay informed with our FREE Newsletter — get the latest news, breakthrough technologies, and expert insights, delivered straight to your inbox.

Electricity Today T&D Magazine Subscribe for FREE

Stay informed with the latest T&D policies and technologies.
  • Timely insights from industry experts
  • Practical solutions T&D engineers
  • Free access to every issue

Download the 2025 Electrical Training Catalog

Explore 50+ live, expert-led electrical training courses –

  • Interactive
  • Flexible
  • CEU-cerified