Canada Clean Electricity Expansion is urged by the IEA to meet net-zero targets, scaling non-emitting generation, electrification, EV demand, and grid integration across provinces to decarbonize industry, buildings, and transport while ensuring reliability and affordability.
Key Points
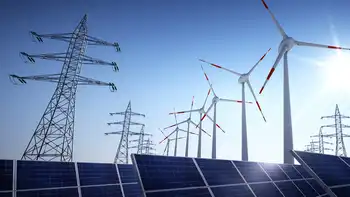
An IEA-backed pathway for Canada to scale non-emitting power, electrification, and grid links to meet net-zero goals.
✅ Double or triple clean generation to replace fossil fuels
✅ Integrate provincial grids to decarbonize dependent regions
✅ Manage EV and heating loads with reliability and affordability
Canada will need more electricity capacity if it wants to hit its climate targets, and cleaning up Canada's electricity will be critical, according to a new report from the International Energy Agency (IEA).
The report offers mainly a rosy picture of Canada's overall federal energy policy. But, the IEA draws attention to Canada's increasing future electricity demands, and ultimately, calls on Canada to leverage its non-emitting energy potential and expand renewable energy to hit its climate targets.
"Canada's wealth of clean electricity and its innovative spirit can help drive a secure and affordable transformation of its energy system and help realize its ambitious goals," stated Fatih Birol, the IEA executive director, in a news release.
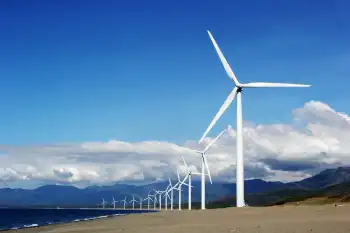
The IEA notes that Canada has one of the cleanest energy grids globally, with 83 per cent of electricity coming from non-emitting sources in 2020. But this reflects nationwide progress in electricity to date; the report warns this is not a reason for Canada to rest on its laurels. More electricity will be needed to displace fossil fuels if Canada wants to hit its 2030 targets, the report states, and "even deeper cuts" will be required to reach net-zero by 2050.
"Perhaps more significantly, however, Canada will need to ensure sufficient new clean generation capacity to meet the sizeable levels of electrification that its net-zero targets imply."
Investing in new coal, oil and gas projects must stop to hit climate goals, global energy agency says
The Liberals have promised to create a 100 percent net-zero-emitting electricity system by 2035, with regulating oil and gas emissions and electric car sales as part of the plan; by then, every new light-duty vehicle sold in Canada will be a zero-emission vehicle. The switch from gas guzzlers to plug-in electric vehicles will create new pressures on Canada's electrical grid, as will any turn away from fossil natural gas for home heating.
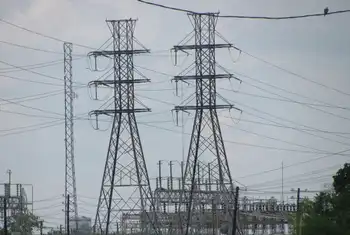
To meet these challenges, the IEA warns, Canada would need to double or triple the power generated from non-emitting sources compared to today, a shift whose cost could reach $1.4 trillion according to the Canadian Gas Association.
"Such a shift will require significant regulatory action," the report states, highlighting the need for climate policy for electricity grids to guide implementation, and that will require the federal government to work closely with provinces and territories that control power generation and distribution.
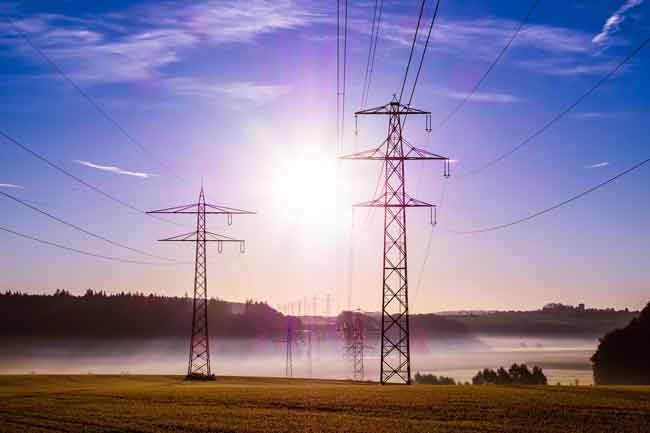
The report notes that the further integration of territorial and provincial electrical grids could allow fossil fuel-dependent provinces, like Alberta, to decarbonize and electrify their economies.
The report, entitled Canada 2022 Energy Policy Review, offers what it calls an "in-depth" look at the commitments Canada has made to transform its energy policy. Since the IEA conducted its last review in 2015, Canada has committed to cutting greenhouse gas emissions by 40 to 45 per cent from 2005 levels by 2030 and achieving net-zero by 2050 under an extended national target.
The IEA is well-known for the production of its annual World Energy Outlook. The Paris-based autonomous intergovernmental organization provides analysis, data, and policy recommendations to promote global energy security and sustainability. Canada is a part of the intergovernmental body, which also conducts peer reviews of its members' energy policy.
Oil and gas emissions rising
Natural Resources Minister Jonathan Wilkinson responded to the report in the IEA news release.
"This report acknowledges Canada's ambitious efforts and historic investments to develop pathways to achieve net-zero emissions by 2050 and ensure a transition that aligns with our shared objective of limiting global warming to 1.5 degrees Celsius," Wilkinson's statement read.
The report notes that — despite that objective — absolute emissions from Canadian oil and gas extraction went up 26 per cent between 2000 and 2019, largely from increased production.
Minister of Natural Resources Jonathan Wilkinson responds to a question at a news conference after the federal cabinet was sworn in, in Ottawa, on Oct. 26, 2021. (Justin Tang/The Canadian Press)
"Canada will need to reconcile future growth in oil sands production with increasingly strict greenhouse gas requirements," the report states.
On the plus side, the IEA found emissions per barrel of oilsands crude have decreased by 20 per cent in the last decade from technical and operational improvements.
The improving carbon efficiency of the oilsands is a "trend that is expected to continue at even higher rates," said Ben Brunnen, vice-president of oilsands, fiscal and economic policy at the Canadian Association of Petroleum Producers.
That may become important, the IEA report notes, as energy investors and buyers look for low-carbon assets and more countries adopt net-zero policies.
Further innovation, such as carbon capture and storage, could help to turn things around for Canada's oil patch, the report says. The Liberals have also said they will place a hard cap on oil and gas emissions from production, but that does not include the burning of the fossil fuels.
In 2021, the IEA released a report that determined to achieve net-zero by 2050, among many steps, investments needed to end in coal mines, oil and gas wells. Thursday's report, however, made no mention of that, which disappointed at least one environmental group.
"A glaring omission was that this assessment says nothing about production. We know that the most important thing we can do is to stop using and producing oil and gas," said Julia Levin, a senior climate and energy program manager at Environmental Defence.
"And yet that was absent from this report, and that really is a glaring omission, which is completely out of line with their [the IEA's] own work."
Related News