The Tennessee Valley Authority opened its defense of a lawsuit filed against the utility, and a manager said the TVA is a leader in reducing air pollution from power plants.
The Asheville Citizen-Times reported that John Myers, senior manager of environmental policy and regulatory outlook, testified in the trial of North Carolina's lawsuit against the TVA in U.S. District Court.
The case is being heard without a jury by Judge Lacy Thornburg.
Myers said TVA's coal-fired plants produced about 30 percent more electricity last year than plants in North Carolina while emitting about the same amount of sulfur dioxide. But under cross-examination, Myers acknowledged that Duke Energy and Progress Energy are poised to significantly reduce emissions as required by the Clean Smokestacks Act approved by state lawmakers in 2002.
Myers said the TVA pioneered the use of scrubbers to control pollution at one of its plants in 1977. The agency has since spent $4.8 billion on pollution controls. But he acknowledged that improvements in emission levels have largely been driven by federal and state regulations.
The TVA has scrubbers installed on eight of its 59 power generating units at 11 plants, said Ron Nash, who oversees the construction of pollution controls. The installation of scrubbers should be completed on units at three more plants in eastern Tennessee by 2013, he said. But Nash said it would be difficult to comply with all of North Carolina's demands because it takes about five years to design and construct scrubbers.
TVA estimates its witnesses will be on the stand for five to six days.
The lawsuit filed by N.C. Attorney General Roy Cooper seeks to force the TVA to reduce the amount of pollution that drifts into the state from plants in Tennessee, Alabama and Kentucky. North Carolina has already rested its case.
U.S. Offshore Wind Capacity is set to exceed 1 GW by 2024, driven by BOEM approvals, federal leases, and resilient supply chains, with eastern states scaling renewable energy, turbines, and content despite COVID-19 disruptions.
Key Points
Projected gigawatt-scale offshore wind growth enabled by BOEM approvals, federal leases, and East Coast state demand.
✅ 17+ GW leased; only 1,870 MW in announced first phases.
✅ BOEM approvals are critical to reach >1 GW by 2024.
✅ Local supply chains mitigate COVID-19 impacts and lower costs.
Offshore wind in the U.S. will exceed 1 GW of capacity by 2024 and add more than 1 GW annually by 2027, a trajectory consistent with U.S. offshore wind power trends, according to a report released last week by Navigant Research.
The report calculated over 17 GW of offshore state and federal leases for wind production, reflecting forecasts that $1 trillion offshore wind market growth is possible. However, the owners of those leases have only announced first phase plans for 1,870 MW of capacity, leaving much of the projects in early stages with significant room to grow, according to senior research analyst Jesse Broehl.
The Business Network for Offshore Wind (BNOW) believes it is possible to hit 1 GW by 2023-24, according to CEO Liz Burdock. While the economy has taken a hit from the coronavirus pandemic, she said the offshore wind industry can continue growing as "the supply chain from Asia and Europe regains speed this summer, and the administration starts clearing" plans of construction.
BNOW is concerned with the economic hardship imposed on secondary and tertiary U.S. suppliers due to the global spread of COVID-19.
Offshore wind has been touted by many eastern states and governors as an opportunity to create jobs, with U.S. wind employment expected to expand, according to industry forecasts. Analysts see the growing momentum of projects as a way to further lower costs by creating a local supply chain, which could be jeopardized by a long-term shutdown and recession.
"The federal government must act now — today, not in December — and approve project construction and operation plans," a recent BNOW report said. Approving any of the seven projects before BOEM, which has recently received new lease requests, currently would allow small businesses to get to work "following the containment of the coronavirus," but approval of the projects next year "may be too late to keep them solvent."
The prospects for maintaining momentum in the industry falls largely to the Department of the Interior's Bureau of Ocean Energy Management (BOEM). The industry cannot hit the 1 GW milestone without project approvals by BOEM, which is revising processes to analyze federal permit applications in the context of "greater build out of offshore wind capacity," according to its website.
"It is heavily dependent on the project approval success," Burdock told Utility Dive.
Currently, seven projects are awaiting determinations from BOEM on their construction operation plans in Massachusetts, New York, where a major offshore wind farm was recently approved, New Jersey and Maryland, with more to be added soon, a BNOW spokesperson told Utility Dive.
To date, only one project has received BOEM approval for development in federal waters, a 12 MW pilot by Dominion Energy and Ørsted in Virginia. The two-turbine project is a stepping stone to a commercial-scale 2.6 GW project the companies say could begin installation as soon as 2024, and gave the developers experience with the permitting process.
In the U.S., developers have the capacity to develop 16.9 GW of offshore wind in federal U.S. lease areas, even as wind power's share of the electricity mix surges nationwide, Broehl told Utility Dive, but much of that is in early stages. The Navigant report did not address any impacts of coronavirus on offshore wind, he said.
Although Massachusetts has legislation in place to require utilities to purchase 1.6 GW of wind power by 2026, and several other projects are in early development stages, Navigant expects the first large offshore wind projects in the U.S. (exceeding 200 MW) will come online in 2022 or later, and the first projects with 400 MW or more capacity are likely to be built by 2024-2025, and lessons from the U.K.'s experience could help accelerate timelines. The U.S. would add about 1.2 GW in 2027, Broehl said.
The federal leasing activities along with the involvement from Eastern states and utilities "virtually guarantees that a large offshore wind market is going to take off in the U.S.," Broehl said.
Energy Justice Program drives a renewables-based transition, challenging utility monopolies with legal action, promoting rooftop solar, distributed energy, public power, and climate justice to decarbonize the grid and protect communities and wildlife nationwide.
Key Points
A climate justice initiative advancing renewables, legal action, and public power to challenge utility monopolies.
✅ Challenges utility barriers to rooftop solar and distributed energy
✅ Advances state and federal policies for equitable, public power
✅ Uses litigation to curb fossil fuel dependence and protect communities
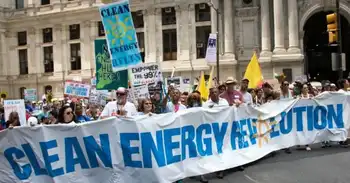
The Center for Biological Diversity on Monday rolled out a new program to push back against the nation's community- and wildlife-harming energy system that the climate advocacy group says is based on fossil fuels and a "centralized monopoly on power."
The goal of the new effort, the Energy Justice Program, is to help forge a path towards a just and renewables-based energy future informed by equitable regulation principles.
"Our broken energy system threatens our climate and our future," said Jean Su, the Energy Justice Program's new director, in a statement. "Utilities were given monopolies to ensure public access to electricity, but these dinosaur corporations are now hurting the public interest by blocking the clean energy transition, including via coal and nuclear subsidy schemes that profit off the fossil fuel era."
"In this era of climate catastrophe," she continued, "we have to stop these outdated monopolies and usher in a new electricity future that works for people and the planet."
To meet those goals, the new program will pursue a number of avenues, including using legal action to fight utilities' obstruction of clean energy efforts, helping communities advance local solar programs through energy freedom strategies in the South, and crafting energy policies on the state, federal, and international levels in step with commitments from major energy buyers to achieve a 90% carbon-free goal by 2030.
Some of that work is already underway. In June the Center filed a brief with a federal court in a bid to block Arizona power utility Salt River Project from slapping a 60-percent electricity rate hike on rooftop solar customers—amid federal efforts to reshape electricity pricing that critics say are being rushed—a move the group described (pdf) as an obstacle to achieving "the energy transition demanded by climate science."
The Center is among the groups in Energy Justice NC. The diverse coalition seeks to end the energy stranglehold in North Carolina held by Duke Energy, which continues to invest in fossil fuel projects even as it touts clean energy and grid investments in the region.
The time for a new energy system, says the Energy Justice Program, is now, as climate change impacts increasingly strain the grid.
"Amid this climate and extinction emergency," said Su, "the U.S. can't afford to stick with the same centralized, profit-driven electricity system that drove us here in the first place. We have to seize this once-in-a-generation opportunity to design a new system of accountable, equitable, truly public power."
Nighttime Thermoelectric Generator converts radiative cooling into renewable energy, leveraging outer space cold; a Stanford-UCLA prototype complements solar, serving off-grid loads with low-power output during peak evening demand, using simple materials on a rooftop.
Key Points
A device converting nighttime radiative cooling into electricity, complementing solar for low-power evening needs.
✅ Uses thermocouples to convert temperature gradients to voltage.
✅ Exploits radiative cooling to outer space for night power.
✅ Complements solar; low-cost parts suit off-grid applications.
Two years ago, one freezing December night on a California rooftop, a tiny light shone weakly with a little help from the freezing night air. It wasn't a very bright glow. But it was enough to demonstrate the possibility of generating renewable power after the Sun goes down.
Working with Stanford University engineers Wei Li and Shanhui Fan, University of California Los Angeles materials scientist Aaswath Raman put together a device that produces a voltage by channelling the day's residual warmth into cooling air, effectively generating electricity from thin air with passive heat exchange.
"Our work highlights the many remaining opportunities for energy by taking advantage of the cold of outer space as a renewable energy resource," says Raman.
"We think this forms the basis of a complementary technology to solar. While the power output will always be substantially lower, it can operate at hours when solar cells cannot."
For all the merits of solar energy, it's just not a 24-7 source of power, although research into nighttime solar cells suggests new possibilities for after-dark generation. Sure, we can store it in a giant battery or use it to pump water up into a reservoir for later, but until we have more economical solutions, nighttime is going to be a quiet time for renewable solar power.
Most of us return home from work as the Sun is setting, and that's when energy demands spike to meet our needs for heating, cooking, entertaining, and lighting.
Unfortunately, we often turn to fossil fuels to make up the shortfall. For those living off the grid, it could require limiting options and going without a few luxuries.
Shanhui Fan understands the need for a night time renewable power source well. He's worked on a number of similar devices, including carbon nanotube generators that scavenge ambient energy, and a recent piece of technology that flipped photovoltaics on its head by squeezing electricity from the glow of heat radiating out of the planet's Sun-warmed surface.
While that clever item relied on the optical qualities of a warm object, this alternative device makes use of the good old thermoelectric effect, similar to thin-film waste-heat harvesting approaches now explored.
Using a material called a thermocouple, engineers can convert a change in temperature into a difference in voltage, effectively turning thermal energy into electricity with a measurable voltage. This demands something relatively toasty on one side and a place for that heat energy to escape to on the other.
The theory is the easy part – the real challenge is in arranging the right thermoelectric materials in such a way that they'll generate a voltage from our cooling surrounds that makes it worthwhile.
To keep costs down, the team used simple, off-the-shelf items that pretty much any of us could easily get our hands on.
They put together a cheap thermoelectric generator and linked it with a black aluminium disk to shed heat in the night air as it faced the sky. The generator was placed inside a polystyrene enclosure sealed with a window transparent to infrared light, and linked to a single tiny LED.
For six hours one evening, the box was left to cool on a roof-top in Stanford as the temperature fell just below freezing. As the heat flowed from the ground into the sky, the small generator produced just enough current to make the light flicker to life.
At its best, the device generated around 0.8 milliwatts of power, corresponding to 25 milliwatts of power per square metre.
That might just be enough to keep a hearing aid working. String several together and you might just be able to keep your cat amused with a simple laser pointer. So we're not talking massive amounts of power.
But as far as prototypes go, it's a fantastic starting point. The team suggests that with the right tweaks and the right conditions, 500 milliwatts per square metre isn't out of the question.
"Beyond lighting, we believe this could be a broadly enabling approach to power generation suitable for remote locations, and anywhere where power generation at night is needed," says Raman.
While we search for big, bright ideas to drive the revolution for renewables, it's important to make sure we don't let the smaller, simpler solutions like these slip away quietly into the night.
Canada Electrification Costs: report estimates $580B-$1.4T to scale renewable energy, wind, solar, and storage capacity to 2050, shifting from natural gas toward net-zero emissions and raising average household energy spending by $1,300-$3,200 annually.
Key Points
Projected national expense to expand renewables and electrify energy systems by 2050, impacting household energy bills.
✅ $580B-$1.4T forecast for 2020-2050 energy transition
✅ 278-422 GW wind, solar, storage capacity by 2050
✅ Household costs up $1,300-$3,200 per year on average
The Canadian Gas Association says building renewable electricity capacity to replace just half of Canada's current fossil fuel-generated energy, a shift with significant policy implications for grids across provinces, could increase national costs by as much as $1.4 trillion over the next 30 years.
In a report, it contends, echoing an IEA report on net-zero, that growing electricity's contribution to Canada's energy mix from its current 19 per cent to about 60 per cent, a step critical to meeting climate pledges that policymakers emphasize, will require an expansion from 141 gigawatts today to between 278 and 422 GW of renewable wind, solar and storage capacity by 2050.
It says that will increase national energy costs by between $580 billion and $1.4 trillion between 2020 and 2050, a projection consistent with recent reports of higher electricity prices in Alberta amid policy shifts, translating into an average increase in Canadian household spending of $1,300 to $3,200 per year.
The study, prepared by consulting firm ICF for the association, assumes electrification begins in 2020 and is applied in all feasible applications by 2050, with investments in the electricity system, guided by the implications of decarbonizing the grid for reliability and cost, proceeding as existing natural gas and electric end use equipment reaches normal end of life.
Association CEO Tim Egan says the numbers are "pretty daunting" and support the integration of natural gas with electric, amid Canada's race to net-zero commitments, instead of using an electric-only option as the most cost-efficient way for Canada to reach environmental policy goals.
But Keith Stewart, senior energy strategist with Greenpeace Canada, says scientists are calling for the world to get to net-zero emissions by 2050, and Canada's net-zero by 2050 target underscores that urgency to avoid "catastrophic" levels of warming, so investing in natural gas infrastructure to then shut it down seems a "very expensive option."
Expanded Hoa Binh Hydropower Plant increases EVN capacity with 480MW turbines, commercial loan financing, grid stability, flood control, and Da River reliability, supported by PECC1 feasibility work and CMSC collaboration on site clearance.
Key Points
A 480MW EVN expansion on the Da River to enhance grid stability, flood control, and seasonal water supply in Vietnam.
✅ 480MW, two turbines, EVN-led financing without guarantees
✅ Improves frequency modulation and national grid stability
✅ Supports flood control and dry-season water supply
The extended Hoa Binh Hydropower Plant, which is expected to break ground in October 2020, is considered the largest power project to be constructed this year, even as Vietnam advances a mega wind project planned for 2025.
Covering an area of 99.2 hectares, the project is invested by Electricity of Vietnam (EVN). Besides, Vietnam Electricity Power Projects Management Board No.1 (EVNPMB1) is the representative of the investor and Power Engineering Consulting JSC 1 (EVNPECC1) is in charge of building the feasibility report for the project. The expanded Hoa Binh Hydro Power Plant has a total investment of VND9.22 trillion ($400.87 million), 30 per cent of which is EVN’s equity and the remaining 70 per cent comes from commercial loans without a government guarantee.
According to the initial plan, EVN will begin the construction of the project in the second quarter of this year and is expected to take the first unit into operation in the third quarter of 2023, a timeline reminiscent of Barakah Unit 1 reaching full power, and the second one in the fourth quarter of the same year.
Chairman of the Committee for Management of State Capital at Enterprises (CMSC) Nguyen Hoang Anh said that in order to start the construction in time, CMSC will co-operate with EVN to work with partners as well as local and foreign banks to mobilise capital, reflecting broader nuclear project milestones across the energy sector.
In addition, EVN will co-operate with Hoa Binh People’s Committee to implement site clearance, remove Ba Cap port and select contractors.
Once completed, the project will contribute to preventing floods in the rainy season and supply water in the dry season. The plant expansion will include two turbines with the total capacity of 480MW, similar in scale to the 525-MW hydropower station China is building on a Yangtze tributary, and electricity output of about 488.3 million kWh per year.
In addition, it will help improve frequency modulation capability and stabilise the frequency of the national electricity system through approaches like pumped storage capacity, and reduce the working intensity of available turbines of the plant, thus prolonging the life of the equipment and saving maintenance and repair costs.
Built in the Da River basin in the northern mountainous province of Hoa Binh, at the time of its conception in 1979, Hoa Binh was the largest hydropower plant in Southeast Asia, while projects such as China’s Lawa hydropower station now dwarf earlier benchmarks.
The construction was supported by the Soviet Union all the way through, designing, supplying equipment, supervising, and helping it go on stream. Construction began in November 1979 and was completed 15 years later in December 1994, when it was officially commissioned, similar to two new BC generating stations recently brought online.
California Duck Curve highlights midday solar oversupply and steep evening peak demand, stressing grid stability. Solutions include battery storage, demand response, diverse renewables like wind, geothermal, nuclear, and regional integration to reduce curtailment.
Key Points
A mismatch between midday solar surplus and evening demand spikes, straining the grid without storage and flexibility.
✅ Midday solar oversupply forces curtailment and wasted clean energy.
✅ Evening ramps require fast, fossil peaker plants to stabilize load.
✅ Batteries, demand response, regional trading flatten the curve.
California's remarkable success in adopting solar power, including a near-100% renewable milestone, has created a unique challenge: managing the infamous "duck curve." This distinctive curve illustrates a growing mismatch between solar electricity generation and the state's energy demands, creating potential problems for grid stability and ultimately threatening to slow California's progress in the fight against climate change.
The Shape of the Problem
The duck curve arises from a combination of high solar energy production during midday hours and surging energy demand in the late afternoon and evening when solar power declines. During peak solar hours, the grid often has an overabundance of electricity, and curtailments are increasing as a result, while as the sun sets, demand surges when people return home and businesses ramp up operations. California's energy grid operators must scramble to make up this difference, often relying on fast-acting but less environmentally friendly power sources.
The Consequences of the Duck Curve
The increasing severity of the duck curve has several potential consequences for California:
Grid Strain: The rapid ramp-up of power sources to meet evening demand puts significant strain on the electrical grid. This can lead to higher operational costs and potentially increase the risk of blackouts during peak demand times.
Curtailed Energy: To avoid overloading the grid, operators may sometimes have to curtail excess solar energy during midday, as rising curtailment reports indicate, essentially wasting clean electricity that could have been used to displace fossil fuel generation.
Obstacle to More Solar: The duck curve can make it harder to add new solar capacity, as seen in Alberta's solar expansion challenges, for fear of further destabilizing the grid and increasing the need for fossil fuel-based peaking plants.
Addressing the Challenge
California is actively seeking solutions to mitigate the duck curve, aligning with national decarbonization pathways that emphasize practicality. Potential strategies include:
Energy Storage: Deploying large-scale battery storage can help soak up excess solar electricity during the day and release it later when demand peaks, smoothing out the duck curve.
Demand Flexibility: Encouraging consumers to shift their energy use to off-peak hours through incentives and smart grid technologies can help reduce late-afternoon surges in demand.
Diverse Power Sources: While solar is crucial, a balanced mix of energy sources, including geothermal, wind, and nuclear, can improve grid stability and reduce reliance on rapid-response fossil fuel plants.
Regional Cooperation: Integrating California's grid with neighboring states can aid in balancing energy supply and demand across a wider geographical area.
The Ongoing Solar Debate
The duck curve has become a central point of debate about the future of California's energy landscape. While acknowledging the challenge, solar advocates argue for continued expansion, backed by measures like a bill to require solar on new buildings, emphasizing the urgent need to transition away from fossil fuels. Grid operators and some utility companies call for a more cautious approach, emphasizing grid reliability and potential costs if the problem isn't effectively managed.
Balancing California's Needs and its Green Ambitions
Finding the right path forward is essential; it will determine whether California can continue to lead the way in solar energy adoption while ensuring a reliable and affordable electricity supply. Successfully navigating the duck curve will require innovation, collaboration, and a strong commitment to building a sustainable energy system, as wildfire smoke impacts on solar continue to challenge generation predictability.